Research Article Open Access
CD38 as Surrogate Marker for HIV Infection in Antiretroviral Naive and Antiretroviral Experienced Patients in Kenya
Njuguna AN1*, Juma KK2, Waihenya RK3, Mpoke S4, Mbuchi M5, Muthami L6, Mathaai R7, Otieno P4 and Nyakundi P4
1Institute of Tropical Medicine and Infectious Diseases, Jomo Kenyatta University of Agriculture and Technology, P.O. Box 62000-00200, Nairobi, Kenya
2Department of Biochemistry and Biotechnology, Kenyatta University, , P.O Box 43844-00100, Nairobi, Kenya
3Department of Zoology, Jomo Kenyatta University of Agriculture and Technology, P.O. Box 62000-00200, Nairobi, Kenya
4Kenya Medical Research Institute, Center for Biotechnology Research and Development, Kenya
5Kenya Medical Research Institute, Center for Clinical Research, kenya
6Kenya Medical Research Institute, Center for Public Health and Research, P.O. Box 54840 - 00200, Nairobi, Kenya
7Department of Biochemistry, University of Nairobi, P.O. Box 30197, G.P.O, Nairobi, Kenya
- *Corresponding Author:
- Adele Nyambura Njuguna
Institute of Tropical Medicine and Infectious Diseases
Jomo Kenyatta University of Science and Technology
P.O. Box 51791 00200,Nairobi, Kenya
Tel: 2540725502005
E-mail: njugunaadele@yahoo.com
Received date: May 19, 2016; Accepted date: June 13, 2016; Published date: June 17, 2016
Citation: Njuguna AN, Juma KK, Waihenya RK, Mpoke S, Mbuchi M, et al. (2016) CD38 as Surrogate Marker for HIV Infection in Antiretroviral Naive and Antiretroviral Experienced Patients in Kenya. Adv Mol Diag 1:107. doi:10.4172/amd.1000107
Copyright: © 2016 Njuguna AN, et al. This is an open-access article distributed under the terms of the Creative Commons Attribution License, which permits unrestricted use, distribution, and reproduction H2O in any medium, provided the original author and source are credited.
Visit for more related articles at Advances in Molecular Diagnostics
Abstract
Human Immunodeficiency Virus (HIV) patient management continues to be a challenge all over the world. CD4 absolute counts and viral load are the gold standard tools for monitoring of HIV-1 disease. However, the use of CD4 counts cannot be used solely to determine the overall status of immune system. It requires the additional measurement of viral load. Determination of viral load is also expensive in many places that are limited with resources. Therefore, there is need for identification of other markers for management of HIV. CD38 is one such candidate marker. The main the correlation between CD38 antibody binding capacity (ABC) and viral load. A a negative correlation was established for participants not on drugs, whereas a positive correlation was exhibited between CD4 and viral load for group on drugs. There was a significant correlation between CD38 ABC and viral load. CD38 levels for the group not on drugs was elevated the same way viral load was, whereas for the group on drugs CD38 levels were lowered the same way as viral load. There was no significant correlation between ages with the outcome from the two groups. Quantification of CD38 may therefore be an affordable test that can serve as an extra tool in HIV-1 management. However, more studies are required to justify the use of CD38 as a surrogate marker for HIV patients on ART.
Keywords
CD38; CD8; Viral load; HIV-1; ARV treatment; CD38 Antibody binding capacity; CD38 ABC
Introduction
Measurements of cluster of differentiation (CD) 4 (CD4) absolute counts and viral load are the two common tools used to monitor disease progression in HIV-1-infected patients on drug therapy [1,2]. However, there are certain limitations in the use of these tools. Although patients on highly active antiretroviral treatment (HAART) will often exhibit suppressed viral load within the first three weeks of treatment, this is commonly not necessarily accompanied by rapid changes in absolute CD4 counts, thus rendering measurement of levels of CD4 cells unreliable indicators of efficacy of the anti-retroviral treatment at the early stages of intervention. Currently, only viral load determination offers a reliable prognostic indicator for antiretroviral (ARV) treatment. However, the cost of estimating viral load is prohibitive, making it difficult for adoption as a routine test. There is need therefore to identify other markers whose levels change rapidly following ARV treatment. Previous studies conducted in Ivory Coast on HIV-1 indicate that CD8+/CD38+ activation molecule can be a sensitive and independent marker [3]. The possible association between CD8+ T lymphocyte subsets defined by CD38 antibody binding capacity (ABC) expression, and immunological and virological parameters in the course of HIV infection has, to date, received little attention [4,5]. Moreover, the link between inflammation, coagulation, and activation of T cells is not established. However, it is suggested that they can be used as predictors of disease progression in patients with human immunodeficiency virus (HIV) and being managed with combination antiretroviral therapy (cART) [6,7]. Evidence of involvement of inflammation/coagulation has been associated with mortality and morbidity in non-AIDs patients. In these conditions, there were no significant associations with the disease outcomes. It is also now known that CD38 is a T cell activation marker. A significant correlation between CD38+CD8+ T cells with disease progression in untreated HIV infection has also been reported [8,9]. However, suppression of CD38+CD8+ T cells by the use of cART suggests that it has no impact on their levels; they remain elevated abnormality [10]. The prognostic value of CD38+ has never been clear [11,12]. To date, it is still remains unclear on the association of T cells with increased morbidity and mortality of patients using ART. There is also need for development of novel interventions that will manage excessive inflammatory and immune activations when using ART. However, the potential for their application as surrogate markers for disease progression has not beed determined and findings are still inconclusive as a result of the mixed findings. For instance, Tenorio et al. [6] and Hunt et al. [7] did not find any association between CD38 expressions on CD8+ T cells with disease outcome as opposed to existing literature.
Therefore, this study aims to determine the association between CD38+ and disease outcomes in untreated and treated patients of HIV by investigating their levels.
Thus, we have here addressed this question by performing a crosssectional study involving untreated and treated patients, and by investigating levels of these parameters at one point.
Materials and Methods
Study area and population
The study population comprised of regular adult patients attending Mbagathi District Hospital HIV clinic, Nairobi, Kenya. These participants in this study were either on antiretroviral therapy or antiretroviral naive returning to clinic for routine checkup. A total of 84 study participants who were HIV-1 positive were enrolled. 44 were on antiretroviral therapy, whereas 40 were not placed on any treatments of ARVs. These were patient who regularly visited Mbagathi district hospital HIV clinic.
Ethical considerations
The study was conducted under protocol approved by Kenya Medical Research Institute (KEMRI) scientific steering committee (SCC No.1035).
Collection of fresh whole blood
Approximately 3-5 ml of whole blood from consenting patient was collected in Ethylene di-amine tetra acetic acid (EDTA). Approximately 100 μl of blood was used for determining CD4 absolute count and CD38 antibodies bound per cell. The remaining blood was centrifuged at 604 g for five minutes. The plasma that was separated was then used to determine the overall viral load in the patients.
Determination of CD4+ T cell absolute count
The CD4+ T cell absolute count was determined using Becton Dickinson (BD) multitest reagents and Tru Count tube according to manufacturer’s instructions. To 20 μl of multitest reagent CD45 PerCP, CD3 FITC, CD4 APC, CD8 PE monoclonal antibody catalog number 340491, 50 μl of whole blood was added, vortexed and incubated in the dark for 15 minutes. It was then fixed and lysed for a further 15 minutes in the dark room. Finally acquisition and analysis was done on multiset™ software using BD FACS calibur instrument (Becton Dickinson, USA) Catalog No. 342975.
Determination of CD38 activation marker
To determine the CD38 activation marker 5 μl (BD multitest CD8 FITC/ CD38 PE/ CD3 PerCP/Anti-HLA DR APC) monoclonal antibodies, were added to the bottom of BD falcon disposable 12 75 mm capped polystyrene test tubes. To this, 50 μl of well-mixed EDTA and fresh whole blood was added. After vortexing gently, incubation was done in dark room for 15 min. BD FACS lysing solution 450 μl 1X was added and further incubated in dark confinement for 15 minutes. Acquisition and analysis was performed on a BD FACS calibur instrument using cellquest™ software.
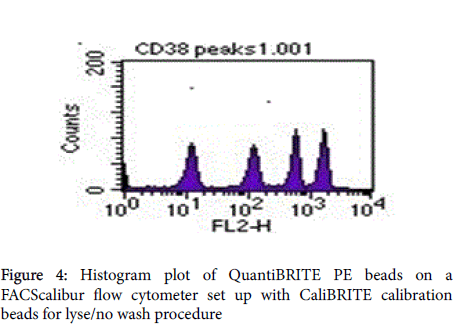
Quantibrite beads (acquired on the same instrument settings as the sample [BD Quantibrite PE tubes catalog No. 340495]) were reconstituted using 0.5 ml of phosphate buffer (Ph7) with 0.5% azide BSA. In this study CD8+/CD38+ are reported as CD38 ABC.
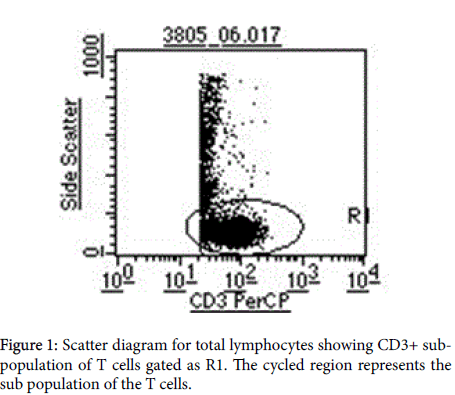
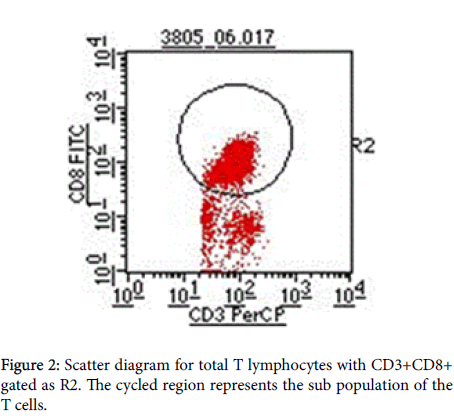
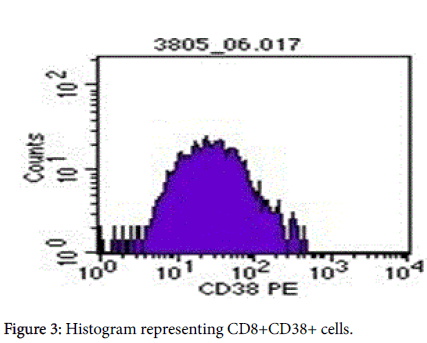
Gate R2 that represents CD3+CD8+ (Figures 1 and 2) was applied on Figure 3 histogram. Histogram statistics were then generated to give geometric mean fluorescence emanating from CD3/CD8/CD38 population, which was then used to determine the levels of CD38 ABC using a standard Quantibrite histogram peaks (Figure 4) as follows:
Flow-cytometry profiles demonstrating CD38 and on CD4+ and CD8+ T cells in an HIV-sera-positive individual. Samples were first gated on the CD3+ then CD8+ T cell population, and the percentage of CD38+ cells was determined. Preset gating for CD38 (Figure 3) and HLA-DR expression on CD8+ T cells was used for all analysis and quantification of CD38 expression. Figures 3 and 4 represents the conversion of CD38 expression to absolute counts.
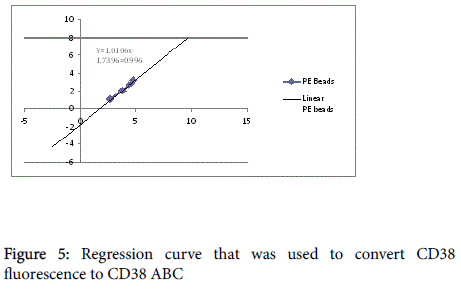
The geometric mean fluorescence was converted to log10 for each PE molecule per bead. Additionally, a lot specific value for PE molecules per bead from the kit was also converted to log10. A linear regression of log10 PE molecules per bead against log10 fluorescence using the equation y=mx + c was plotted on a spreadsheet and used for calculation of CD38 ABC for all the participants (Figure 5).
Determination of viral load
This was determined using the comprehensive bio-analytical system (COBAS) Amplicor™ HIV-1 Test, Version 1.5. This is a qualitative in vitro test for the direct detection of Human Immunodeficiency Virus Type 1 (HIV-1) RNA in human plasma. The COBAS Amplicor HIV-1 Test, v1.5 uses polymerase chain reaction (PCR) technology to achieve maximum sensitivity for the detection of HIV-1-RNA in plasma samples. The plasma used was stored at -80°C for viral load determination.
Data Analysis
The data was analyzed using statistical package for social sciences (SPSS) version 17.0. Pearson’s a non-parametric test was used for correlation between CD4, viral load and CD38+. P values <0.005 were considered significant.
Results
Overall, 84 patient were enrolled for the study. Out of the 40 not on drugs, 27 were female and 13 were male. Out of 44 on drugs, 29 were female and 15 were male. The majority of participants were between 34 and 35 years (Table 1).
| Indicators | Study Groups | Mean | Median | Minimum | Maximum | Std | P value |
|---|---|---|---|---|---|---|---|
| Deviation | (non-parametric) | ||||||
| Age | Not on drugs | 35 | 34 | 22 | 60 | 8 | 0.42 |
| On drugs | 36 | 35 | 23 | 66 | 10 | ||
| Weight | Not on drugs | 63 | 60 | 46 | 94 | 12 | 0.775 |
| On drugs | 62 | 62 | 28 | 87 | 12 | ||
| Viral load | Not on drugs | 41085 | 7321 | 0 | 300000 | 74740 | <0.001 |
| On drugs | 1453 | 0 | 0 | 23000 | 4539 | ||
| Cd4 | Not on drugs | 480 | 457 | 2 | 1276 | 290 | 0.002 |
| On drugs | 311 | 287 | 61 | 1199 | 217 | ||
| Cd38_abc | Not on drugs | 2584 | 1933 | 441 | 13285 | 2601 | <0.001 |
| On drugs | 1303 | 1113 | 416 | 4792 | 817 |
Table 1: Means and standard deviations of study variables of the study population
There was no significant correlation between age and the study outcome. The range of weight for participants on drugs and not on drugs was 60 Kg to 62 Kg. The ages of the participants ranged from 22-66 years and did not differ significantly (p =0.420) between the two groups (Table 1). The mean value for CD38 ABC for the group on drugs was 1303ABC, which is considerably lower compared to the naïve group at 2584 cells/μl. For the group on drugs the mean viral load was 1453 copies/μl whereas for the group not on drugs the mean viral load was 41085 copies/μl. Similarly, there was no significant correlation between CD8+ CD38+ and all the other variables on controlling for all other variables (Table 2).
| Unstandardized Coefficients | Standardized Coefficients | t | Sig. | 95% Confidence Interval for B | |||
|---|---|---|---|---|---|---|---|
| B | Std. Error | Beta | Lower Bound | Upper Bound | |||
| (Constant) | 2170.65 | 1818.723 | 1.194 | 0.236 | -1451.65 | 5792.951 | |
| Log_VIRA | 138.888 | 120.706 | 0.157 | 1.151 | 0.253 | -101.518 | 379.295 |
| CD4 | -0.661 | 0.854 | -0.093 | -0.774 | 0.441 | -2.362 | 1.04 |
| WEIGHT | -19.395 | 17.054 | -0.118 | -1.137 | 0.259 | -53.361 | 14.57 |
| AGE | -33.331 | 22.149 | -0.16 | -1.505 | 0.136 | -77.444 | 10.781 |
| DRUG | 429.622 | 244.632 | 0.341 | 1.756 | 0.083 | -57.605 | 916.848 |
| DRUG D | -19.102 | 26.455 | -0.097 | -0.722 | 0.472 | -71.791 | 33.587 |
| STAGE | 485.484 | 286.733 | 0.242 | 1.693 | 0.095 | -85.595 | 1056.563 |
Table 2: CD38 in relation to all study variable.
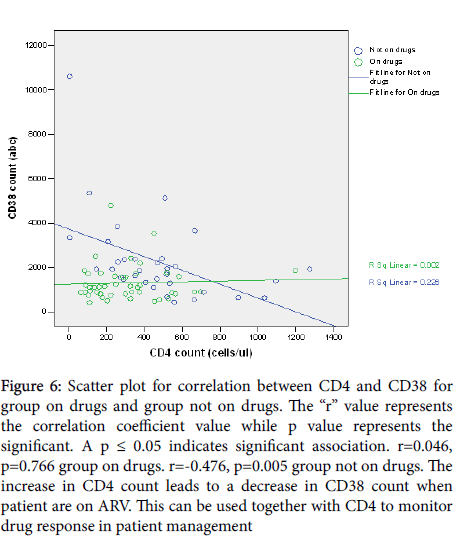
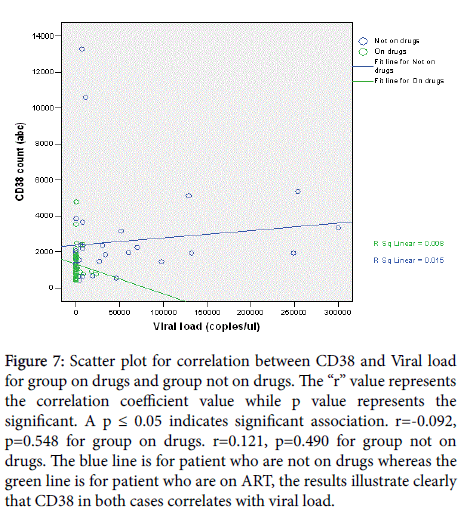
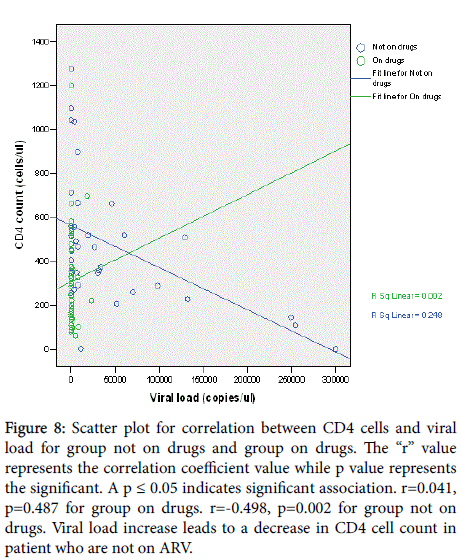
A positive correlation (r=0.046, p=0.766) existed between CD4 absolute count and CD38 ABC for participants on drugs whereas a negative correlation coefficient= (r=-0.476, p=0.005) was observed for participants not on drugs (Figure 6). Viral load was positively correlated with CD38 ABC for group not on drugs (r =0.121, p =0.490) and negatively correlated for group on drugs(r =-0.092, p =0.548) (Figure 7). However, the sample size was too small to definitively establish whether the correlation between the viral load and the CD38 measurements was related to age. Similarly, the viral load was positively correlated with CD4 count for group on drugs (r=0.041, p=0.487) and negative correlation for group not on drugs (r=-0.498, p=0.002) (Figure 8).
Figure 6: Scatter plot for correlation between CD4 and CD38 for group on drugs and group not on drugs. The “r” value represents the correlation coefficient value while p value represents the significant. A p ≤ 0.05 indicates significant association. r=0.046, p=0.766 group on drugs. r=-0.476, p=0.005 group not on drugs. The increase in CD4 count leads to a decrease in CD38 count when patient are on ARV. This can be used together with CD4 to monitor drug response in patient management
Figure 7: Scatter plot for correlation between CD38 and Viral load for group on drugs and group not on drugs. The “r” value represents the correlation coefficient value while p value represents the significant. A p ≤ 0.05 indicates significant association. r=-0.092, p=0.548 for group on drugs. r=0.121, p=0.490 for group not on drugs. The blue line is for patient who are not on drugs whereas the green line is for patient who are on ART, the results illustrate clearly that CD38 in both cases correlates with viral load.
Figure 8: Scatter plot for correlation between CD4 cells and viral load for group not on drugs and group on drugs. The “r” value represents the correlation coefficient value while p value represents the significant. A p ≤ 0.05 indicates significant association. r=0.041, p=0.487 for group on drugs. r=-0.498, p=0.002 for group not on drugs. Viral load increase leads to a decrease in CD4 cell count in patient who are not on ARV.
Discussion
Monitoring of the HIV epidemic as a strategy for effective control and management of HIV/AIDS disease remains a challenge in Africa [13]. Whereas significant efforts have been made in scaling up the use of antiretroviral (ARV) drugs, including a substantial reduction in the costs of these drugs, routine monitoring of individual HIV patients to assess response to drug therapy also remains a challenge [14]. The reasons behind this challenge are varied but range from unavailability of adequate facilities with CD4 and viral load testing equipment to the relatively expensive nature of these tests [15]. This study was aimed at evaluating the potential usefulness of CD38 activation molecule as a surrogate marker for HIV disease progression, specifically asking the research question of whether or not CD38 may be used, under certain circumstances, to replace the need for viral load testing.
The results from this study have demonstrated a strong positive correlation, with statistical significance, between CD38 and viral load, where a rise in viral load was correlated with a rise in CD38 cells, and similarly, a drop in viral load was correlated with a drop in CD38 cells. This study has demonstrated a positive correlation between CD38 and viral load for group not taking antiretroviral therapy and a negative correlation for the group on drugs. It is documented that a significant distribution of HIV-specific CD8 T-cells resides in the CD8 CD38 Tcell sub-population [16]. Increased CD38 ABC expression on CD8+ T cells in HIV infection is associated with high viral loads, disease progression and death in adults [17]. This is contrary to the findings made by Tenorio et al. [6] and hunt et al. [7].
Moreover, a negative correlation between CD4 and CD38 was observed on the group not on drugs which depicts the observed relation of CD4 and viral load in HIV infection. Thus, these study findings are in agreement with other studies findings done on children on HAART where they did observe that good responders to antiretroviral therapy had a negative correlation of CD38 to viral load [18].
The two study groups show significant difference on viral load, CD4 absolute count and CD38 ABC (Table 1). This shows that at different stage of HIV progression and during treatment CD38 ABC expression varies, hence need for further studies to establish normal reference ranges and follow up studies that will reflect the levels and expression of CD38ABC in HIV-1 patient at various stages of disease progression. The findings of this study confirm the possible utility of CD38 ABC as a prognostic marker in HIV-1 infected patients in Kenya. Similar study done in Uganda show up regulation of CD38 in HIV compared naïve patient [19]. In addition, the CD38 expression normal reference range values from different countries vary significantly [20], therefore it important to establish the normal reference value for Kenya using a Kenyan population.
These results are similar to a previous report where a positive correlation was observed in a drug naïve pediatric population [21,22]. In another study involving long-term non-progressors, who were not receiving any antiretroviral therapy, a similarly strong positive correlation was observed between CD38 cells and viral load [23]. This positive correlation between CD38 and viral load has also been demonstrated even with cryopreserved cells, suggesting that CD38 expression, whether from fresh or frozen samples, may provide a useful predictor of HIV disease progression [24]. In this study, there was no association between CD38 and disease progression and hence, lacks the merit to be used as a marker for clinical disease progression.
The results from this study also indicate that when the viral load is suppressed through use of active antiretroviral, a reduction in the number of CD38 cells is also observed. These results are in agreement with previous published reports demonstrating a reduction of CD8+CD38+ cells in parallel with plasma viremia, following active antiretroviral therapy [25]. Consequently, it is possible that active HIV replication has a profound impact on the expression of CD38 cells. Furthermore, the observed higher count of CD38 in untreated patients in comparison to the treated group suggests a possible application of CD38 as a potential marker of non-adherence to therapy and also drug resistance development.
In this study, CD38 cells were measured as CD38 ABC on CD8+CD38+ cells. One would argue that the observed trends in CD38 may not be due to the CD38 molecule per se, but a function of the CD8+ cells. The role of CD8+ cells in HIV disease is well known. CD8+ T cell-mediated immune responses play an important role in host defenses against viral infections. Previous studies of immune responses in HIV-infected individuals have suggested that CD8+ T cells play an important role in controlling viral replication, as evidenced by the emergence of HIV-specific CD8+ cytotoxic T lymphocyte (CTL) activity coinciding with a decline in plasma viremia during primary infection [26] and a diminution of CTL responses preceding disease progression in infected individuals [27]. Further studies that have examined the capacity of CD8+ T cells to express intracellular IFN-γ in response to a broad range of HIV antigens have shown that a large proportion of infected individuals harbor significant numbers of HIV-specific CD8+ T cells and yet fail to effectively control viral replication, as manifested by high levels of plasma viremia [28].
These studies indicate that while CD8 levels are high, the levels of plasma viremia can either be low or high, suggesting that there is no direct correlation between CD8 levels and viral load. Therefore the observed trend in CD38 cells is a true reflection of the dynamics of these cells during HIV infection in the presence or absence of ARV therapy. Taken together, these results indicate that the CD38 cells can serve as independent indicators of the trend of viral load.
Since the early years of the HIV/AIDS epidemic, clinicians have monitored patients’ CD4 cell counts as an indicator of immune function. As CD4 numbers decline, the risk of rapid disease progression become eminent. The levels of CD4 cells, expressed both as percentages or absolute counts, are conveniently measured by flow cytometry. However, CD4 cells count alone has an inherent limitation of, among other things, not being able to define the precise clinical presentation of a HIV infected individual. Several cases abound where patients with CD4 counts of <200 cells/μl of whole blood, as defined by WHO as the stage to initiate ARV therapy, may either be symptomatic or asymptomatic. Furthermore, during ARV therapy, the changes in CD4 levels may not necessarily be rapid but will exhibit a rather gradual increase or decrease depending on the outcome of the therapy. These observations make it difficult for clinicians to make solid decisions on the basis of CD4 counts alone.
It is in this context that in the mid-1990s, clinicians also began to routinely monitor HIV viral load, which is a direct measure of viral replication. Viral load has since been shown to be a better predictor of the HIV disease progression or death than CD4 count. A single HIV-1 RNA measurement is also a good predictor of time to AIDS, explaining almost half of the variability in clinical relevant outcome [16]. High variance around CD4 regression lines likely accounted for the inability of any marker to explain CD4 cell decline. The predictive value of HIV-1 RNA for time to AIDS reaffirmed the central role of viremia in AIDS pathogenesis and strongly supported the use of HIV-1 RNA for patient management. In a related study, [29] investigated the relationship between HIV RNA levels and CD4 cell decline, as well as the predictive value of HIV RNA for clinical disease progression. The results from these studies suggested that HIV viral load was the best predictor of progression to AIDS or death over the long term, but that CD4 cell count can play a role in predicting short-term 1-2 year disease progression.
The deleterious effects of active viral replication on immunologic functions of various subsets of lymphocytes in HIV-infected individuals have been well documented [30]. Among those, expression of CD38, a surface antigen with multiple functions on CD8+ T cells [31], has been well accepted as a prognostic marker for disease progression in infected individuals who do not control viral replication [8]. In addition, it has been speculated that an increase of CD8+ T cells expressing CD38 is a reflection of HIV-mediated immune activation and that these cells are ultimately unable to control viral replication or prevent disease progression [8]. The results from the present study give further insight into the pathophysiologic relationship between HIVspecific CD8+ T cells and CD38 expression that result from HIVdriven aberrant immune activation in patients who are not receiving antiretroviral therapy and those receiving antiretroviral.
Conclusion
Early administration of ART in HIV is very significant in the management of HIV. In order to ensure a sustained suppression of HIV in ART, there is need to screen and identify specific biomarkers be better indicators for increased surveillance for development of drug resistance, improvement in the general health of the HIV patient’s, quality of life, survival rate and above all, decreased HIV transmission rates. The use of viral load and CD4 has been used as a gold standard for a long period of time. The correlation between the viral load and CD 38 may therefore offer an alternative indicator for monitoring of HIV-1 progression. Quantification of CD38 may also offer an alternative and an affordable test that can serve as an extra tool in the management of HIV-1. This will possibly offer a long term solution to monitoring of adherence to ART as a critical determinant of the disease outcome, progression and improvement in health and quality of life of HIV infected patients. Moreover, a study with more factors influencing outcome of the observation and use of a larger sample size should be conducted. This study also suggests that T cell counts may be determined with more than one measurement so as to provide more information of the well-known variations of laboratory findings for these variables.
Acknowledgement
We are grateful to patient from Mbagathi District Hospital for participating in this study and theco-operating laboratories at National Public Reference Labs and KEMRI.
Conflict of Interest
The Authors declare no conflict of interest
Funding
BD international by Nick bright
References
- Levine BL, Mosca JD, Riley JL, Carroll RG, Vahey MT, et al. (1996) Antiviral effect and in vivo CD4+ cell proliferation in HIV positive patients as a result of CD28Co-stimulation. Science 272: 1939-1943.
- Kitchen SG, Korin YD, Roth MD, Landay A, Zack JA (1998) Co-stimulation of naïve CD8+lymphocytes induces CD4 expression and allows human immunodeficiency virus type 1 infection. J Virol 72: 9054-9060.
- Ondoa P, Koblavi-Dème S, Borget MY, Nolan ML, Nkengasong JN, et al. (2004) Assessment of CD8+T cell immune activation markers to monitorresponse to antiretroviral therapy among HIV-1 infected patients in Ivory Coast. British Society for Immunology, Clinical and Experimental. Immunology 140: 138-148.
- Bouscarat F, Levacher-Clergeot M, Dazza MC, Strauss KW, Girard PM, et al. (1996) Correlation of CD8 lymphocyte activation with cellular viremia and plasma HIV RNA levels in asymptomatic patients infected by human immunodeficiency virus type 1. AIDS Res Hum Retrovir12: 17–24.
- Silvestri G, Munoz C, Butini L, Bagnarelli P, Montroni M (1997) Changes in CD8 cell subpopulations induced by antiretroviral therapy in human immunodeficiency virus infected patients. Viral Immunol 10: 207–212.
- Tenorio AR, Zheng Y, Bosch RJ (2014) Soluble markers of inflammation and coagulation but not T-cell activation predict non-AIDS defining morbid events during suppressive antiretroviral treatment. J Infect Dis 210: 1248–1259.
- Hunt PW, Sinclair E, Rodriguez B (2014) Gut epithelial barrier dysfunction and innate immune activation predict mortality in treated HIV infection. J Infect Dis; 210: 1228–1238.
- Giorgi JV, Lyles RH, Matud JL, Yamashita TE, Mellors JW, et al. (2002) Predictive value of immunologic and virologic markers after long or short duration of HIV-1 infection. J Acquir Immune DeficSyndr 29: 346-355.
- Deeks SG, Kitchen CM, Liu L, Guo H, Gascon R, et al. (2004) Immune activation set point during early HIV infection predicts subsequent CD4+ T-cell changes independent of viral load. Blood 104: 942-947.
- Hunt PW, Martin JN, Sinclair E, Bredt B, Hagos E, et al. (2003) T cell activation is associated with lower CD4+ T cell gains in human immunodeficiency virus-infected patients with sustained viral suppression during antiretroviral therapy. J Infect Dis 187: 1534-1543.
- Lee SA, Sinclair E, Jain V, Huang Y, Epling L, et al. (2014) Low proportions of CD28− CD8+ T cells expressing CD57 can be reversed by early ART initiation and predict mortality in treated HIV infection. J Infect Dis210: 374-382.
- Sandler NG, Zhang X, Bosch RJ, Funderburg NT, Choi AI, et al. (2014) Sevelamer does not decrease lipopolysaccharide or soluble CD14 levels but decreases soluble tissue factor, low-density lipoprotein (LDL) cholesterol, and oxidized LDL cholesterol levels in individuals with untreated HIV infection. J Infect Dis 210: 1549–1554.
- Ogunbodede EO (2004) HIV/AIDS situation in Africa.Int Dent J 54: 352-360.
- Chesney MA (2006) The elusive gold standard: future perspectives for HIV adherence assessment and intervention. JAIDS Journal of Acquired Immune Deficiency Syndromes 43: S149-S155.
- http://www.who.int/chp/knowledge/publications/adherence_full_report.pdf
- Rodríguez JW, RodríguezL A,Font G, Cubano LA, Boukli NM, et al. (2007) Co-expression of Apoptosis-Related Molecules on Activated CD8+ CD38+ T-cells is Associated with HIV-1 Disease Progression Americ. J Infect Dis 3: 208-216.
- de Martino M, Rossi ME, Azzari C, Gelli MG, Galli L, et al. (1998) Different meaning of CD38 molecule expression on CD4+ and CD8+ cells of children perinatally infected with human immunodeficiency virus type-1 infection surviving more than five years. PediatricResearch 43: 752-758.
- Ressino S, Bellon JM, Gurbindo MD,Muñoz-Fernández MA(2004) CD38 Expression in CD8+ T Cells Predicts Virological Failure in HIV Type 1–Infected Children Receiving Antiretroviral Therapy. Clin Infect Dis 38: 412-417.
- Mark PE, Banson B, Martin O, Steven M, Norman J, et al. (2005) T Cell Activation in HIV-Seropositive Ugandans: Differential Associations with Viral Load, CD4+ T Cell Depletion, and Co-infection. J Infect Dis 191: 694-701.
- Sukwit S, Chuenchitra T, Rojanasang P, Wiwattanakul S, Saksopin L, et al. (2005) Distribution of CD38+ molecules on CD3+ and CD8+ T lymphocytes Adulthood in HIV-1 uninfected. Thais J Med Assoc88: 48-55.
- Sirera R, Bayona A, Carbonell F, Perez-Tamarit D, Otero MC, et al. (1998) The expression of CD38 and DR are markers of immune activation and disease progression in HIV+ children. 12th World AIDS Conference, Geneva, Switzerland, 528 CasparieMeerhugowaard: The Netherlands. Abstract 213: 31166.
- Sherman GG, Scott LE, Galpin JS (2002). CD38 expressionon CD8+ T cells as a prognostic marker in vertically HIV-infected pediatric patients. Pediatrics Research 51: 740-745.
- Tae-wook C, Shawn J, Christina S, Claire WH, Marie AP, et al. (2004). Relationship between the frequency of HIV-specific CD8+ T cells and the level of CD38+CD8+ T cells in untreated HIV-infected individuals. PNAS 101: 2464-2469.
- Perfetto SP, Malone JD, Hawkes C, McCrary G, August B, et al. (1998) CD38 expression on cryopreserved CD8+ T cells predicts HIV disease progression. Cytometry 33: 133-137.
- Benito J, Lopez M, Lozano S, Marttinez P (2003) Different levels of immune activation in naive and memory subset of CD4 and CD8 T lymphocytes in chronic HIV infection–effects of antiretroviral therapy.10th CROI abstract 343.
- Borrow P, Lewicki H, Hahn BH, Shaw GM, Oldstone MB (1994) HIV versus cytotoxic T lymphocytes J Virol 68: 6103-6110.
- Klein MR, van Baalen CA, Holwerda AM, KerkhofGarde SR., Bende RJ, et al. (1998) Kinetics of Gag-specific cytotoxic T lymphocyte responses during the clinical course of HIV-1 infection: a longitudinal analysis of rapid progressors and long-term asymptomatics. J Exp Med 181: 1365-1372.
- Gea-Banacloche JC, Migueles SA, Martino L, Shupert WL, McNeil AC, et al. (2000)Maintenance of Large Numbers of Virus-Specific CD8+ T Cells in HIV-Infected Progressors and Long-Term Nonprogressors J Immun 165: 1082-1092.
- Lau B, Gange S, Kirk G (2007) Predictive Value of Plasma HIV RNA Levels for Rate of CD4 Decline and Clinical Disease Progression. 14th Conference on Retroviruses and Opportunistic Infections (CROI). Los Angeles, California. February 25-28.
- Lane HC, Masur H, Edgar LC, Whalen G, Rook AH, et al. (1983) Abnormalities of B-cell activation and immunoregulation in patients with the acquired immunodeficiency syndrome. N Engl J Med 309: 453-458.
- Savarino A, Flavia B, Bottarel F (2000) Effect of human CD38 glycoprotein on the early stage of the HIV replication cycle. AIDS 14: 1079-1089.
Relevant Topics
Recommended Journals
Article Tools
Article Usage
- Total views: 12589
- [From(publication date):
August-2016 - Apr 04, 2025] - Breakdown by view type
- HTML page views : 11637
- PDF downloads : 952
