Research Article Open Access
Carbonate Reservoirs Petrophysical Analysis of Bai Hassan Oil Field North of Iraq
| Qays Mohammed Sadeq* and Wan Ismail Wan Bin Wan yusoff | |
| Department of Petroleum Geoscience, Universiti Teknologi Petronas, Perak, Malaysia | |
| Corresponding Author : | Qays MS Department of Petroleum Geoscience Universiti Teknologi Petronas, Perak, Malaysia Tel: +9647701244627 Fax: +605 365 5670 E-mail: qase1967@yahoo.com |
| Received: June 05, 2015; Accepted: September 09, 2015; Published:September 11, 2015 | |
| Citation: Sadeq QM, yusoff WIWBW (2015) Carbonate Reservoirs Petrophysical Analysis of Bai Hassan Oil Field North of Iraq. J Bioremed Biodeg 6:311. doi:10.4172/2155-6199.1000311 | |
| Copyright: © 2015 Sadeq QM, et al. This is an open-a ccess article distributed under the terms of the Creative Commons Attribution License, which permits unrestricted use, distribution, and reproduction in any medium, provided the original author and source are credited. | |
| Related article at Pubmed, Scholar Google | |
Visit for more related articles at Journal of Bioremediation & Biodegradation
Abstract
Bai Hassan Field is one of several elongated, asymmetrical, doubly plunging anticlines in northern Iraq. This field occupies a stratigraphically complex area comprising multiple facies developments of a complicated digenetic history. Abundant and variable porosity and permeability exist which, although primarily lithology dependent, are enormously enhanced by the development of intensive faults, fractures and joints, this combination ofuncommonly high porosity and permeability gives rise to enormously high and continuous production. The initial petrophysical interpretation consisted of a two-phase workflow. The first interpretation phase consisted of calculating both the dry mineral volumes such as calcite and dolomite and the total porosity using a matrix solution procedure. For a full suite of lithology and porosity, measurements (gamma ray, sonic, density, and neutron) up to four mineral components plus porosity were calculated. If fewer measurements were available, simpler lithology models were employed. Standard lithology models were set up for the observed assemblages of rock types. For example, models for the calcite-dolomite-anhydrite-porosity assemblage and the dolomite-calcite-clay-porosity assemblage were set up. When available, core data were used to check the interpretation model results and to adjust the model. The second interpretation phase calculated the water saturation using the Archie water saturation equation.
| Keywords |
| porosity; Permeability; Fracture; Petrophysical interpretation; Dry mineral; Archi formula; Matrix; Well log; Matrix solution technique |
| Introduction |
| Bai Hassan field occupies a stratigraphically complex area comprising multiple facies developments of a complicated diagenetic history [1]. Abundant and variable porosity and permeability exist which, although primarily lithology dependent, are enormously enhanced by the development of intensive faults, fractures and joints, this combination of uncommonly high porosity and permeability gives rise to enormously high and continuous production. The maximum reservoir thickness is generally taken as approximately 225 m comprising six main facies types: |
| Transition zone limestone: |
| These are normally too thin and variable to be included in the gross reservoir, though free communication with the main reservoir exists via fractures. |
| The basal fars conglomerate: |
| These are normally non-porous and impermeable, but produce where fractured. |
| Back-reef and reef limestone facies: |
| These are highly fossiliferous, but completely cemented. Blue clays of the Lower Fars now infill cavities and fissures in the upper part of these beds, sealing any possible porosity. With recrystallization, minor matrix porosity occurs, but production is only possible where the rock is cut by fractures penetrating deeper, more saturated formations. |
| Fore-reef and shoal facies: |
| These are the best reservoirs, with large volumes of apparently unaltered rock with high porosity and rich in oil; where selective recrystallization has taken place, porosity varies from vugular to intergranular, with wide ranging differences in size and permeability. |
| Globigerinal limestones: |
| These are thinly bedded basinal facies with much less porosity; good production only exists along open, closely spaced bedding planes. |
| Globigerinal limestones with coarse grade fossils: |
| These may have frequent heavy oil saturation due to selective recrystallization and/or the presence of fore-reef talus. Most of the oil in the Kirkuk and Bai Hassan fields is contained in fabric selective porosity; non-fabric selective porosity or macrovoids comprising fissures, large vugs, fractures and caverns account for only minor amounts [2]. Permeability and production, however, are almost entirely along these channels, a fact which was indicated quite early in the history of the field, both by large losses of drilling fluids, poor core recovery (less than 30%), and the early discovery through production testing of very free communication throughout the entire reservoir. Relatively little, however, is known about the history and nature of these macro-voids [3]. |
| Methodology |
| Matrix models for porosity and lithology calculation: |
| The petrophysical interpretation process was a model driven process, which employed a matrix solution technique. A simple, threecomponent setup is illustrated in (Table 1). |
| This matrix is set up to solve for calcite (VLMST), dolomite (VDOLO), and water (PHIT) and is an over determined case. There are response equations for the density (RHOB) measurement, the sonic (DT) measurement, the neutron (NPHI) measurement, and the gamma ray (GR) measurement. Once the system of equations is set up with the matrix values for the selected mineral assemblages and the corresponding well log measurements, the matrix is inverted to solve for the component volumes. These three components could be solved with as few as two well log measurement inputs since the unity equation, the last line in the table, which requires all volumes to sum to 1, is always part of the system of equations. Systems of equations for any assemblage of minerals, such as the three component system above, can be set up from a table of mineral values. There is no single, consistent set of matrix responses published. |
| (Figure 1) (Table 1) |
| The values shown in Table 2 were taken from the MULTIMIN module in the GEOLOG system. Some comments about this table, this is a starting point; Shales typically contain multiple clay mixtures. In order to keep the clay response component to a single entry, mixtures were constructed by volume weighting the clay constituents. For example, a 50:50 mixture of illite and kaolinite would have the matrix responses: density 2.70, neutron 0.35, sonic 85, and gamma ray 132. The gamma ray responses especially are just starting values. Radioactive dolomites are common, and in the rock column worked with here, the Jeribe interval always displayed an elevated radioactivity response. Ad hoc adjustments were made based on the observed well log responses. |
| This technique assumes that the linear, volume weighting of components in the response equations is a valid model. The density response equation is truly a linear, volume- weighted model and the modern neutron tools have near linear responses. A linear model is not as accurate for the sonic and gamma ray responses. Additionally, real rocks often contain more minerals than can be solved for with a limited number of well log measurements. Therefore, these models must be set up to capture the most abundant mineral volumes. Fortunately, due to the large contrast between fluid and mineral properties, this technique is a robust estimator of porosity even when the mineral model is deficient. Additionally, the implementation of this technique has constraints such that only positive values for volumes are allowed as solutions in order to keep the results physically valid (Table 2). |
| Negative volumes are valid mathematically, but not physically. Within these constraints, the solution is reached by minimizing an error function. This matrix technique is commonly applied in mixed, carbonate–evaporate sequences and goes by different names in different software packages. |
| Dry clay volume and clay porosity estimation |
| A key point to emphasize here is that these model setups are for matrix volumes or dry mineral volumes, the solid mineral grain volume only. All liquids are shown in the fluid volume named PHIT. If clay such as illite or kaolinite is one of the components, any water distributed within the clay fraction as interparticle microporosity or intercalated within the clay layers will appear in the fluid fraction, PHIT. Therefore, estimating an “effective” porosity requires knowledge of porosity within the clay fraction so that the water volume can be partitioned between that held by the clay particles and that water in the antiparticle or intercrystalline porosity of the carbonate fraction which is commonly referred to as effective porosity. |
| Archie saturation parameters M and Rw: |
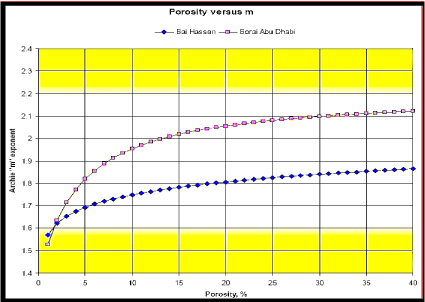
| Advanced core data analyses for Bai Hassan cores were abundant enough that a study of porosity versus the Archie cementation exponent m was conducted. The data and results are plotted in figure 4 Archie m as a function of porosity is given as |
| This study showed that for the available data set, m decreased as porosity decreased. This m trend impacted the saturation calculation by producing lower water saturation values at the lower porosity values than if a constant value of the m parameter had been used, for example a value such as 1.85 which is appropriate for porosity values in the mid-thirties. The net effect increased the hydrocarbon pore volume slightly in the low porosity range [4,5]. |
| This trend of decreasing m as porosity drops has been observed elsewhere in carbonates and was documented for carbonate reservoirs in Abu Dhabi in a 1987 paper by Borai [6]. For comparison, the Bai Hassan and Borai results are plotted together in the figure 4. |
| The equation from Borai’s work is: |
| Based on the Archie m versus porosity regression, m has a value of about 1.78 in the (10%-20%) porosity range (Figure 2). |
| Bai Hassan temperature gradient: |
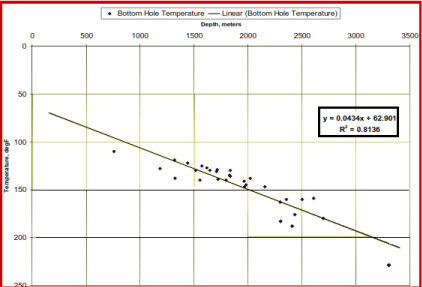
| The gradient shown in the figure 5 is adequate for resistivity interpretation. Formation water resistivity values are dependent upon formation temperature, but are not so sensitive that an error of five to ten degrees Fahrenheit is critical. This is fortunate, because the maximum-recorded temperatures listed in the well log headers were of highly variable quality. Temperatures often were not listed. In most cases, the same temperature was listed on each log run across the same depth interval. Generally temperature is expected to increase on the second and third or fourth log runs as the cooling effect of circulation diminishes. Then measurements of temperature versus time since circulation stopped form the basis of extrapolating to true formation temperature. This was not possible for this data set. |
| Clay mineralogy: |
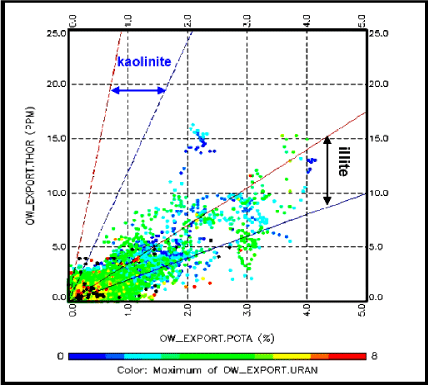
| Three conclusions are readily drawn from the above cross plot of potassium, POTA, versus thorium, THOR, content. Illite is the dominant clay type. Mixtures of illite and kaolinite do occur. The coloring of the data points by uranium content, URAN, shows that the highest levels of uranium occur near the origin of the plot. The uranium is not associated with increases in clay content (figure 3). The datasets with spectral gamma ray measurements indicate that the elevated gamma ray responses in the Jeribe Formation and in the carbonate beds inter-bedded with anhydrite above the Jeribe are caused by uranium, not clay content (Figure 3). |
| Since most wells did not have spectral gamma ray measurements, shale endpoints were adjusted as needed in the lithology models for these intervals in order to prevent the uranium contribution from skewing the clay or shale volume calculation. |
| Pore types from sonic log response: |
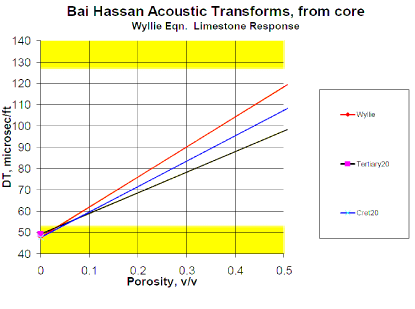
| Sonic responses in carbonates are sensitive to pore configuration or the presence of vugs. This knowledge has been used for several decades as a way to estimate a secondary porosity index, but the results have been mixed (Figure 4). |
| The response can be quantified for a specific reservoir rock type with a careful analysis of the amount of touching vugs from thin section studies. In the absence of specific knowledge about the pore system of a carbonate, only qualitative inferences can be drawn about the nature of the pore system from the observed sonic response. The basis of the inferences is a comparison of the observed responses with that predicted by the Wyllie equation as given below (Figure 5). |
| Three basic, qualitative interferences can be made from comparing the observed sonic porosity transforms with the Wyllie transform (figure 6) with the axes arranged as in the following plots, the three inferences be listed below: |
| PHIT=porosity, DT=well log sonic transit time |
| DTft = transit time for fluid (189 for fresh water) |
| (Figure 6) |
| ➢ Rocks dominated by micro porosity, such as mudstones, plot above the Wyllie line. |
| ➢ Rocks dominated by intergranular or intercrystalline porosity, such as sucrosic dolomites; plot on or near the Wyllie line. |
| ➢ Rocks dominated by vuggy porosity plot below the Wyllie line. This is especially distinct in oomoldic pore systems because spherical pores enhance the departure from the Wyllie line. |
| Conclusion |
| Application of a matrix inversion technique to solve for porosity and mineralogy worked well. Probable clay mineralogy was identified from a plot of spectral gamma ray data. The sonic response of the reservoirs indicates that secondary or vuggy porosity is significant and probably more significant in the Tertiary reservoirs than in the Cretaceous reservoirs. The Archie parameters for calculating water saturation are defined or constrained enough to produce high quality water saturation estimates. Core data permitted the Archie cementation exponent, m, to be expressed as a function of porosity. The phenomenon of the cementation exponent m decreasing as porosity decreases has been noted before in Middle Eastern carbonates. This constraint on m values in turn constrained or reduced the uncertainty of the estimate of formation water resistivity from Pickett plots. The saturation exponent, n, was not similarly defined by core data. Formation temperatures from borehole records were less than ideal, but still good enough. |
References
|
Tables and Figures at a glance
| Table 1 | Table 2 |
Figures at a glance
 |
 |
 |
| Figure 1 | Figure 2 | Figure 3 |
 |
 |
 |
| Figure 4 | Figure 5 | Figure 6 |
Relevant Topics
- Anaerobic Biodegradation
- Biodegradable Balloons
- Biodegradable Confetti
- Biodegradable Diapers
- Biodegradable Plastics
- Biodegradable Sunscreen
- Biodegradation
- Bioremediation Bacteria
- Bioremediation Oil Spills
- Bioremediation Plants
- Bioremediation Products
- Ex Situ Bioremediation
- Heavy Metal Bioremediation
- In Situ Bioremediation
- Mycoremediation
- Non Biodegradable
- Phytoremediation
- Sewage Water Treatment
- Soil Bioremediation
- Types of Upwelling
- Waste Degredation
- Xenobiotics
Recommended Journals
Article Tools
Article Usage
- Total views: 15144
- [From(publication date):
September-2015 - Apr 04, 2025] - Breakdown by view type
- HTML page views : 10476
- PDF downloads : 4668
