Carbon Stock Sequestered by Selected Tree Species Plantations in Wondo Genet College, Ethiopia
Received: 26-Apr-2018 / Accepted Date: 14-May-2018 / Published Date: 18-May-2018 DOI: 10.4172/2157-7617.1000472
Abstract
Climate change caused by global warming, is a phenomenon partly resulting from abundance of carbon dioxide in the atmosphere. Carbon sequestration through forestry plantations has a potential in ameliorating global environmental problems such as atmospheric accumulation of carbon dioxide and related climate change. The aim of this study was to estimate carbon sequestered by commonly grown plantation species across different ages. Four tree species were selected for the present study. Total 36 sample plots were selected for estimation of selected tree plantation biomass. Biomass data was collected at different age intervals (5-10 years, 11-15 years and ≥ 16 years) of tree plantation species. At each age interval of tree plantation three sample plots were selected for each species. A plot of 20 m × 20 m was established randomly in all study sites. Diameter at breast height (DBH) of each tree (≥ 10 cm) within 20 m × 20 m sample plot was measured by using caliper and height of each tree was measured by using hypsometer. The litter samples where be collected from the four corners and at the center with sub-sample of 1 m × 1 m in each sample plot. Soils were sampled in the same sub sample plots as litter. Aboveground and belowground biomass was estimated using specific species allometric equation. Aboveground carbon of Eucalyptus saligna, Cupressus lusitanica, Grevillea robusta and Pinus patula were sequestered (38.74, 39.05, 23.49 and 7.27 t/ha) respectively. Below ground carbon content of Eucalyptus saligna, Cupressus lusitanica, Grevillea robusta and Pinus patula (10.07, 10.15, 6.11 and 1.89 t/ ha) respectively. According to this study Eucalyptus saligna (0.006 t/ha), Cupressus lusitanica (0.007 t/ha), Pinus patula (0.006 t/ha) and Grevillea robusta (0.006 t/ha) were sequestered comparable litter carbon content. The study showed that Eucalyptus saligna (10.85 t/ha), Cupressus lusitanica (10.87 t/ha), Pinus patula (10.67 t/ha) and Grevillea robusta (11.36 t/ha) were storage similar soil organic carbon. According to this study the total carbon content of Grevillea robusta was 40.98, Eucalyptus saligna 59.68, Pinus patula 19.83 and Cupressus lusitanica 60.08 t/ha. Eucalyptus saligna and Cupressus lusitanica were sequestered high carbon, followed by Grevillea robusta and Pinus patula respectively.
Keywords: Soil organic carbon; Aboveground carbon; Belowground carbon; Litter carbon; Allometric equation
Introduction
Background
Forest vegetation and soils constitute a major terrestrial carbon pool with the potential to absorb and store carbon dioxide (CO2) from the atmosphere. The CO2 source and sink dynamics as trees grow, die, and decay are subjected to disturbance and forest management. Evidence of climate change linked to human-induced increase in greenhouse gas (GHG) concentrations is well-documented in international studies [1,2]. To contribute to reduction of GHG emissions, and to partly offset deforestation, the Kyoto protocol (KP) explicitly considered reforestation and afforestation activities for carbon sequestration accounting [2]. The recognized importance of forests in mitigating climate change has led countries to study their forest carbon budgets and initiate the assessment of enhancing and maintaining carbon sequestration of their forests resource.
Biomass production in different forms plays important role in carbon sequestration in trees. These carbon pools are composed of live and dead above and below ground biomass, and wood products with long and short life and potential uses. Above-ground biomass, belowground biomass, dead wood, litter, and soil organic matter are the major carbon pools in any ecosystem [3-5].
Estimates of carbon stock in forest plantations are generally based on allometric equations relating either carbon or biomass to diameter at breast height (DBH). Several authors have reviewed the use of allometric functions for biomass estimation. These equations are usually based on measurement of the fresh mass of each tree with subsamples taken to determine moisture content to convert to dry weight.
The aim of this study is to predict aboveground biomass and carbon potential of Eucalyptus saligna, Cupressus lusitanica, Grevillea robusta and Pinus patula plantations using different allometiric equation methods.
Statement of the problem
Climate change, caused by global warming, is a phenomenon partly resulting from abundance of carbon dioxide in the atmosphere. It is the most pressing environmental problem of the world today. It persists, and it cannot be stopped. Rather, it can be mitigated. Plantation systems as land use can reduce the atmospheric concentration of carbon dioxide. Carbon sequestration through forestry plantations has a huge potential in ameliorating global environmental problems such as atmospheric accumulation of carbon dioxide and related climate change. In Ethiopia Eucalyptus saligna, Cupressus lusitanica, Grevillea robusta and Pinus patula are among common exotic plantation species. They grow fast, a characteristic that makes them remove more CO2 from the atmosphere than they would release. Little researches have been done in estimating carbon aboveground and belowground of plantation species in Ethiopia. This study therefore aimed to generate data on the carbon stocks of four selected tree species plantations located within the Wondo Genet College.
Significance of the study
Study on carbon sequestration potential of Eucalyptus saligna, Cupressus lusitanica, Grevillea robusta and Pinus patula plantation is important because it provides basic information on the potential effect of plantations and reforestations on the environment particularly land resources. Estimation of total plant biomass and soil carbon sequestered in any forest system is important as it gives ecological and economic benefits to the local people and environment. It was also enable growers, policy makers and development practitioners to have better knowledge as to where and how to focus in Eucalyptus saligna, Cupressus lusitanica, Grevillea robusta and Pinus patula plantation to bring a better environmental and economic achievements. Generally, the significance of this study is to know the carbon sequestration potential of above four selected plantation species.
Objectives
General objective: This study is conducted to estimate carbon sequestered by commonly grown plantation species across different ages and sites in Wondo Genet College.
Specific objectives
1) To estimate above and below ground carbon stock of selected tree species plantations.
2) To analysis soil organic carbon stock of land under selected tree species plantations.
3) To estimate carbon stock of litter, fall under selected tree species plantations.
Materials and Methods
Study area description
The study was conducted in Wondo Genet College of Forestry and Natural Resources, which is located in north eastern direction from the town of Hawassa and about 263 km south of Addis Ababa. It lies between 38037’ and 38042’ East longitude and 7002 and 7007’ north latitude. Landscape of the study area varies with an altitude ranging between 1600 and 2580 meters above sea level.
The study area is categorized under Dega (cold) agro-ecological zone at the upper part and Woina Dega (temperate) agro-ecological zone at the lower part of the area. The rainfall distribution of the study area is bi-modal, where short rain falls during spring and the major rain comes in summer and stays for the first two months of the autumn season. The annual temperature and rainfall range from 17°C to 19°C and from 700 mm to 1400 mm, respectively [6-10]. In general, the climatic condition of the area is suitable for production of both common food and cash crops. The area has fertile soil and the loam sand texture soils contain most important nutrients (Figure 1).
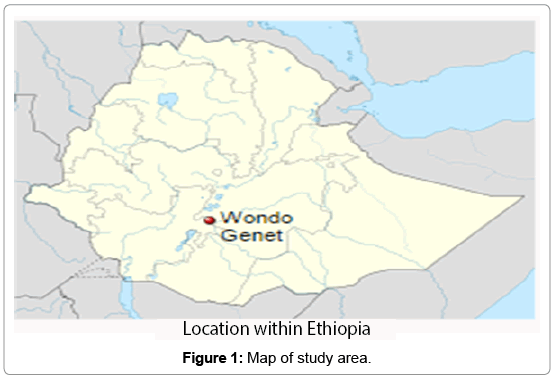
Figure 1: Map of study area.
Methods of data collection
Sites selection: Eucalyptus saligna, Cupressus lusitanica, Grevillea robusta and Pinus patula are the most used tree species for afforestation in Wondo Genet College. Those four-tree species were selected for the present study. At each study site, plots were laid out within the plantation forest. Requirements for site selection were included: (i) planting size ≥ 1 ha and at least 20 m wide; (ii) planting age ≥ 5 years; (iii) planting location avoiding drainage lines and riparian areas; (iv) good survival.
Sample size: Given the limitations of the sampling theory, the number of sample plot for biomass estimation (in other terms, the sample size) is generally selected empirically, based on rules established by experience. A general principle is that, for any given precision, the more variable the material, the larger the sample size: smaller sample sizes are required for a plantation. Thirty (30) number of sample plot for Single, homogeneous plantation site was recommended by Picard et al. Based on this experience a total of 36 sample plots were taken for estimation of selected tree plantation biomass.
Vegetation survey: Biomass data was collected at different age intervals (5-10 years, 11-15 years and ≥ 16 years) of tree plantation species. At each age interval of tree plantation three (3) sample plots were selected for each species. A plot of 20 m × 20 m was established randomly in all study sites. Diameter at breast height (Dbh) of each tree (≥ 10 cm) within 20 m × 20 m sample plot was measured by using caliper and height of each tree was measured by using hypsometer. Trees with multiple stems at 1.3 m height was treated as a single individual and DBH of the largest stem was measured. A canker, gall or branched trees at 1.3 m was measured the smallest point below it where the stem assumes near cylindrical shape. Trees with multiple stems or fork below 1.3 m height were treated as a single individual stem [11]. To estimate the above ground biomass of all trees within selected site having DBH > 10 cm was recorded. These inventory data were used to calculate stocking (stems ha-1), basal area (m2 ha-1), and for scaling of biomass.
Litter sampling: The litter samples were collected from the four corners and at the center with sub-sample of 1 m × 1 m in each sample plot. All litter samples in the sub-sample were collected manually. Each sample was measured for wet weight and 100 g sub-sample was taken from each sample for laboratory analysis. The litter samples wre oven dried at 70°C for 48 h. Samples were cooled for 1 h and weighed to provide a bulk estimate of litter mass for each site.
Soil sampling: Soils were sampled in the same sub sample plots as litter. After the litter is removed, a 30 cm soil pit is dug and two subsamples at a depth of 15 cm interval were collected in a vertical slice of the pit wall with a knife. Soil samples were taken at 30 cm depth from the four corners and at the center of each plot. The soil sample was mixed homogeneously, and 100 g sub-sample was taken from each sample for laboratory analysis. Each and every sample was labeled carefully. The soil samples were used for organic carbon determination in the laboratory (Figure 2).
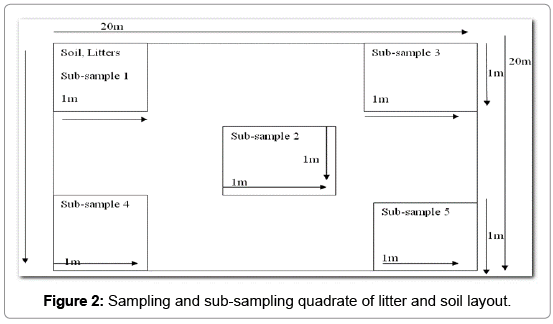
Figure 2: Sampling and sub-sampling quadrate of litter and soil layout.
Aboveground biomass estimation: Above-ground biomass comprises all woody stems, branches, and leaves of living trees, creepers, climbers, and epiphytes as well as understory plants and herbaceous growth. For agricultural lands, this includes trees (if any), crops and weeds. In this study, the total carbon stock sequestration of tree species were determined by nondestructive methods which include, field survey, laboratory analysis and allometric equations. Species specific allometric equations were applied to mean d.b.h of each tree species to calculate the biomass accumulation in different tree components.
Total aboveground biomass of trees was estimated using a regression equation developed by Henry et al. [7] for sub-Saharan African forests: These equations are as follows:
Eucalyptus saligna, in Kakamega forest in Kenya in 2002.
i. y= ((0.08283×(X^1.873)) × (W^0.8242)) ×10^ (–3) (1)
Cupressus lusitanica in Usambaras in Tanzania.
ii. y= 0.0355 + 0.00003X^2×W (2)
Grevillia robusta in Ruhande in Rwanda
iii. y= (–11.93+3.0386×X+0.2063×(X^2)) ×10^ (–3) (3)
Pinus patula in Kakamega forest in Kenya in 2002.
iv. y= –0.00041–0.00005711×X+0.0001352×(X×W) +0.00003313× (X×W) (4)
Where Y represents the total dry aboveground biomass of a tree in kg, X is the diameter of the tree in cm and W is the height of tree in m. The corresponding carbon content in biomass will be estimated assuming 50% of carbon in the biomass as per IPCC in 2003.
Belowground biomass estimation: The Below Ground Biomass (BGB) includes all biomass includes all biomass of live roots excluding fine roots having <2 mm diameter [8]. Biomass estimation equations for tree roots are relatively uncommon in the literature. The belowground biomass (BGB) was calculated by multiplying above-ground biomass taking 0.26 as the root to shoot ratio [9,10].
Belowground biomass (tha-1) = 0.26 × above-ground biomass (tha-1) (5)
Finally, carbon content in the biomass was estimated by multiplying of 0.5 while multiplication factor 3, was used to estimate CO2 equivalent as per IPCC in 2003.
Litter biomass estimation: The forest floor, or litter layer, is defined as all dead organic surface material on top of the mineral soil. Some of this material will be still recognizable (for example, dead leaves, twigs, dead grasses and small branches) and some will be unidentifiable decomposed fragments of organic material.
Samples litter of all the species were collected for determination of carbon content percentage in the laboratory using loss-on-ignition (LOI) method in a muffle furnace. LOI method involves combusting samples at high temperature and measuring the weight loss, which is an inexpensive, convenient and accurate method to estimate organic carbon. In the laboratory, after taking the fresh weight, the litter samples were dried in the oven for 1 hour at 105°C to get dried weights. Oven dried grind samples were taken (5.00 g) in pre-weighted crucibles. The crucibles were placed in the furnace at 550°C for 4 hours. Crucibles were cooled slowly inside the furnace. After cooling, the crucibles with ash were weighted for calculation of percentage of organic carbon.
The biomass of litter was estimated by using the following equation:
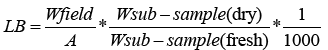 (6)
(6)
Where: LB = Litter (biomass of litter t ha-1)
Wfield = Weight of wet field sample of litter sampled within an area of size 1 m2 (g);
A = Size of the area in which litter will be collected (ha);
W is the sub-sample, (dry) = Weight of the oven-dry sub-sample of litter taken to the laboratory to determine moisture content (g), and
W is the sub-sample, (fresh) = Weight of the fresh sub-sample of litter taken to the laboratory to determine moisture content (g) [11].
Soil carbon estimation: Collected soil samples were analyzed in soil laboratory and soil organic C percent was calculated. The Walkey- Black method was applied for measuring the soil organic carbon [12]. Total soil organic carbon was calculated using the formula given below [13].
SOC=Organic carbon content % × soil bulk density (kg/m3) × soil depth (m) (7)
Bulk density: Soil bulk density was determined using core sampling method [14]. Oven dry weight of soil samples were determined for moisture correction. The dried soil then was passed through a 2 mm sieve, the sieved soil was weighed, and volume of stones was recorded for stone correction. The following formula was used to calculate the bulk density using stone correction [12].
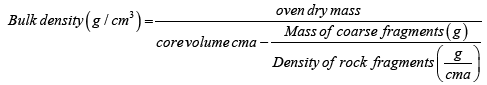 (8)
(8)
Estimation of total carbon stock of the area:The carbon stock density is calculated by summing the carbon stock densities of the individual carbon pools of the stratum using the McLean [12] formula. In addition, it is recommended that any individual carbon pool of the given formula can be ignored if it does not contribute significantly to the total carbon stock [15]. Carbon stock density of a study area:
C density=CAGB + CBGB + C Lit +SOC (9)
Where: C density = Carbon stock density for all pools [ton ha-1] C AGTB = Carbon in above -ground tree biomass [t C ha-1] CBGB = Carbon in below-ground biomass [t C ha-1] C Lit = Carbon in dead litter [t C ha-1] SOC = Soil Organic Carbon
Data analysis
After the data collection was completed, data analysis of various carbon pools measured in the closed public parks were accomplished by organizing and recording into the excel sheet and different comparison graphs and tables. In order to apply models for biomass estimation, the data obtained from DBH and Height of each species were used, weight of litter and soil were analyzed using Statistical Package for Social Science (SPSS) software version 16.
Results
Aboveground biomass and carbon content
According to this study there were significance difference of aboveground carbon content different species (at p=0.000) as indicated (Table 1). Eucalyptus saligna and Cupressus lusitanica were sequestered higher aboveground carbon (38.74 and 39.05 t/ha) respectively. Aboveground carbon content of Pinus patula (7.27 t/ha) was less than Grevillea robusta (23.49 t/ha).
| Species | Mean | Std. Error |
95% Confidence Interval | |
|---|---|---|---|---|
| Lower Bound | Upper Bound | |||
| Grevillearobusta | 23.493b | .352 | 22.767 | 24.220 |
| Eucalyptus saligna | 38.741c | .352 | 38.015 | 39.468 |
| Pinuspatula | 7.267a | .352 | 6.540 | 7.993 |
| Cupressuslusitanica | 39.049c | .352 | 38.322 | 39.775 |
| Means followed by the different letter in a column are significantly different | ||||
Table 1: Aboveground carbon content of different species in t/ha.
Aboveground carbon content of species at different age groups were highly significant at (p=0.000). According to this result Eucalyptus saligna and Cupressus lusitanica were store more above ground carbon at the age of (>16, 43.09 tc/ha) than (11-15, 25.64 tc/ha) and 5-10 (12.69 tc/ha) age groups respectively (Table 2). The large age groups were sequestered higher aboveground carbon than small age groups.
| Age | Mean | Std. Error | 95% Confidence Interval | |
|---|---|---|---|---|
| Lower Bound | Upper Bound | |||
| 5-10 | 12.687a | .305 | 12.058 | 13.316 |
| 11-15 | 25.639b | .305 | 25.010 | 26.268 |
| >16 | 43.087c | .305 | 42.458 | 43.716 |
| Means followed by the different letter in a column are significantly different | ||||
Table 2: Aboveground carbon content of species at different age groups in t/ha.
Belowground carbon content of species
According to this study there were significance difference of belowground carbon content of different species (at p=0.000) as indicated (Table 3). Eucalyptus saligna and Cupressus lusitanica were sequestered higher and comparable belowground carbon (10.07 and 10.15 t/ha) respectively. Belowground carbon content of Pinus patula (1.89 t/ha) was less than Grevillea robusta (6.11 t/ha).
| Species | Mean | Std. Error |
95% Confidence Interval |
|
|---|---|---|---|---|
| Lower Bound | Upper Bound | |||
| Grevillearobusta | 6.108 | .092 | 5.919 | 6.297 |
| Eucalyptus saligna | 10.073 | .092 | 9.884 | 10.262 |
| Pinuspatula | 1.889 | .092 | 1.700 | 2.078 |
| Cupressuslusitanica | 10.15 | .092 | 9.962 | 10.341 |
Table 3: Belowground carbon content of different species in tc/ha.
Belowground carbon content of species at different age groups were highly significant at (p=0.000). According to this result Eucalyptus saligna and Cupressus lusitanica were store more belowground carbon at the age of (>16, 43.09 tc/ha) than (11-15, 25.64 tc/ha) and 5-10 (12.69 tc/ha) age groups respectively (Figure 3). The large age groups were sequestered higher belowground carbon than small age groups.
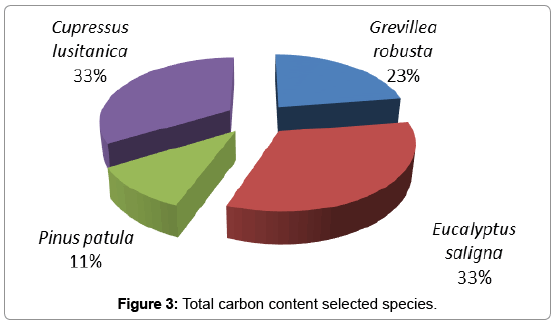
Figure 3: Total carbon content selected species.
Litter carbon content of selected species
Litter carbon content of selected species were no significant difference at (p=0.112). According to this study Eucalyptus saligna (0.006 t/ha), Cupressus lusitanica (0.007 t/ha), Pinus patula (0.006 t/ha) and Grevillea robusta (0.006 t/ha) were sequestered comparable litter carbon content (Table 4).
| Species | Mean | Std. Error | 95% Confidence Interval | |
|---|---|---|---|---|
| Lower Bound | Upper Bound | |||
| Grevillearobusta | 006a | 000 | 006 | 007 |
| Eucalyptus saligna | 006a | 000 | 005 | 007 |
| Pinuspatula | 006a | 000 | 005 | 007 |
| Cupressuslusitanica | 007a | 000 | 006 | 008 |
| Means followed by the same letter in a column are not significantly different | ||||
Table 4: Litter carbon content different species in t/ha.
Litter carbon content of species at different age groups were no significance difference at (p=0.106). All selected tree species at different age (5-10 years, 11-15 years and >16 years) were stock similar litter carbon.
Soil organic carbon
Soil organic carbon of selected species were no significant difference at (p=0.902). The study shows that Eucalyptus saligna (10.859 ± 0.69 t/ ha), Cupressus lusitanica (10.872 ± 0.69 t/ha), Pinus patula (10.670 ± 0.69 t/ha) and Grevillea robusta (11.369 ± 0.69 t/ha) were sequestered comparable soil organic carbon (Table 5). Soil organic carbon of species at different age groups were no significance difference at (p=0.211). All selected tree species at different age 5-10 (10.698 ± 0.60), 11-15 (11.801 ± 0.60) and >16 (10.329 ± 0.60 tc/ha) were sequestered comparable Soil organic carbon.
| Species | Mean | Std. Error | 95% Confidence Interval | |
|---|---|---|---|---|
| Lower Bound | Upper Bound | |||
| Grevillearobusta | 11.369a | .686 | 9.952 | 12.786 |
| Eucalyptus saligna | 10.859a | .686 | 9.442 | 12.276 |
| Pinuspatula | 10.670a | .686 | 9.253 | 12.087 |
| Cupressuslusitanica | 10.872a | .686 | 9.455 | 12.289 |
| Means followed by the same letter in a column are not significantly different | ||||
Table 5: Soil organic carbon of different species in t/ha.
Total carbon content of different species
The total carbon content of species was obtained by summing of aboveground carbon, belowground carbon, litter carbon and soil organic carbon. According to this study the total carbon content of Grevillea robusta was 40.98, Eucalyptus saligna 59.68, Pinus patula 19.83 and Cupressus lusitanica 60.08 t/ha. Eucalyptus saligna and Cupressus lusitanica were sequestered high carbon, followed by Grevillea robusta and Pinus patula respectively (Figure 3).
Discussion
Biomass carbon storage
Estimating carbon storage species at different age is essential for assessing the role of forest ecosystems in regional and global carbon management. These results indicate that Eucalyptus saligna and Cupressus lusitanica were accumulated large amounts of biomass Carbon, both above and below ground followed by Grevillea robusta and Pinus patula respectively. In this study, biomass Carbon storage of species plantations at three stand ages were between 12.7 and 43.1- ton ha−1. Tree biomass constituted a major part of the biomass Carbon pool and increased rapidly with plantation age in both the above- and belowground (root) fractions, similar to trends observed in other forests [16-18].
The highest rate of accumulation was observed in above sixteen years-old stands of Eucalyptus saligna, Cupressus lusitanica, Pinus patula and Grevillea robusta and the average carbon storage 43.087 t/ ha) were slightly lower than that reported for above selected species 55 t/ha [19].
Soil organic carbon
The soil carbon pool is affected by soil properties, forest management practices, litter input, and root turnover (20). The study showed that Eucalyptus saligna (10.859 ± 0.69 t/ha), Cupressus lusitanica (10.872 ± 0.69 t/ha), Pinus patula (10.670 ± 0.69 t/ha) and Grevillea robusta (11.369 ± 0.69 t/ha) were storage similar soil organic carbon. Soil organic carbon storage of Eucalyptus saligna was found in this study slightly lower than research (14 t/ha) reported by Jandl et al. [20]. Similar study also found for soil organic carbon of Cupressus lusitanica and Pinus patula (14.3 and 11.45 t/ha) conducted by Hu et al. [21]. Soil organic carbon storage observed here with 0-30 cm soil depth was lower than the average value for carbon storage in forest soils in China (84.92 t/ha) [22]. Another explanation is the loss of original soil organic carbon as a result of disturbance of plantation for harvesting and other purposes. Among the three-plantation species age, soil Carbon storage was not different with increasing species age.
Conclusion
These results indicate that Eucalyptus saligna (38.74 t/ha) and Cupressus lusitanica (39.05 t/ha) were accumulated large amounts of biomass Carbon, both above and below ground followed by Grevillea robusta (23.49 t/ha) and Pinus patula (7.267 t/ha). All selected tree species at different age (5-10, 11-15 and >16 years) stored similar amount of litter carbon. The study showed that Eucalyptus saligna (10.85 t/ha), Cupressus lusitanica (10.87 t/ha), Pinus patula (10.67 t/ha) and Grevillea robusta (11.36 t/ha) were stored similar soil organic carbon. According to this study the total carbon content of Grevillea robusta was 40.98 t/ha, Eucalyptus saligna 59.68 t/ha, Pinus patula 19.83 t/ha and Cupressus lusitanica 60.08 t/ha. Eucalyptus saligna and Cupressus lusitanica were sequestered high carbon, followed by Grevillea robusta and Pinus patula.
References
- IPCC (2001) Climate change 2001: The scientific basis, IPCC third assessment report, Working group I, Technical Summary. Cambridge University Press, UK.
- IPCC (2007) Climate Change: The Scientific Basis: IPCC fourth assessment report. Working Group I
- FAO (2005) Support to national forest assessments. FAO Forestry Department
- IPCC (2003) Good practice guidance or land use land-use change and forestry.Institute for Global Environmental Strategies
- IPCC (2006) Guidelines for national greenhouse gas inventories. Agriculture, Forestry and other land use. Institute for Global Environmental strategies 2: 4
- Picard N, Saint-Andre L, Henry M (2012) Manual for building tree volume and biomass allometric equations: from ï¬eld measurement to prediction. Food and Agricultural Organization of the United Nations, Rome, and Centre de CoopérationInternationale en RechercheAgronomique pour le Développement, Montpellier 215
- Henry M, Picard N, Trotta C, Manlay RJ, Valentini R, et al. (2011) Estimating tree biomass of sub-Saharan African forests: a review of available allometric equations. Silva Fennica 45: 477-569.
- Chavan BL, Rasal GB (2011) Potentiality of carbon sequestration in six years ages young plant from University campus of Aurangabad. Global Journal of Researches in Engineering 11: 15-20
- Cairns MA, Brown S, Helmer EH, Baumgardner GA (1997) Root biomass allocation in the world's upland forests. Oecologia 111: 1-11
- Ravindranath NH, Ostwald M (2008) Carbon Inventory Methods: Handbook for Greenhouse Gas Inventory, Carbon Mitigation and Round wood Production Projects
- Pearson T, Brown H, Ravindranath S (2005) Integrating carbon benefit estimates intoGEF projects. Capacity Development and Adaptation Group Guidelines. United Nations Development Programme Global Environment Facility, Global Environment Facility, Bureau of Development Policy
- McLean EO (1982) Soil pH and lime requirement. In: Miller AL, Keeney RD (Eds) Methods of soil analysis. Part 2 - Chemical and microbiological properties. Agronomy 9: 199-223
- Awasthi K, Singh B, Sitaula B (2005) Profile carbon and nutrient levels and management effect on soil quality indicators in the Mardi Watershed of Nepal. Acta agriculture Scandinavia Section B-Soil and Plant 55: 192-204
- Lasco R, Pulhin F, Cruz R, Pulhin J, Roy S (2005) Carbon budgets of terrestrial ecosystems in the PantabanganCarranglan Watershed. Assessments of Impacts and Adaptations to Climate Change (AIACC) Working Paper
- Bishma PS, Shiva SP, Ajay P, Eak R, Sanjeeb B, et al. (2010) Forest carbon stock measurement: Guidelines for measuring carbon stock in community managed forest. Funded by Norwegian Agency for Development
- Chen GS, Yang ZJ, Gao R, XieJS, GuoJF, et al. (2013) Carbon storage in a chronosequence of Chinese fir plantations in southern China.EcolManag300: 68-76.
- Wang FM, Xu X, Zou B, GuoZH, Li ZA, et al. (2013) Biomass accumulation and carbon sequestration in four different aged Casuarinaequisetifoliacoastal shelterbelt plantations in south China. PLoS ONE8: 77-88
- Cao JX, Wang XP, Tian Y, Wen ZY, ZhaTS (2012) Pattern of carbon allocation across three different stages of stand development of a Chinese pine (Pinustabulaeformis) forest. Ecol Res27: 883-892
- James S (2011) Nitrogen fertilization and tree species effect on the soil microbial communities and consequences for soil carbon. University of Canterbury, University in Christchurch, New Zealand.
- Jandl R, Lindner M, Vesterdal L, Bauwens B, Baritz R, et al. (2007) How strongly can forest management influence soil carbon sequestration? Geoderma137: 253-268
- Hu D, Fuping Z, Wanxia P, Kelin W, Hao Z, et al. (2015) Carbon storage in a Eucalyptus plantation chronosequence in Southern China.Forests 6: 1763-1778.
- Zhou YR, Yu ZL, Zhao SD (2000) Carbon storage and budget of major Chinese forest types. ActaPhytoecol Sin 24: 518-522
Citation: Yirdaw M (2018) Carbon Stock Sequestered by Selected Tree Species Plantations in Wondo Genet College, Ethiopia. J Earth Sci Clim Change 9: 472. DOI: 10.4172/2157-7617.1000472
Copyright: © 2018 Yirdaw M, et al. This is an open-access article distributed under the terms of the Creative Commons Attribution License, which permits unrestricted use, distribution, and reproduction in any medium, provided the original author and source are credited.
Select your language of interest to view the total content in your interested language
Share This Article
Recommended Journals
Open Access Journals
Article Tools
Article Usage
- Total views: 6867
- [From(publication date): 0-2018 - Dec 05, 2025]
- Breakdown by view type
- HTML page views: 5658
- PDF downloads: 1209