Research Article Open Access
Carbon Stock Analysis along Forest Disturbance Gradient in Gedo Forest: Implications of Managing Forest for Climate Change Mitigation
Hamere Yohannes1*, Teshome Soromessa2 and Mekuria Argaw2
1Department of Natural Resource Management, College of Agriculture and Natural Resource Science, Debre Berhan University, Post Box No: 445, Debre Berhan, Ethiopia
2Center for Environmental Science, College of Natural Science, Addis Ababa University, Post Box No: 1176, Addis Ababa, Ethiopia
- *Corresponding Author:
- Hamere Yohannes
Department of Natural Resource Management
College of Agriculture and Natural Resource Science
Debre Berhan University, Post Box No: 445
Debre Berhan, Ethiopia
Tel: +251116815440
E-mail: hamerey@gmail.com
Received Date: August 31, 2015 Accepted Date: September 14, 2015 Published Date: September 20, 2015
Citation: Yohannes H, Soromessa T, Argaw M (2015) Carbon Stock Analysis along Forest Disturbance Gradient in Gedo Forest: Implications of Managing Forest for Climate Change Mitigation. J Ecosys Ecograph 5:170. doi:10.4172/2157-7625.1000170
Copyright: © 2015 Yohannes H, et al. This is an open-access article distributed under the terms of the Creative Commons Attribution License, which permits unrestricted use, distribution, and reproduction in any medium, provided the original author and source are credited.
Visit for more related articles at Journal of Ecosystem & Ecography
Abstract
Forests are known to play an important role in regulating the global climate. Ethiopia has a substantial forest resource; however, these forests are facing a rapid rate of deforestation and degradation. This in turn adversely affects forest carbon stock under studied in Ethiopia. This study explores the variation of carbon stock due to a forest disturbance gradient in Gedo forest. Data were collected from 200 m2 plot along transect in a systematically stratified forest part. Spatial distribution of the carbon stock varied within forest disturbance gradient. More aboveground biomass (356.11 ± 37.83 ton/ha), belowground biomass (71.22 ± 7.56 ton/ha) and total carbon (615.16 ± 47.58 ton/ha) were found in the least disturbed stand and the lower total carbon (410.32 ± 52.22 ton/ha) was found in the highly disturbed stand. Dead wood biomass carbon pool was found in least and semi-disturbed stand. Forest disturbance had a significant effect on aboveground biomass, belowground biomass carbon, total carbon density and dead wood biomass carbon. Forest disturbance had an inverse moderate significant correlation with the first three pools and an inverse weak correlation with the later pool. Carbon sequestration in a forest ecosystem was determined by level of human-induced disturbances.
Keywords
Biomass carbon; Climate regulation; Forest disturbance; Gedo forest; Soil organic carbon
Introduction
Global climate change is an important environmental matter facing humankind today and threatening natural ecosystems, food production, water resource, and of course future of the world. 60% of the global warming is attributable to the increase in atmospheric carbon dioxide concentration from 280 ppm in the pre-industrial periods to today’s 360 ppm [1]. Human activity has significantly change the global carbon cycle as land use change and fossil fuel burning has increased the level of global GHG, most importantly, CO2 in the atmosphere. Approximately two billion people around the world cook with biomass on a regular basis [2]. Different human induced land use land cover change can result in ecosystem composition change [3].
The vegetation of tropical forest is a large and globally significant storage of carbon because tropical forest contains more carbon per unit area than any other land cover. The main carbon pools in tropical forest ecosystems are the living biomass of trees and understory vegetation and the dead mass of litter, woody debris and soil organic matter [4].
Tropical deforestation and forest degradation account for an estimated 20% of the world's anthropogenic emissions of carbon dioxide. Disturbances in forest ecosystems affect resource levels, such as soil organic matter, water and nutrient availability, and interception of solar radiation [5]. Deforestation and forest degradation happen after the disturbance appears. The consequences of forest loss are double. Firstly, forest loss releases the carbon stored in trees and contributes to higher levels of CO2 in the atmosphere. Secondly, it reduces the remaining amount of forests that can absorb carbon from the atmosphere in future. According to Eliasch, and Evrendilek and Gulbeyaz [6,7], the removal of a forest carbon sink has long-term implications for the atmospheric CO2 concentration presence.
The forests resources of Ethiopia store 2.76 billion tons of carbon in the aboveground biomass, which will be released to the atmosphere in 50 years if the deforestation continues at the present rate of about 2%. In Ethiopia deforestation and forest degradation could play a major role in promoting forest fragmentation [8]. Thus, sustainable forest management strategies are crucial to maintain carbon flux in the forest ecosystem [9].
According to Beyene et al. [10], in developing countries including Ethiopia, most of the rural population depends on a variety of forest resources such as timber, fuel wood, charcoal burning, extraction of building materials in particular poles, hunting for small animals, collection of wild fruits, vegetables and medicines, etc. these have their own pressure on forest resources, consequently, the forest resource become decline through time. The trees and forests of Ethiopia are under tremendous pressure because of the radical decline in mature forest cover and the continual pressures of population increase, Inappropriate farming techniques, land use competition, land tenure, and forest modification or change and conversion.
Forest carbon inventories, together with field information on land use practices and intervention histories, have been a key to understanding the impacts of disturbances have on forest carbon stocks [11]. In Ethiopia there is no study on the effect of forest cover change or disturbance factors on carbon stock. Therefore, this study was done to assess and correlate cover change condition and carbon stock. And this provides basic information for the management of the forest. According to Kebede et al. [12], In Gedo forest there is severe human intervention problem and it was intact but now it is seriously reduced.
Materials and Methods
Description of study area
The study area is located in West Shewa Zone of Oromia National Regional State in Cheliya district. It geographically lies approximately between latitudes 90 01’ and 90 09’ North and longitudes 37015’ and 37027’ East (Figure 1). The study area altitude can reach as pick as 3060 m a.s.l [13]. It is one of the 58 national forest priority areas of Ethiopia and it covers the total area of about 10,000 hectare [14].

Figure 1: Map of the study area.
Gedo forest classified under Dry Evergreen Montane Forest which characterized by relatively high humidity, but not much rain, and where there is a prolonged dry season. Crop production and livestock rearing are the main activities of the people of the District. Livestock population of the area is significant. There are problems like shortage of farm land, grazing and browsing land. These all problems directly or indirectly affect the biodiversity in the District mainly forests. Due to high rainfall intensity during rainy season there is high land degradation and soil erosion, which leads to loss of soil fertility and damage to agricultural land [12]. According to Oromia Forest and Wildlife Enterprise Office (OFWE), during demarcation there were over Nine hundred households inside the forest and still there are more households.
Methodology
Delineation and stratification of study area
For field forest carbon stock measurement, delineation of the study boundaries is the initial step [15]. GPS tracking was used for boundary delineation of the study site. From different criteria for stratification; level of degradation (disturbance) in terms of stand density (number of productive trees per unit area) was used for this study. Thus, Study site was stratified in to three zones (disturbed, semi- disturbed and least disturbed stand) of the forest depending on the deforestation and forest degradation extent. This is because the study area has different disturbance rate. To stratify the forest, trees that have DBH ≥10 cm were selected out of total 1714 identified tree stems, 1265 stems were found in this range. And an average of 17 productive stems per plot (850 stems/ha), 21 stems per plot (1050 stems/ha) and 13 stems per plot (650 stems/ha) comprises stratum one, two and three, respectively. Based on this; stratum one assign as semi-disturbed, stratum two assign as least disturbed and stratum three as disturbed stand.
Sampling techniques for field measurement
Systematic sampling method was used to take samples. Sample plots were laid along line transects based on forest disturbance variation of the study area. A systematically assigned sampling plot of 10 m × 20 m (200 m2) in each site was established. To reveal the tree composition and biomass, all live trees with a diameter ≥5 cm within the plot were measured at 1.3 m above the ground, except where trunk irregularities at that height occur (plank woods, tapping or other wounds) and require measurement at a greater height by using diameter tape.
Measurement and Estimation of parameters for record data on vegetation
Estimation of parameters for vegetation structure
The tree structure was described in terms of tree density, diameter and height. The following formulas were used:
Basal Area (BA)
It is useful parameter for quantifying a forest stand. As individual tree basal area is related to tree volume, biomass, crown parameters, etc.
Basal area was calculated using the formula:
BA=π (DBH/2)2 or DBH2…… (eq. 1)
Where, DBH is the diameter of trees at breast height (cm).
Stem density
It is a count of the numbers of individuals of a species within the quadrat [16]. It is closely related to abundance and used as a benchmark for damage assessment.
The formula used to calculate stem density:
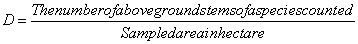 …… (eq. 2)
Frequency
It is defined as the probability or chance of finding a species in a given sample area or quadrat [16]. It helps to distinguish the most and least occurred species and also as indicators of homogeneity and heterogeneity of the vegetation. It is calculated with this formula:
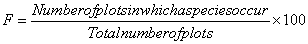 …….. (eq. 3)
Forest tree measurement for carbon stock estimation
For above ground and dead wood biomass carbon estimation mainly diameter at breast height and tree height measure was used. Below ground biomass carbon was estimated by using root-to-shoot ratio. Leaf litter biomass and soil organic carbon was measured from 1 m by 1 m sub plot. These collected samples were taken to the laboratory. Then estimation of carbon stock at each pools were done by using different allometric equation based on field measurement manuals developed by [15,17,18-21].
Data Analysis
The data analysis for estimation of carbon stock in different pool was analyzed by using Statistical Package for Social Science (SPSS) software version 20. Descriptive statistics were used to check the significant of each measured parameter(forest disturbance) and Pearson correlation was used to test the relationship between forest carbon stock with forest disturbance indicators.
Results
Forest carbon stock along forest disturbance gradient
Each forest stratum has different average DBH, basal area (BA) and number of stem per plot. Based on this carbon density at each stratum was varied. The mean DBH, BA and total mean stem density was computed as 36.16 cm, 1.6 m2/ha and 22 stems/plot for stratum one, 40 cm, 2.4 m2/ha and 27 stems/plot for stratum two and 25.36 cm, 0.83 m2/ha and 19 stems/plot for stratum three, respectively (Table 1).
| Stratum Name | Mean Stem density stems/plot | Mean DBH (cm) | Mean.BA m2/ha |
|---|---|---|---|
| Stratum one (semi-disturbed) | 22 | 36.16 | 1.6 |
| Stratum Two (least disturbed) | 27 | 40 | 2.4 |
| Stratum Three (disturbed) | 19 | 25.36 | 0.83 |
Table 1: Diameter at breast height, basal area and stem density distribution at each stratum.
Based on the descriptive analysis, there was no sign of forest disturbance in 32 plots which has frequency percentage of 42.7% and the rest 57.3% of the plot occupied by the presence of forest disturbances. The most frequently occurred forest disturbance was road and footpath which occupies 32.5% followed by logged (selectively logged) and standing dead wood with 12% and the third one was debarking and lopping with 10%, charcoal making takes the next rank with 9.2%. Animal browsing and grazing was another disturbance (4.2%). It was found that 38% of forest disturbance found in the stratum one plots, 36.8% of forest disturbance found in stratum two plots and 25.2% of forest disturbance found in stratum three plots.
For stratum one the total means of AGB and BGB carbon was computed as 279.62 ± 35.42 and 55.92 ± 7.08, respectively. Litter biomass carbon has total mean of 0.4 ± 0.11, deadwood biomass carbon mean was computed as 6.1 ± 3.497 and SOC has 183.37 ± 11.6 total mean. Total mean Carbon stock for this stand was calculated as 525.48 ± 43.95 ton/ha and CO2 equivalents mean total of 1925.51 ± 161.3 ton/ha. Stratum two total carbon mean (ton/ha) for each carbon pool computed as (AGB=356.11 ± 37.83; BGB=71.22 ± 7.56; LB=0.41 ± 0.004; DWD=1.08 ± 0.94; SOC=186.32 ± 9.31; total carbon=615.16 ± 47.58 and CO2 equivalents=2257.63 ± 174.65). Finally, stratum three total mean was computed as (AGB=194.16 ± 41.87, BGB=38.83 ± 8.37, LB=0.38 ± 0.025; SOC=177.78 ± 11.98; total carbon=410.52 ± 52.22 and CO2 equivalents mean total 1505.9 ± 191.67 ton/ha. Stratum two comprises 44% of total carbon stock. Stratum one comprises 37% of total carbon stocks and lastly, stratum three comprises 19% of total carbon stocks. Stratum two holds more mean carbon as much as 25% more than stratum three which holds least mean total carbon (Table 2).
| Stratum No | M.C. AGB | M. C. BGB | M. C.LB | M.C. DWD | M. C.OS | M. Total C. | Percentage |
|---|---|---|---|---|---|---|---|
| one | 279.62± 35.42 | 55.92± 7.08 | 0.4± 0.11 | 6.15± 3.49 | 183.3± 11.6 | 525.48± 43.95 | 37 |
| two | 356.11± 37.83 | 71.22± 7.56 | 0.41± 0.004 | 1.08± 0.94 | 186.32± 9.3 | 615.16± 47.58 | 44 |
| three | 194.16± 41.87 | 38.83± 8.37 | 0.38± 0.025 | 0 | 177.7± 11.9 | 410.32± 52.22 | 19 |
Table 2: Mean carbon stock at each pool with their total percentage for each stratum.
In present study, Forest disturbance has significant effect on aboveground biomass carbon (F=23.922; P=0.000) , belowground biomass carbon (F=23.899; P 0=0.000) , deadwood biomass carbon pool (F=6.374; P=0.014) and total carbon density (F=100.224 and P=0.000) . Forest disturbance indicators have no significant effect in Litter biomass carbon and SOC pools (Table 3).
| Parameter | Carbon pools | F-Value | P-Value |
|---|---|---|---|
| Forest Disturbance | C.AGB | 23.92 | .000 |
| C.BGB | 23.89 | .000 | |
| C.LB | 2.4 | .125 | |
| C.DWDB | 6.374 | 0.014 | |
| C.OS | .54 | .464 | |
| Total C. | 100.224 | .000 | |
| Bold value is significant at the p < 0.05 level | |||
Table 3: Summary of significant value of forest disturbance in different carbon pools.
Correlation of carbon stocks and forest disturbances
It was observed that total carbon stock shows inverse moderate correlation with forest disturbances (R=-0.523; P=0.000) at α of 0.01. AGB and BGB carbon also show inverse moderate correlation with disturbances (R=-0.517; P=0.000) at α of 0.01. Similarly, deadwood biomass carbon shows inverse weak correlation with the presence of forest disturbance indicators (R=-0.283; P=0.014) at α of 0.05. Total carbon density shows significant negative correlation with forest disturbance indicators (R=-0.283; P=0.014) at α of 0.01. On the other hand, a forest disturbance indicator does not show significant correlation with leaf litter biomass and SOC stock (Table 4).
| Parameter | Carbon pools | R- Value | P-Value |
|---|---|---|---|
| Disturbance Gradient | C.AGB | -.517* | .000 |
| C.BGB | -.517* | .000 | |
| C.LB | .179 | .125 | |
| C.DWDB | -.283* | .0014 | |
| C.OS | .086 | .464 | |
| Total C. | -.523** | .000 |
**. Correlation is significant at the 0.01 level (2-tailed)
*. Correlation is significant at the 0.05 level (2-tailed)
Table 4: Correlation of each carbon pools with forest disturbance gradient.
Discussion
Carbon stocks and forest disturbances
Forest disturbances influence carbon stored amount of forest through by altering stand structure and composition [22-24]. In present study, forest disturbance indictors show significant effect on AGB carbon, BGB carbon, DWD carbon and total carbon density. Similar result was reported by Bhatti et al. [25], which forest disturbance shows significant effect on AGB carbon, BGB carbon, LB carbon and SOC.
The spatial distribution of carbon within different stand condition was varies and forest disturbance indicators show inverse moderate correlation with AGB carbon, BGB carbon and total carbon density and inverse weak correlation with deadwood biomass carbon. This means as forest disturbance indicators increase, carbon stocks in these carbon pools decrease. This can indicate that the effect of disturbance on forest carbon stock. Just after disturbance occur the carbon amount of dead wood carbon will increase but through time this stored carbon transfer to other pools. The same suggestion was made by Bradford et al. [26]. This carbon pool was more in semi-disturbed stand and non in disturbed stand due to position of stands.
Higher total means for AGB carbon, BGB carbon, litter biomass carbon, SOC and total carbon density was obtained on least disturbed stand. This might be related with presence of more productive stem density. Similarly, Mwakisunga and Majule, and Evrendilek [27,28], reported that forest stand with larger trees accumulated more biomass, hence higher carbon stock contents. In addition, in this stand frequently occurred disturbance was debarking and lopping. Therefore, it is possible to say these disturbances might not be effective disturbance to affect total carbon density in the study area. According to Vreugdenhil et al. [29], significant carbon change was found on areas where there were land use changes. Similar suggestion can be made in present study results which lower AGB carbon, BGB carbon, LB carbon, SOC and total density was found in highly disturbed stand, where mean stem density was low. This might be due to steep slope, species diversity and vegetation root system, properties of soil, climatic condition and human disturbances and poor management, this evidence by the presence of rock falls (rolled big stone), sign of cutted and uprooted trees and charcoal making area. Road and footpath including road near to forest edge, standing, logged and downed dead wood and grazing also might be also the reason to count low amount of carbon in disturbed stand. Glenday [30] reported that the forest stand near to the road was disturbed and result in low carbon storage. The road near to the forest both at the bottom and upper site might affect carbon stock stands near to the edge. In the upper site, the road creates suitable condition to form charcoal making area because of very weak management at up land. The lower road exposes the forest for agricultural expansion, extensive fuel wood collection and built-up expansion, where most of semi-disturbed stand plot was found and evidenced by gaps after clear cutting and wood collection. Both road result in edge effect like more solar radiation and wind penetrate the stand and make the stand unproductive as reported by Camargo and Kapos [31], increased solar radiation and wind can cause the soil to loss its moisture and nutrient hence, the vegetation face lack of water to grow. Similarly this supported by Castillo-Santiago et al. [32], reported that forests that are closer to roads are normally more accessible and hence more easily cleared for agriculture and pasture. Bradford et al., Lindner and Sattler, and Fox et al. [26,33,34], found that selective logging has result in reduced total carbon density of the forest. As a general, the present study low carbon stock at disturbed stand might be related with the presence of more and risky disturbances that affect the stand condition critically.
Conclusion
Forest disturbance has an influence on total carbon stock amount. Different human pressure affects condition and productivity of forest. Highly disturbed stand carbon stock less as compared to undisturbed stand. Road and footpath, logged and dead trees, debarking and lopping and charcoal making area were the most frequently occurred disturbance indicators in the forest. Although, most areas that are found in high altitude and slope are less affected by human disturbances due to physical factors like access to road, sometime this access can be suitable for disturbance drivers in such area. Forest stand near to the road and built-up area easily exposed to disturbances.
References
- Pan Y1, Birdsey RA, Fang J, Houghton R, Kauppi PE, et al. (2011) A large and persistent carbon sink in the world's forests. See comment in PubMed Commons below Science 333: 988-993.
- http://www.ipcc.ch/pdf/assessment-report/ar4/syr/ar4_syr.pdf
- Berberoglu S, Evrendilek F, Ozkan C, Donmez C (2007) Modeling Forest Productivity Using Envisat MERIS Data. J. Sensors 7: 2115-2127.
- IPCC (Intergovernmental Panel for Climate Change) (2001) Climate Change. 2001. Working Group I:. Cambridge University Press: New York The Scientific Basis 51:723-732.
- Binelli EK, Gholz HL, Duryea ML (2012) Plant Succession and Disturbances in the Urban Forest Ecosystem.
- Eliasch J (2008) Climate Change: Financing Global Forests, review paper. ISBN and Crown.
- Evrendilek F, Gulbeyaz O (2008) Deriving vegetation dynamics of natural terrestrial ecosystems from MODIS NDVI/EVI data over Turkey. J. Sensors 8: 5270-5302.
- Yitebitu M, Zewdu E, Sisay N (2010). A review on Ethiopian Forest Resources: current status and future management options in view of access to carbon finances. Prepared for the Ethiopian climate research and networking and the United Nations development programme (UNDP). Addis Ababa, Ethiopia.
- Adhikari MD (2011) Evaluating annual carbon balance of above ground woody biomass in community forest of mid-hills. A case study of Bhaiyadevi Community Forest in Salyan District: Nepal.
- Abebe DB, Bluffstone R, Alemu M (2012) Common property forest management: implications for REDD in Ethiopia.
- Souza JCM, Roberts DA, Monteiro A (2005) Multi-temporal analysis of degraded forests in the southern Brazilian Amazon. J. Earth Interactions. 9: 1-25.
- Kebede B, Soromessa T, Kelbessa E (2014) Structure and Regeneration Status of Gedo Dry Evergreen Montane Forest, West Shewa Zone of Oromia National Regional State, Central Ethiopia. Sci. Technol. Arts Res. J 3: 119-131.
- Amenu E (2007) Use and management of medicinal plants by indigenous people of Ejaji area (CheliyaWoreda) West Shoa, Ethiopia: an ethnobotanical approach. Unpublished M.Sc. Thesis.
- Young SS, Wang CY (2001) Land-cover change analysis of China using global-scale Pathfinder AVHRR Landcover (PAL) data, 1982–92, International journal of remote sensing 22: 1457-1477.
- Bhishma PS, Shiva SP, Ajay P, Eak BR, Sanjeeb B, et al. (2010) Forest Carbon Stock Measurement: Guidelines for measuring carbon stocks in community-managed forests 17-43.
- Kent M, Coker P (1992) Vegetation Description and Analysis. A practical approach. John Wiley and Sons, New York 363.
- Pearson TR, Walker S, Brown S (2005) Sourcebook for land-use, land-use change and forestry projects. Winrock International and the Bio-carbon fund of the World Bank. Arlington 19-35.
- MacDicken KG (1997) A Guide to Monitoring Carbon Storage in Forestry and Agro-forestry Projects. In Forest Carbon Monitoring Program. Winrock International Institute for Agricultural Development.
- Hairiah K, Sitompul SM, Noordwijk M, Palm C (2001) Methods for sampling carbon stocks above and below ground. International Centre for Research in Agroforestry. Southeast Asian Regional Research Programme 10-15.
- IPCC (2006) Good practice guidelines for National Greenhouse gas inventories. Switzerland: Intergovernmental panel on climate change.
- Pearson TR, Brown SL, Birdsey RA (2007) Measurement guidelines for the sequestration of forest carbon. Northern research Station, Department of Agriculture 6-15.
- Dale HV, Joyce AL, Mcnulty S, Neilson PR, Ayres PM, et al. (2001). Climate Change and Forest Disturbances. Journal of BioScience 51: 723-736.
- Goward SN, Masek JG, Cohen W, Moisen G, Collatz GJ, et al. (2008). Forest Disturbance and North American Carbon Flux. EOS 89: 105-106.
- Kurz WA1, Dymond CC, Stinson G, Rampley GJ, Neilson ET, et al. (2008) Mountain pine beetle and forest carbon feedback to climate change. See comment in PubMed Commons below Nature 452: 987-990.
- Bhatti JS, Apps MJ, Jiang H (2002) Influence of nutrients, disturbances and site conditions on carbon stocks along a boreal forest transect in central Canada. J. Plant and Soil. 242: 1-14.
- Bradford JB, Fraver S, Milo AM, D’Amato AW, Palik B, et al. (2012) Effects of multiple interacting disturbances and salvage logging on forest carbon stocks. J. Forest Ecology and Management 267: 209-214.
- Mwakisunga B, Majule AE (2012) The influence of altitude and management on carbon stock quantities in rungwe forest, southern highland of Tanzania. Open Journal of Ecology 2: 214-221.
- Evrendilek F1 (2004) An inventory-based carbon budget for forest and woodland ecosystems of Turkey. See comment in PubMed Commons below J Environ Monit 6: 26-30.
- Vreugdenhil D, Payton JI, Vreugdenhil A, Tilahun T, Nune S, et al. (2012) Carbon baseline and mechanisms for payments for carbon environmental services from protected areas in Ethiopia, World Institute for Conservation and Environment and the Maanaki-WhenuaLandcare Research Institute on behalf of the Ethiopian Wildlife Conservation Authority with funding from GEF / UNDP / GIZ / SDPASE.
- Glenday J (2004) Preliminary Assessment of Carbon Storage and the Potential for Forestry Based Carbon Offset Projects in the Kakamega National Forest, Kenya.Unpublished BSc. Paper.
- Camargo JLC, Kapos V (1995) Complex Edge Effects on Soil Moisture and Microclimate in Central Amazonian Forest. Journal of Tropical Ecology 11: 205-221.
- Castillo-Santiago MA, Hellier A, Tipper R, De Jong BHJ (2003) Carbon emissions from land-use change: an analysis of causal factors in chiapas, Mexico. Mitigation and Adaptation Strategies for Global Change 12: 1-30.
- Lindner A, Sattler D (2011) Biomass estimations in forests of different disturbance history in the Atlantic Forest of Rio de Janeiro, Brazil. Springer Science+Business Media B.V 10: 9281-9289.
- Fox JC, Vieilledent G, Yosi CK, Pokana JN, Keenan RJ (2011) Aboveground Forest Carbon Dynamics in Papua New Guinea: Isolating the Influence of Selective- Harvesting and El Nin˜o. J. Ecosystems. 14: 1276-1288.
Relevant Topics
- Aquatic Ecosystems
- Biodiversity
- Conservation Biology
- Coral Reef Ecology
- Distribution Aggregation
- Ecology and Migration of Animal
- Ecosystem Service
- Ecosystem-Level Measuring
- Endangered Species
- Environmental Tourism
- Forest Biome
- Lake Circulation
- Leaf Morphology
- Marine Conservation
- Marine Ecosystems
- Phytoplankton Abundance
- Population Dyanamics
- Semiarid Ecosystem Soil Properties
- Spatial Distribution
- Species Composition
- Species Rarity
- Sustainability Dynamics
- Sustainable Forest Management
- Tropical Aquaculture
- Tropical Ecosystems
Recommended Journals
Article Tools
Article Usage
- Total views: 11253
- [From(publication date):
December-2015 - Apr 02, 2025] - Breakdown by view type
- HTML page views : 10317
- PDF downloads : 936