Calculation of Annual Heating and Cooling Energy Requirements for Residential Building in Different Climate Zones in Libya
Received: 21-Nov-2017 / Accepted Date: 30-Nov-2017 / Published Date: 06-Dec-2017 DOI: 10.4172/2576-1463.1000161
Abstract
In Libya, the building sector is rapidly growing and consequently more energy is being expended in this field. Due to the nature of our climate, HVAC (Heating, Ventilation and Air-Conditioning) is the primary consumer of energy in buildings. A large portion of this energy may be saved through the use of insulation in order to increase the thermal efficiency. Energy saving techniques are just as important as the development of new energy sources. This paper investigates potential of energy consumption reduction, cost savings and pollutant emission prevention achieved by installing different insulation materials of optimum thickness in residential building wall in Libya. A degree day approach was used for these calculations. Cooling and heating degree day were first calculated for twenty locations across Libya. Then a systematic procedure for optimization of insulation material thickness, payback period and cost analysis was developed and applied for three different types of wall insulation materials. Finally, a correlation between the CDD/HDD and the optimum thickness of insulation materials is presented. The results show that, by introducing optimum insulation thickness of different insulation materials the energy consumption and emissions can be reduced by 70%-80% in comparison to a wall without insulation.
Keywords: Energy saving; Cooling and heating degree day; Insulation material; Optimum thickness; Payback period
Introduction
In Libya, the improvement of living standard induced higher comfort requirements which translated into an increase in the use of heating and air conditioning equipments. In addition, no attention was paid to improve the thermal quality of the building envelope. Consequently, the energy consumption in residential and commercial buildings has significantly increased. This sector (residential and commercial) is expected to be the largest energy consumer by 2020 [1]. Buildings have their substantial share of the energy consumption with as much as 36% of the total energy consumed in residential and commercial buildings. For commercial buildings, about 63% of the energy is used in the form of electricity with about 37% as fossil fuels. One of the most effective ways to reduce heat transmission rate and energy consumption of space cooling and heating is the use of an appropriate thermal insulation in the building envelopes. An optimum thickness of insulation is the value that provides the minimum total cost over the lifetime of the building.
Many previous researches conclude that, the main use of energy in a building is space conditioning with heating, cooling and ventilating contributing a combined total of 43% of the buildings energy demand [2], in addition to other comfort/health parameters [3-5]. This is an obvious area that should be considered when striving to make building more energy efficient. In climate like Libya where cooling is the most important air conditioning process [6], we believe that the electrical energy used in cooling accounts for more than 60% of the total energy consumed in the homes. That is why we should pay more attention towards the energy consumed by air conditioning equipment.
In this paper, we are mainly concerned with the optimization of residential buildings energy use where results can be extended to cover commercial and office buildings. The reason for concentrating on residential buildings is due to the fact that the impact of energy conservation techniques on the overall performance is greater in the residential buildings [7]. This is the direct result of the poor building design at the residential level that tends to ignore the most basic insulation and energy saving measures for the purpose of cutting initial building cost.
Demand of electricity in Libya
Based on the annual report of the general electrical company of Libya, currently Libya has an electric power production capacity of about (4.6-4.7) Giga Watt (GW), with peak load of around (3.3 GW) [8]. Most of Libya's existing power stations are oil-fired, though several have been converted recently to natural gas. Libya's power demand is growing rapidly (around 6%-8% annually), and is expected to reach (8 GW) in 2020. During the summer of 2004, Libya was hit by widespread blackouts as power plants could not keep up with demand. To prevent such blackouts in the future and to meet surging power consumption, Libya's state-owned General Electricity Company (GECOL) has plant to spend $3.5 billion through building eight new combined cycle and steam cycle power plants. Based on the (GECOL) reports, there is an increasing demand for electricity in Libya. Also the most demanding sectors are the residential unit and small businesses. Based on this electricity consumption level, we expect a major problem resulting from the growing gap between the production and the demand. It is worth mentioning here that the maximum demand of electrical power in Libya is during the summer months (the cooling season), namely from May to October. This observation is clearly stated in almost all the (GECOL) reports.
Style of building envelope in Libya
As is known, the better the thermal properties (especially thermal conductivity) of the external building construction materials, the more energy efficient it is. In Libya, the most commonly used construction material for building envelope are the cement brick as the principle substance plus two cement plaster layers as internal and external finishing layers (Figure 1). Cement bricks and reinforced concrete are well known for being easy to construct and for having high durability. This has led their dominance in construction in Libya [9]. However, they also have some disadvantages especially in regards to their thermal properties, namely its high thermal conductivity [10].

Figure 1: The reference and the insulated walls.
Therefore, buildings made of such construction materials are usually uncomfortable for its occupant unless an air-conditioning system is heavily employed [11]. The benefits of the building insulation can be summarized as:
i. Reduces the amount of energy transferred through the building envelope. This reduction in lost energy has a great impact on building efficiency,
ii. Eliminates the problems of condensation on the internal surface of the building,
iii. Eliminates the building envelope cracks which results from the thermal stress.
In this study, the principles of heating and cooling degree day were used to study the energy consumption of residential building in several Libyan cities. We determined the optimal insulation thickness and the corresponding energy and cost savings in approximately twenty locations across Libya. The objectives and scope of this study can be summarized into the following points:
1. The cooling and heating degree days (CDD and HDD) were calculated for twenty Libyan cities. These twenty locations were selected to fully cover all of the geographical zones of the country.
2. Using the daily CDD and HDD, the monthly and annual CDD/ HDD were calculated and decomented for all the selected locations.
3. A systematic approach was used for calculating:
• The optimal insulation thickness as afunction of CDD/HDD,
• The payback period of the insulation cost,
• Cost analysis and comparison between minimum walls with insulation thickness and walls with-out insulation (common building wall envelope structure).
4. For practical applications, a design chart and emperical correlation between the optimal insulation thickness and the values at (CDD/HDD) is presented for different zones in Libya.
Governing Equations and Solution Procedure
In order to give a thorough illustration of the adapted procedure and equations, a simple case (as an example) is presented and complete calculations are performed. In this study the temperature data were used for calculating the daily, monthly and annual values of cooling and heating degree day. Microsoft Excel was used for data processing and the results are arranged and presented in tables as well as graphical from.
Degree day calculations
The degree day approach is based on the fact that the need of buildings in energy is directly proportional to a difference between mean daily temperature of ambient air and indoor temperature. The indoor temperature is the temperature of below or above which there is a need to spend energy to create comfortable conditions. The temperature data for of the city of Benghazi will be used as a demonstrative case for the calculation of CDD and HDD.
Cooling degree day (CDD)
Table 1 below summarizes the equation used for the calculation of the cooling degree day (CDD). The temperature recorded for the city of Benghazi will be used as an example. Table 2 gives the temperature of Benghazi in the month of August 2007 and the corresponding values of the daily and monthly cooling degree day.
| Conditions | Equation |
|---|---|
| If Tmax<Tbase | CDD=0 |
If 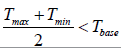 |
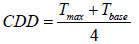 |
| If Tmin<Tbase | 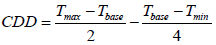 |
| If Tmin>Tbase | 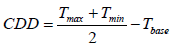 |
Table 1: The equation used for the calculation of the cooling degree day (CDD).
| Date | Tbase | Tavg | Tmax | Tmin | Degree day | |
|---|---|---|---|---|---|---|
| Daily COOLING | Monthly COOLING | |||||
| Aug. 1 | 20 | 26.7 | 30.3 | 24 | 7.15 | 224.85 |
| Aug. 2 | 20 | 26.6 | 32 | 22.3 | 7.15 | |
| Aug. 3 | 20 | 26.5 | 32.2 | 21.8 | 7 | |
| Aug. 4 | 20 | 25.7 | 30 | 20 | 5 | |
| Aug. 5 | 20 | 26.2 | 30.3 | 21 | 5.65 | |
| Aug. 6 | 20 | 26 | 31 | 20.6 | 5.8 | |
| Aug. 7 | 20 | 26.3 | 30.4 | 20 | 5.2 | |
| Aug. 8 | 20 | 25.1 | 30.3 | 20 | 5.15 | |
| Aug. 9 | 20 | 26.9 | 33 | 19.6 | 6.4 | |
| Aug. 10 | 20 | 28.5 | 37 | 22.9 | 9.95 | |
| Aug. 11 | 20 | 27.2 | 32 | 23.3 | 7.65 | |
| Aug. 12 | 20 | 26.8 | 33 | 22 | 7.5 | |
| Aug. 13 | 20 | 26.6 | 31 | 22 | 6.5 | |
| Aug. 14 | 20 | 25.8 | 30 | 20 | 5 | |
| Aug. 15 | 20 | 27.1 | 32.2 | 21.6 | 6.9 | |
| Aug. 16 | 20 | 26.8 | 31.2 | 21 | 6.1 | |
| Aug. 17 | 20 | 27.1 | 33.2 | 22 | 7.6 | |
| Aug. 18 | 20 | 27 | 31.4 | 21 | 6.2 | |
| Aug. 19 | 20 | 25.8 | 31 | 20.6 | 5.8 | |
| Aug. 20 | 20 | 27.3 | 33.2 | 20 | 6.6 | |
| Aug. 21 | 20 | 29.9 | 36.9 | 21.6 | 9.25 | |
| Aug. 22 | 20 | 29.7 | 37.3 | 23 | 10.15 | |
| Aug. 23 | 20 | 30.2 | 36 | 25.2 | 10.6 | |
| Aug. 24 | 20 | 29.1 | 35.8 | 25 | 10.4 | |
| Aug. 25 | 20 | 29.3 | 36.2 | 23.7 | 9.95 | |
| Aug. 26 | 20 | 28.1 | 36 | 23 | 9.5 | |
| Aug. 27 | 20 | 26.9 | 32 | 22 | 7 | |
| Aug. 28 | 20 | 26.9 | 32 | 22 | 7 | |
| Aug. 29 | 20 | 26.5 | 31.1 | 21.9 | 6.5 | |
| Aug. 30 | 20 | 27.6 | 33.1 | 21.6 | 7.35 | |
| Aug. 31 | 20 | 27.3 | 32 | 21.7 | 6.85 | |
Table 2: The temperature of the city of Benghazi in the month of August 2007 and the corresponding values of the daily and monthly cooling degree day.
Heating degree day (HDD)
For the Heating degree day calculation, the equation summarized in Table 3 are used. A gain the city of Benghazi was used as an example for the heating degree day calculations. Table 4 below, gives the daily reading at the temperature of the month of January (2007) and the corresponding daily values of the heating degree day (HDD).
| Conditions | Equation |
|---|---|
| If Tmin<Tbase | HDD=0 |
If 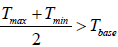 |
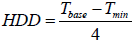 |
| If Tmax ≤ Tbase | 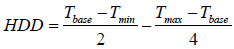 |
| If Tmin<Tbase | 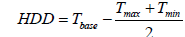 |
Tmin: Minimum Temperature (°C)
Tbase: Base Temperature (°C)
HDD: Heating Degree Day (°C day)
Table 3: The equation used for the calculation of the heating degree day (HDD).
| Date | Tbase | Tavg | Tmax | Tmin | Degree day | |
|---|---|---|---|---|---|---|
| Daily heating | Monthly heating | |||||
| Jan. 1 | 20 | 12.4 | 16.2 | 8 | 7.9 | 198.925 |
| Jan. 2 | 20 | 13.4 | 17 | 8.6 | 7.2 | |
| Jan. 3 | 20 | 13.6 | 18 | 10 | 6 | |
| Jan. 4 | 20 | 10.3 | 12 | 8 | 10 | |
| Jan. 5 | 20 | 12.4 | 16.2 | 9.1 | 7.35 | |
| Jan. 6 | 20 | 13.2 | 17.1 | 10 | 6.45 | |
| Jan. 7 | 20 | 12.4 | 16.2 | 9 | 7.4 | |
| Jan. 8 | 20 | 11.4 | 15 | 7 | 9 | |
| Jan. 9 | 20 | 12.4 | 18 | 7 | 10.65 | |
| Jan. 10 | 20 | 13.6 | 18 | 9.7 | 6.15 | |
| Jan. 11 | 20 | 13.7 | 18 | 9 | 6.5 | |
| Jan. 12 | 20 | 15.3 | 18 | 10 | 6 | |
| Jan. 13 | 20 | 14.5 | 18 | 8.8 | 6.6 | |
| Jan. 14 | 20 | 14.3 | 18 | 12 | 5 | |
| Jan. 15 | 20 | 13.4 | 18 | 8 | 7 | |
| Jan. 16 | 20 | 13.3 | 18.1 | 7.9 | 7 | |
| Jan. 17 | 20 | 12 | 17.5 | 6.9 | 7.8 | |
| Jan. 18 | 20 | 11.1 | 17.5 | 6 | 8.25 | |
| Jan. 19 | 20 | 14.4 | 18 | 8.4 | 6.8 | |
| Jan. 20 | 20 | 15.3 | 18.2 | 11 | 5.4 | |
| Jan. 21 | 20 | 12.1 | 19.3 | 8 | 6.35 | |
| Jan. 22 | 20 | 13.9 | 20 | 7.8 | 6.1 | |
| Jan. 23 | 20 | 14 | 19 | 9.8 | 5.6 | |
| Jan. 24 | 20 | 16.3 | 21 | 11 | 4.25 | |
| Jan. 25 | 20 | 16.9 | 23.4 | 12.3 | 3 | |
| Jan. 26 | 20 | 17.8 | 23.3 | 14 | 2.175 | |
| Jan. 27 | 20 | 19.3 | 24 | 14.2 | 1.9 | |
| Jan. 28 | 20 | 14.7 | 21 | 12 | 3.75 | |
| Jan. 29 | 20 | 11.6 | 15 | 6.6 | 9.2 | |
| Jan. 30 | 20 | 11.4 | 18.6 | 6.6 | 7.4 | |
| Jan. 31 | 20 | 15 | 21 | 10 | 4.75 | |
Table 4: The temperature of the city of Benghazi in the month of January 2007 and the corresponding values of the daily and monthly heating degree day.
It is worth mentioning here that, the calculations performed above (for CDD and HDD) are for the city of Benghazi and for only one month. However, in order to achieve the objective at this project, the value of the annual degree day must be determined. Therefore, the values of the monthly cooling and heating degree day for the entire year (2007) was calculated not only in the city of Benghazi but also in the remaining locations (about 20 locations across Libya).
Energy And Cost Analysis Optimization
In order to lower the heat flow from the outside to inside buildings that have air conditions an insulation material is usually used. This material has a very low thermal conductivity. In this case, a suitable insulation material with its optimal thickness is necessary in order to have an economic air conditioning system. The insulation thickness will increase the investment cost, but the cost of energy will decrease, until at one point the thickness of material is optimum and will contribute the highest overall cost savings. This can be done by conducting life cycle cost or cost benefit analysis due to the installation of insulation material. To calculate cost benefit, it is necessary to know the total cost of insulation (Ci) which is can be calculated by the following equation:
Ci=Ax*CA (1)
Where:
A: Surface area (m2)
x: Insulation thickness (m)
CA: Cost of insulation per unit volume (LD/m3)
S=Cfo-Cw-Ci (2)
Where:
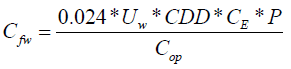
Cfo : Total cost of energy consumption annually without insulation (LD/m2)
Cw : Total cost of energy consumption annually with insulation (LD/m2)
Ci : Total cost of insulation (LD/m2)
While, the total cost of energy consumption can be calculated as follows:
Cfo=Ew * Cw * P (3)
Where:
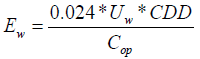
Ew : Total amount of energy consumption for air conditioning.
 (4)
(4)
Where:
Qw : Heat transmission through building envelope (W/m2).
Cop : Co-efficient of performance.
This thermal transmission process through the wall can be calculated by the following equation:
Qw=0.024 * Uw * CDD (5)
CDD: cooling degree day (°C day)
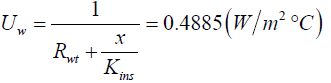
Uw : Overall heat transfer co-efficient with insulation.
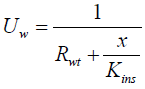 (6)
(6)
 (7)
(7)
Uo: Overall heat transfer co-efficient without insulation.
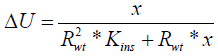
Sub. equation (5) into equation (4) we get:
 (8)
(8)
Sub. equation (8) into equation (3) we get:
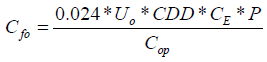 (9)
(9)
And,
 (10)
(10)
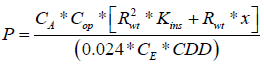
Sub. equation (9) and (10) into equation (1)
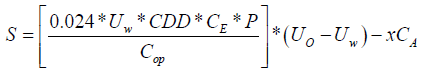 (11)
(11)
S: Annual saving (LD/m2).
The optimum insulation thickness is obtained by maximizing the net saving (S). Therefore, derivative at (S) with respect to (x) and equal it with zero.
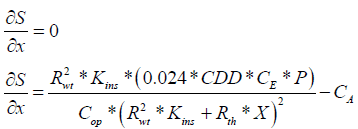
Solve for x (x=Xopt) we get:
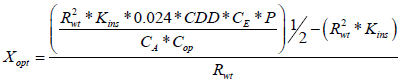 (12)
(12)
Where :
Xopt: The optimum thickness of insulation (m)
CA: Cost of insulation per unit volume (LD/m3)
Rwt: Thermal resistance of the composite wall (m2°C/W)
P: Life cycle parameter (assumed 25-30 years)
CDD : Cooling degree day (°C day)
Kins:Thermal conductivity of the insulation(W/m°C)
CE: Cost of electricity (LD)
To get the payback period use equation (3.11) with 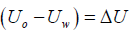
 (13)
(13)
Sub. equation (13) into equation (11) and equal it with zero and solve for P we get
 (14)
(14)
Where :
P: The payback period (year)
The actual running costs and greenhouse gas emissions will depend on the electricity tariff, the local climate, the size of the building being conditioned, house design, thermostat settings and operating times. To estimate the lifetime greenhouse gas emissions, for each kWh of electricity consumed, around 1 kg of carbon dioxide is emitted at the power station; which can be written as:
 (15)
(15)
Where:
Co2: The life time green house Co2 emission (Ton2/m2 life)
Case Study
This section will be used to present the calculations for the optimum insulation thickness and the cost analysis for only one location, namely the city of Benghazi. We will start first by giving a complete description of the selected case. This description will include the description of the reference wall and its structure. Then, the insulation wall and the location of the insulation material within the wall will be illustrated so that an easy comparison can be performed.
Description of the case
In addition to the information given in Table 5, the following input parameters are also used in the calculations. Cop is the co-efficient of performance of the A/C system and is assumed to be 2.0. CE is the cost of electricity and equal to 0.05 (LD/KW. h). CA is the cost of insulation per unit volume and equal to 156 LD/m3. P is the Life cycle parameter and equal to 25 years. We should note here that the value of convection resistance is ignored in this analysis and the walls are assumed under steady state conditions.
| Wall/Layer | Reference wall | Insulation wall |
|---|---|---|
| L1 | Plaster (20 mm) | Plaster (20 mm) |
| L2 | Hollow concrete block (200mm) | Hollow concrete block (100mm) |
| L3 | Plaster (30 mm) | Insulation layer |
| L4 | --- | Hollow concrete block (100mm) |
| L5 | --- | Plaster (30 mm) |
Table 5: Structure of the walls (reference and insulation).
Illustrative calculations
The overall heat transfer coefficients of un-insulated reference and insulated walls can be calculated as :
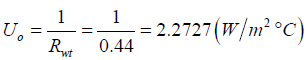
The overall heat transfer coefficients of insulated walls can be calculated as:
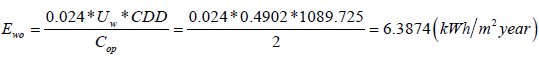
The total amount of energy consumption for air conditioner through the wall without insulation layer can be calculated by using the following equation:
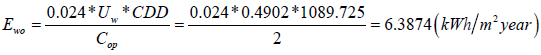
The total amount of energy consumed for air conditioner through the wall with insulation layer can be calculated by using the following equation:
The thermal transmission load through the wall without insulation layer can be calculated as:

The thermal transmission load through the wall with insulation layer can be calculated as:

The optimal of insulation thickness, in meters, can be estimated from;
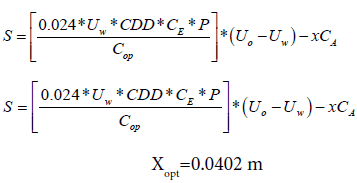
The savings from use of insulation system then becomes:
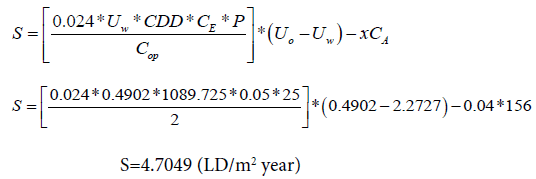
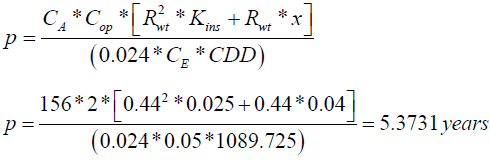
The payback period can be estimated from;
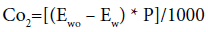
Then, the decrease in the amount of CO2 emitted to the environmental is:
CO2=[(Ewo – Ew) * P]/1000
CO2=0.5833 (Ton/m2 life).
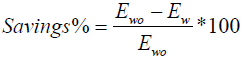
Finally, the percentage of energy saving due to the employment of the insulation can be estimated from;

This is only a sample of calculations performed for only one location. In order to achieve the objective of this project and cover all the twenty locations a computer program is used for performing all the calculations. With multiple input and output parameters, all the above equations are programmed in an interactive manner by using the visual Fortran computer language.
Results and Discussion
In order to present the results in an effective way, it is divided into three main sections. Section one is devoted completely to the results obtained from the calculations of the cooling and heating degree days for the selected location (twenty locations across Libya). Section two is used to present the results relating to the energy consumed in the building and the cost associated with it. This section includes the results of:
i. The energy consumed by air conditioning equipment in a typical residential building in Libya,
ii. The optimum insulation thickness required as a function of CDD/HDD,
iii. The amount of greenhouse pollutants (namely CO2) emitted to the environment as a result of the electrical consumption in air conditioners,
iv. The cost and the payback period of the insulation. Finally, section three is used for presenting an empirical correlation which links the optimum insulation thickness on one side with the CDD/HDD and the thermal conductivity of the insulation on the other side.
Results of the CDD and HDD
The results of the calculations of the daily, monthly and annual cooling and heating degree days are presented in this section. In order to maximize the benefits from this paper and make the results more general, the cooling and heating degree day calculations are performed at three different base temperatures (namely Tb=15, 20 and 25°C). Table 6 summarizes the result of the cooling and heating degree day of the three base temperatures for the twenty locations across Libya. As we can see from the values, there is an inverse relationship between the CDD or HDD and the value of the base temperature (Tb). As the Tb increases the corresponding value of (CDD/HDD) decreases. Apart from the value of (Tb), it can be seen that the south region of Libya (namely Al-kufra and Sabha) has the highest values of annual cooling degree days and also have relatively low value of annual heating degree days. This implies that the buildings located in this region consume high energy in cooling and heating seasons. On the other hand, a city like Shahat for example (which is located in the North East of Libya) has a low values of cooling degree days and a high value of heating degree days.
| City name | Annual degree day (Tbase=25) | Annual degree day (Tbase=20) | Annual degree day (Tbase=15) | |||
|---|---|---|---|---|---|---|
| COOLING | HEATING | COOLING | HEATING | COOLING | HEATING | |
| Tobruk | 285.05 | 1785.45 | 1042.725 | 718.125 | 2291.425 | 141.825 |
| Giarbub | 889 | 1769.6 | 1809.85 | 865.45 | 3081.1 | 311.7 |
| Derna | 225.225 | 1804.025 | 948.825 | 702.625 | 2177.25 | 106.05 |
| Shahat | 158.825 | 3127.325 | 564.275 | 1707.775 | 1384.3 | 702.8 |
| Benghazi | 400.9 | 2140.65 | 1082.725 | 997.475 | 2218.325 | 293.075 |
| Agedabia | 568.725 | 1758.575 | 1395.675 | 760.525 | 2670.6 | 210.45 |
| Jalo | 955.5 | 1583.2 | 1932.85 | 735.55 | 3266.35 | 244.05 |
| Kufra | 1306.25 | 1370.4 | 2419.5 | 658.65 | 3814.175 | 228.325 |
| Sirte | 438.225 | 1702.575 | 1243.525 | 682.875 | 2534.825 | 149.175 |
| Sebha | 1139.9 | 1666 | 2154.65 | 855.75 | 3474.15 | 350.25 |
| Obari | 1322.175 | 1564.275 | 2385.225 | 802.325 | 3750.25 | 342.35 |
| Hon | 929.275 | 1761.625 | 1852.1 | 859.45 | 3143.225 | 325.575 |
| Misurata | 415.475 | 1763.475 | 1166.775 | 689.775 | 2436.675 | 134.675 |
| Elkhoms | 396.5 | 1960.9 | 1111.675 | 851.075 | 2316.725 | 231.125 |
| Tripoli | 692.25 | 2026.35 | 1462.1 | 971.2 | 2635.575 | 319.675 |
| Zuara | 397.35 | 1710.9 | 1183.45 | 672 | 2474.625 | 138.175 |
| Yefren | 505.725 | 2420.825 | 1181.05 | 1271.15 | 2216.6 | 481.7 |
| Nalut | 602.85 | 2177.1 | 1330.75 | 1080 | 2425.275 | 349.525 |
| Ghat | 1444.475 | 1425.025 | 2543.725 | 699.275 | 3947.525 | 278.075 |
| Ghadames | 1262.875 | 1654.575 | 2240.225 | 806.925 | 3540.4 | 282.1 |
Table 6: CDD and HDD of the selected locations at the three base temperatures.
Figures 2 and 3 show the annual cooling and heating degree days values for the selected locations. These figures are presented at the three value of (Tb) in a column representation style for easy comparison. It is worth mentioning here that knowing the value of CDD/HDD is a primary and essential step before performing any building evaluation and/or energy calculation. We believe that the tabulated values of CDD and HDD given in this project will be very helpful in any future studies dealing with the building thermal evolution in Libya.

Figure 2: Annual CDD for the selected locations at the three base temperatures.

Figure 3: Annual HDD for the selected location of the three base temperatures.
Results for energy consumptions
This section is used to present the results of the energy consumption which includes the optimization of the insulation thickness, and some other important energy and cost parameters. From the first glance, one can notice the positive effect of the employment of the insulation material with optimum thickness. Using insulation plays a positive role in both the economic as well as environmental aspects. Table 7 gives the results for the city of Benghazi (CDD=1082.725°C/day) and compares between three types of insulation materials which are commonly used in building insulation.
| Description | Insulation material | ||
|---|---|---|---|
| Fiberglass | Polyurethane | polystyrene | |
| Thermal conductivity, K (W/m°C) | 0.05 | 0.025 | 0.032 |
| Cost of insulation, CA(LD/M3) | 142 | 156 | 170 |
| Optimum thickness, Xop (m) | 0.0536 | 0.04 | 0.0412 |
| Annual energy consumption, Ew(Kwh/m2 year) | 8.5906 | 6.3669 | 7.5196 |
| Insulation cost, Ci (LD/m2) | 7.6112 | 6.24 | 7.004 |
| Payback period, (year) | 7.2731 | 5.3904 | 6.3663 |
| Amount of Co2 emission (ton/m2 life) | 0.5235 | 0.579 | 0.5502 |
| The annual saving per unit area (LD/m2 year) | 3.8134 | 4.6664 | 4.2135 |
Table 7: Results of insulation material calculations for the city of Benghazi (CDD=1089.725°C day).
Figure 4 gives the relationship between the annual CDD/HDD and four other thermal and economical parameters. This figure summarizes the results obtained in this project and can be used as a design chart for practical applications. Again as an illustrative case, the city of Benghazi is used as an example with a value of CDD equal to 1089.725 (°C day). With only knowing the value of (CDD), the other important values such as (i) optimum insulation thickness, (ii) optimum thermal transmittance, (iii) annual saving value and (iv) the payback period can be easily determined.

Figure 4: Relationship between CDD/HDD and each of the (a) optimum insulation thickness, (b) optimum thermal transmittance, (c) annual energy saving and (d) energy payback period.
The effect of the insulation thickness on the cost for the three types of wall insulation materials is shown in Figure 5. As can be seen, the cost of insulation increases linearly with increasing insulation thickness. Hence, the total cost has a non-linear relationship with the insulation thickness. The total cost decreases with increasing insulation thickness until it reaches the optimum insulation thickness where the total cost is at minimum and from there on the total cost increases. This is true with all types of insulation materials and with all values of CDD/HDD.

Figure 5: Effect of the insulation thickness on the cost for (a) polyurethane, (b) polystyrene and (c) fiberglass.
Development of empirical correlation
In the order to get a complete view of parameters affecting the thermal performance of the wall, the relationship between the optimum insulation thickness of the insulation (Xop) and the (CDD/ HDD) has been investigated. An empirical correlation for the optimum thickness is proposed in this study. Thermal transmission in a certain material depends upon the thermal property (in our case the thermal conductivity) and the thickness of that material. The lower value thermal conductivity, the lower the thermal transmission will be. Similarly, the thicker insulation material, the less thermal transmission will be. Therefore, there should be a relationship between the thermal conductivity and optimum thickness for energy insulation material. To our knowledge, this relation has not been found yet for the climate of Libya. In this study we will propose an empirical correlation between the optimum thickness (Xop) and the (CDD/HDD) for the climate values usually experienced in Libya.
As shown in Figure 6 the relationship between (Xop) and the (CDD/ HDD) is a non linear relation. The best fit equation describing this nonlinear behavior is:

Figure 6: The relationship between (Xop) and the (CDD/HDD).
Xop=a+b (CDD)0.5
Where :
a=-0.0132285
b=0.0010887
Xop : is the optimum insulation thickness (m).
CDD: is the Cooling Degree Day (or HDD) (°C day).
This empirical correlation will be very important in the future since it will enable us to estimate the optimum insulation thickness easily without doing a long analysis. One last note regarding the proposed correlation is that, it is valid for a wide range of thermal conductivity (0.02 ≤ K ≤ 0.035) which covers most of the commonly used wall insulation available in the market.
Conclusions and Recommendations
At the end of this study, a number of conclusions and recommendations were drawn;
Conclusions regarding the degree day calculations
(1) The value of the base temperature (Tb) plays a very important role in determining the value of the CDD/HDD for any location.
There is a direct relationship between the Tb and the HDD; while an inverse relationship exists between the Tb and the CDD.
(2) The CDD/HDD for the coastal zone across Libya is relatively similar. However, for the southern locations the values of CDD are similar and much higher than the northern (coastal) locations.
(3) At the three values of Tb used in this project, the highest value of CDD is recorded for the city of Ghat (located in the southern part of Libya) while the lowest value of the CDD is recorded for the city of Shahat (located in the northeastern of Libya).
(4) Also for the three values of (Tb) used in this project, the smallest values of (HDD) is recorded for the city of Zuara and the highest value is recorded for the city of Shahat.
Conclusion Regarding The Building Insulation Optimization
(1) The optimum insulation thickness is a strong function in the climate conditions, namely the CDD/HDD.
(2) The higher the value of the CDD, the higher the value of the optimum insulation thickness.
(3) The thermal property of the insulation material namely, the conductivity (Kins) has a direct impact on the insulation thickness (Xopt).
In other words, the lower the values of Kins, the lower the value of the insulation thickness (Xopt).
(4) For the three types of the insulation materials used in this project, it was found that the values of optimum insulation thickness (Xopt) varies from (0.0061 ≤ Xopt ≤ 0.1187) depending on the values of CDD/HDD used in the calculation.
(5) Based on the calculations performed in this project for a typical residential house in the city in Benghazi, the use of insulation of optimum thickness can reduce the energy lost through the walls by as much as 78.43%. This is a very significant value and can justify any initial investment in the insulation materials.
(6) It is believed that this work and its findings would give architects, building managers, HVAC engineers and energy researchers a good idea about the likely impacts and a better understanding of the energy consumption of a residential building in Libya.
(7) Finally, from the calculations performed in this project, the results showed that insulation of residential buildings in Libya is very economically feasible and should be implemented as it will provide higher rates of comfort accompanied by lower air conditioning energy costs and less air pollution.
Recommendations
Based on the results from this project, the following recommendations can be deduced;
1. Despite the fact that great care was paid during the gathering of the data used in the calculation CDD/HDD, it is recommended to used more data (for example, weather data from the last ten years) to determine a more accurate value of (CDD/HDD).
2. Building energy researchers should work on the development of a design code for Libya. This design code will be very useful for the architects, building owners and HVAC engineers.
3. Insulation materials should be used in the construction of the external walls (building envelope) (especially in the locations with high CDD/HDD values) in order to improve the thermal performance of the currently popular wall construction (plaster-Hollow brick-plaster).
4. Broadening of building research with emphasis on the introduction of low –cost high thermal performance materials into the local market.
5. Building designers and architects should adapt and develop the designs which consume a minimum amount of energy. This can be achieved by:
(i) Avoiding large external window area and double glazed windows should be used.
(ii) The building should be oriented is such a way that it receives minimal heat gain in the summer and maximum in the winter.
(iii) The area around the building should be modified in such a way to minimize heat gains or losses. For example, shade from trees could decrease the solar heat gains.
The government should promote ways of decreasing energy use, which include promotion and encouraging the people and organizations to use insulation materials as part of the building envelope. It is difficult to convince people to apply insulation to their building for the sake of environment only however one can convince them by showing the great economical benefit of building insulation and how they will affect their electrical bill.
References
- Ahmad EH (2002) Cost analysis and thickness optimization of thermal insulation materials used in residential building in Saudi Arabia.Saudi Engineering Conference, KFUPM, pp: 21-31.
- Gary James (2008) Reducing The Carbon Output of A Modern Commercial Building.
- Kenisarina M, Kenisarinab K (2007) Energy saving potential in the residential sector of Uzbekistan. Energy J EN 32: 1319-1325.
- Daouas N (2011) A study on optimum insulation thickness in walls and energy savings in Tunisian buildings based on analytical calculation of cooling and heating transmission loads. J Appl Ener 88: 156-164.
- Almathnani MG (2006) UTES potential for space heating and cooling in Libya. Therm Ener Storage.
- Newsham GR, Mancini S, Birt BJ (2009) Do LEED-certified buildings save energy? Yes, but…. Energ Buildings 41: 897-905.
- Saad AF, Abdalla YK, Hussein NA, Elyaseery IS (2010) Radon exhalation rate from building materials used on the Garyounis University campus, Benghazi, Libya. Turkish J Eng Env Sci 34: 67-74.
- Suleiman BM (2011) Estimation of U-value of traditional North African houses. Appl Therm Eng 31: 1923-1928.
- Ealiwa MA, Taki AH, Howarth AT, Seden MR (2001) An investigation into thermal comfort in the summer season of Ghadames, Libya. Build Environ 36: 231-237.
Citation: Bodalal A, Mashite S, Aladouli O, Ihdash A (2017) Calculation of Annual Heating and Cooling Energy Requirements for Residential Building in Different Climate Zones in Libya. Innov Ener Res 6: 161. DOI: 10.4172/2576-1463.1000161
Copyright: © 2017 Bodalal A, et al. This is an open-access article distributed under the terms of the Creative Commons Attribution License, which permits unrestricted use, distribution, and reproduction in any medium, provided the original author and source are credited.
Share This Article
Recommended Journals
Open Access Journals
Article Tools
Article Usage
- Total views: 9558
- [From(publication date): 0-2017 - Nov 22, 2024]
- Breakdown by view type
- HTML page views: 8574
- PDF downloads: 984