Research Article Open Access
Bone Marrow Derived Connective Tissue Progenitor Cell Responses on Microtextured Substrates with Controlled Mechanical Cues
Eun Jung Kim1, Alvaro Mata2, Aaron J Fleischman3, George F Muschler3,4 and Shuvo Roy1*1Department of Bioengineering and Therapeutic Sciences, University of California, San Francisco,QB3/Byers Hall, Room 203A, MC 2520, 1700 4th Street, San Francisco, California 94158, USA
2Nanotechnology Platform, Parc Científic Barcelona, Baldiri Reixac 10, Barcelona, Spain 08028, Spain
3Department of Biomedical Engineering, Lerner Research Institute, Cleveland Clinic, 9500 Euclid Avenue, Cleveland, Ohio 44195, USA
4Department of Orthopaedic Surgery, Cleveland Clinic, 9500 Euclid Avenue, Cleveland, Ohio 44195, USA
- Corresponding Author:
- Shuvo Roy, Ph.D.
Department of Bioengineering & Therapeutic Sciences
University of California, San Francisco,QB3/Byers Hall
Room 203A, MC 2520, 1700 4th Street, San Francisco, California 94158, USA
Tel: (415) 514-9666
Fax: (415) 514-9766
E-mail: shuvo.roy@ucsf.edu
Received date: September 02, 2013; Accepted date: December 31, 2013; Published date: January 06, 2014
Citation: Kim EJ, Mata A, Fleischman AJ, Muschler GF, Roy S (2014) Bone Marrow Derived Connective Tissue Progenitor Cell Responses on Microtextured Substrates with Controlled Mechanical Cues. J Biomim Biomater Tissue Eng 19:121. doi:10.4172/1662-100X.1000121
Copyright: © 2014 Kim EJ, et al. This is an open-access article distributed under the terms of the Creative Commons Attribution License, which permits unrestricted use, distribution, and reproduction in any medium, provided the original author and source are credited.
Visit for more related articles at Journal of Biomimetics Biomaterials and Tissue Engineering
Abstract
The relationship between mechanical and topographical features of tissue engineering scaffolds and the likely response of human adult stem cells was investigated by a simple, yet powerful in vitro model, based on varying substrate stiffness with the precise and reproducible patterning capabilities of micro fabrication techniques. Polydimethylsiloxane (PDMS) pre-polymer and cross-linker were combined at various weight ratios designated as PDMS-a to PDMS-e, corresponding to 5.7, 10.0, 14.3, 21.4, and 42.9 wt. % cross-linker, respectively. PDMS microtextures with 10 μm diameter and 6 μm height microposts were produced using soft lithography and correlated to preferential human bone marrow derived connective tissue progenitor cells (CTPs) behavior as a function of varying stiffness. To investigate cell proliferation and osteogenic differentiation, CTPs were cultured for 30 days on a topographical map of substrates that combines 3 different types of PDMS microtextures and smooth PDMS. Elastic modulus, which is directly related to stiffness, increased from 0.78 ± 0.25 MPa (PDMS-a) to 2.83 ± 0.26 MPa (PDMS-c), and decreased down to 1.66 ± 0.18 MPa (PDMS-e). The cell number and gene expression levels were proportional to the PDMS stiffness, and PDMS microtextures exhibited greater numbers of CTPs compared to smooth PDMS. Alkaline phosphatase expressed greater on post microtextures than smooth surfaces on early days. Regardless of surface topographies, however, cells on PDMS-b consistently expressed more osteocalcin compared on other substrates on day 30. These results indicate that CTP proliferation and early osteogenic differentiation are more likely to be affected by surface microtextures, while substrate stiffness is more likely to influence the late osteogenic differentiation.
Keywords
Elastic modulus; Surface topography; Soft lithography; Polydimethylsiloxane; Biomems; Osteogenesis; Adult stem cell
Introduction
Understanding and optimizing cell-substrate interactions is critical to the rational design of implant materials and tissue engineering scaffolds, particularly for bone healing applications [1]. Successful bone fracture healing depends upon having an osteoactive environment. The surface topography and mechanical stiffness of bone graft materials should allow transplanted cells to retain their function and promote cell growth. In bone tissue engineering, however, the number of materials used to investigate the effects of surface topography or mechanical properties on cell response has been limited [2,3].
To study cell-substrate interactions, many groups have used Polydimethylsiloxane (PDMS) as a biomaterial. PDMS is a silicone elastomer with desirable mechanical and chemical properties that make it attractive for the development of microelectromechanical systems (MEMS) for biomedical applications [4-7]. PDMS has been used as a biomaterial in a number of biomedical MEMS (bioMEMS) applications, including biosensors, tissue engineering scaffolds, cell sorting and analysis devices, and various microfluidic devices for biological applications [8,9]. In addition, PDMS is nontoxic, transparent, chemically inert, simple to handle and manipulate, less expensive than silicone, and can conform to submicron features to develop microstructures.
The application of MEMS-based devices in the biomedical arena that use PDMS as a biomaterial has been largely driven by the development of soft lithography techniques such as microtransfer molding, microcontact printing, replica molding, and solvent-assisted micromolding [5,6]. These techniques typically require the use of PDMS to create an elastomeric stamp or mold incorporating microstructures, allowing transfer of patterns onto a substrate for subsequent exploration of selective cellular responses to specific substrate characteristics.
Numerous studies have demonstrated that the biological performance of cells with respect to proliferation, migration, and differentiation can be significantly modified by different topographical features on a PDMS scaffold surface [4,5,7,10,11]. In a previous study conducted by our group, human bone marrow-derived connective tissue progenitor cells (CTPs) were cultured for 9 days on smooth PDMS surfaces and on PDMS post microtextures that were 5, 10, 20 and 40 μm in diameter and separation [12,13]. This study revealed that post microtextures with 10 μm diameter exhibiting higher number of cells. Additionally, PDMS allows control of the mechanical environment by altering the weight ratio of base to cross-linker during fabrication. Recently, several research groups have reported that alterations of substrate stiffness can directly influence cell proliferation [2,7,14,15]. Rowlands et al. [14] reported that stiffer substrates encouraged up to a 10-fold increase in mesenchymal stem cell numbers over soft substrates. Tzvetkova-Chevolleau et al. [15] demonstrated that fibroblast cells exhibit differential morphology and motility responses to changes in substrate stiffness. Moreover, Chen et al. used substrates that were patterned with two levels of stiffness (PDMS with a base: cure ratio of 50:1 and 10:1) and demonstrated that fibroblasts and endothelial cells accumulated preferentially on stiffer regions of PDMS substrates [5,6]. However, comparatively little is known about the cellular effects of the extended range of substrate stiffness, and no studies have presented a systematic analysis of the combined effects of the varying surface microtopography and stiffness on stem cell behavior. Indeed, it remains unclear how cells sense combinations of these two different types of structural and mechanical factors [2,7,14,15].
CTPs refer to a heterogeneous population of stem and progenitor cells that are resident in native tissue. These cells are capable of proliferating and giving rise to progeny, which contribute directly to the formation of one or more connective tissues [13,16,17]. Harvest and transplantation, and even concentration, of CTPs from native bone marrow have been known to improve bone graft efficiency. A characteristic of many marrow derived CTP is their ability to give rise to progeny that are capable of differentiating along a number of mesenchymal lineages including bone cartilage, muscle and fat [16].
It is known that human bone marrow derived stem cells are inherently heterogeneous in their expressions profiles (genes, proteins, surface antigens, etc.) across a given donor population, and hence, statistical significance is important to prove any result is reproducible across technical and biological replicates [16]. However, our previous experiments confirmed that CTPs on microposts showed statistically similar trends of proliferation and osteogenic differentiation regardless of multiple donors, where CTP progeny cultured on post microtextures also exhibited increased cell number relative to smooth and tissue culture control surfaces [13,17].
In this study, a novel approach is used to systematically investigate the effects of PDMS surface topography and stiffness on the behavior of human bone marrow-derived CTPs. The PDMS post microtextures were developed using soft lithography techniques and were correlated to preferential CTP growth characteristics as a function of varying stiffness.
Materials and Methods
Substrate preparation
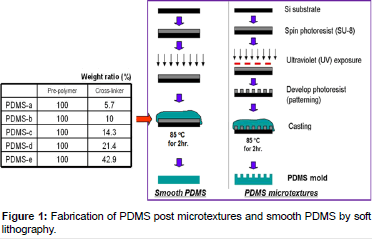
PDMS pre-polymer and cross-linker were combined at various weight ratios designated as PDMS-a, PDMS-b, PDMS-c, PDMS-d, and PDMS-e, corresponding to 5.7, 10.0, 14.3, 21.4, and 42.9 wt. % crosslinker, respectively [8]. Extra cross-linkers on PDMS-d and PDMS-e were leached by ethanol for overnight before call culture experiment [18]. On previous studies, the chemical immersions did not alter the structure of PDMS microtextures, nor weight [8,18].
The PDMS microtextures were manufactured by the soft lithography technique (Figure 1). Briefly, a 6 μm thick layer of SU-8 2010 photoresist was coated on top of a silicon wafer. By using UV photolithography, the 10 μm diameter texture pattern was transferred from a photomask onto the photoresist, and then developed and cured at 120°C. PDMS Sylgard®184 (Dow Corning Corp., Midland, MI) pre-polymer and cross-linker mixtures with various weight ratios were poured on top of the patterned master and cured at 85°C for 2 h. Unpatterned (smooth) PDMS substrates were served as the control surfaces for cell growth experiments, and also used to determine elastic modulus values, which represented stiffness of the various PDMS formulations.
Elastic modulus of PDMS
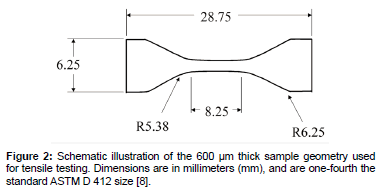
Stiffness of a polymer refers to the resistance of the viscoelastic material to deformation by an applied force [2]. Elastic modulus is directly related to stiffness; therefore, the terms stiffness and elastic modulus are used interchangeably [2,3]. The elastic modulus of the PDMS substrates was determined using a tensile test method using an MTS Alliance™ RT/5 material testing system (MTS Corp., Oak Ridge, TN) [2]. Testing was carried out according to the ASTM D 412 standard for rubber and thermoplastic elastomers with the modification that the dumbbell-shaped test specimens were made one-fourth the standard size [8]. Figure 2 presents a schematic illustration of the sample geometry prior to testing. The design of the custom grips was selected because it allows for maximum contact surface area with the specimen, while reducing the stress concentration on the specimen near the edges of the grip [8]. We have used 3 samples of each type of PDMS for mechanical testing. Ethanol sterilization did not have significant impact on stiffness for all the tested PDMS samples [8].
Cell culture
As described by Muschler et al. [16] bone marrow aspirates were harvested from the anterior iliac crest with informed consent from four patients immediately prior to elective orthopedic procedures. Briefly, 2 mL samples of bone marrow were aspirated from the anterior iliac crest into 1 mL of saline containing 1000 units of heparin (Vector, Burlingame, CA). The heparinized marrow sample was suspended into 20 mL of heparinized carrier media (α-minimal essential medium (α-MEM)+2 units/mL of Na-heparin; Gibco, Grand Island, NY) and centrifuged at 1500 rpm (400 X) for 10 min. The buffy coat was collected, resuspended in 20 mL of 0.3% bovine serum albumin-MEM (Gibco), and the number of nucleated cells was counted. The PDMS substrates were sterilized for 30 min with 70% ethanol. Cells were then plated on Day 0 at a seeding concentration of 1×10⁶ cells per well and were cultured for 10 and 30 days under conditions promoting osteogenic differentiation [17]. Cell characteristics on PDMS substrates were investigated using scanning electron microscopy (SEM), PicoGreen DNA quantification, fluorescent stains, and real time reverse transcript - polymerase chain reaction (real time RT-PCR).In this study, the PicoGreen DNA quantification and the real time RT-PCR were repeated 3 times.
Cell culture analyses
Scanning electron microscopy (SEM): After the cells were cultivated for 30 days, the media was removed and the plated substrates were placed in a solution containing 2% glutaraldehyde (Electron Microscopy Sciences, Fort Washington, PA), 3% sucrose (Sigma-Aldrich Co., Irvine, UK) and 0.1 M of PBS at 4°C and pH 7.4. After 1 h, the substrates were rinsed twice with PBS for 30 min at 4°C and washed with distilled water for 5 min. Dehydration was achieved by placing the plated substrates in 50% ethanol for 15 min while increasing the concentration of ethanol to 60, 70, 80, 90 and finally 100%. Dehydrated samples were then mounted on aluminum stubs, sputter-coated with gold-palladium, and examined using SEM.
PicoGreen DNA quantification: The bonded PDMS substrates were cut into separate sections with varying stiffness and resuspended with 50 μL of lysis buffer (1% sodium dodecyl sulfate, 10 mM Ethylenediaminetetraacetic acid (EDTA) and 50 mM Tris-HCl, pH 8.1) to lyse the membranes of adherent CTP progeny. After 60 min, the samples were centrifuged at 14,000 rpm for 5 min and the supernatant was removed for analysis. A 40 μL sample of aqueous supernatant containing DNA was added to 0.96 mL TE buffer (10 mM Tris adjusted to pH 7.0 with HCl, 1 mM EDTA). As per the manufacturer’s instructions (Molecular Probes, Eugene OR), stock PicoGreen reagent was diluted 1:200 in TE buffer and 1 ml of that was added to each DNA containing sample. The tubes were capped, vortexed, and incubated at room temperature in the dark room for 3 min. The fluorescence was measured with a SpectraMax Gemini fluorescence microplate reader (Molecular Devices Co., Sunnyvale, CA) at excitation and emission wavelengths of 480 and 520 nm, respectively. All calibration samples were assayed four times and a fresh calibration curve was generated for each 96 well plate. Baseline fluorescence was determined with a TE blank, the average of which was subtracted from the averaged fluorescence of other samples. Using this analysis, we determined that ~4.5 μg of DNA in 1×10⁶ adherent CTPs [11]. Thus, we assumed that one cell has ~4.5 pg of DNA, and estimated the number of cells for each sample. Because individual donors differed with respect to the initial prevalence of CTPs, the cell count on the substrates was normalized to the control surfaces for each donor within the particular experiment [11]. We performed a calculation to determine that, for ideal projected surface areas, the actual surface area of post microtextures was 1.47 times greater than that of the smooth surfaces [11,13]. Consequently, we divided the total cell number (estimated via DNA quantification) from the post microtextures by 1.47 to enable a meaningful comparison with the cell number from smooth surfaces.
DAPI and alkaline phosphates (AP) stain: Cell nuclei were stained with 6-diamidino-2-phenylindole dihydrochloride hydrate (DAPI). Paraformaldehyde (4%) - fixed cells were rinsed three times with phosphate buffered saline (PBS), and then a 10 μL drop of DAPIcontaining Vecta shield mounting media (Vector Labs, Burlingame, CA) was placed on the scaffolds.
After DAPI staining, the same samples were again stained in situ for AP, using the Vector Red working solution (5 ml of 100 mM Tris-HCl adding 2 drops of Reagent 1, 2 and 3, Vector Labs) for 30 min at room temperature in the dark, and then washed in distilled water. The positively stained cells with AP activity appeared red when viewed under a fluorescent microscope (Olympus BX50F, Olympus Optical Co., Japan).
Osteocalcin (OC) immunohistochemistry: The cells were rinsed with PBS and fixed in 1% hydrogen peroxide for 10 min at room temperature followed by incubation in 1.5% blocking serum (rabbit ABC staining system, Santa Cruz Biotech, CA) 60 min to block nonspecific binding. OC primary antibody (Santa Cruz Biotech) was diluted 1/100 in PBS and incubated with cells overnight at 4°C. After washing cells three times in PBS, they were incubated for 1 h with Biotinylated secondary antibody, 30 min with AB enzyme reagent, and 10 min with Peroxidase substrate (ABC staining system). Between each step, cells were rinsed three times with PBS. Secretion of OC was confirmed visually (brown color) under a phase contrast microscope.
Real time reverse transcript – polymerase chain reaction (Real time RT-PCR): The expression of osteoblast specific genes, such as AP and OC, were detected by real time RT-PCR. Total RNA was isolated using an RNeasy kit (Qiagen Inc., Valencia, CA) and reverse transcribed by conventional protocols with a Sensiscript Reverse Transcription kit (Qiagen Inc). The expression of the AP, OC, and glyceraldehyde-3- phosphate dehydrogenase (GAPDH) was quantified using real time RT-PCR analysis with a Power SYBR® Green PCR Master Mix kit (Applied Biosystems, Foster City, CA). GAPDH is an enzyme utilized in cellular metabolism and is assumed to be expressed at the same level in most cells; therefore, gene expression of GAPDH was used as an internal control to normalize out any differences in the amount of total isolated RNA. Primer sequences are presented in Table 1. Real Time quantitative PCR was performed on a 7500 Real Time PCR system (Applied Biosystems). Data analysis was carried out using the 7500 System Sequence Detection software (Applied Biosystems) [19].
| Gene | Primer Sequences |
|---|---|
| Alkaline Phosphatase | 5’ ACA GAT GCC AAC TTC CCA CAC G 3’ 3’ GAG GCA CCT TGT AAG ACC TAG AC 5’ |
| Osteocalcin | 5’ AGG TGC AGC CTT TGT GTC CAA G 3’ 3’ GGG AAG AAA GGA GAA GGG GAA C 5’ |
| GAPDH | 5’ GGG CTG CTT TTS SCT CTG GT 3’ 3’ TGG CAG GTT TTT CTA GAC GG 5’ |
Table 1: List of primers.
Statistical analysis
The mean and standard deviation values were calculated using the data of all groups. All data was subjected to analysis of variance (ANOVA) and Tukey testing where appropriate (SPSS Version 10.0., SPSS Inc., and Chicago, IL). Significance levels were set at p<0.05.
Results
Elastic modulus of PDMS substrate
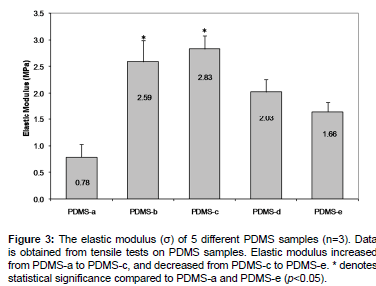
The elastic modulus (stiffness) of five PDMS formulations was evaluated using the tensile test method [2]. The elastic modulus was calculated from the slope of the plot of strain versus stress [2,8]. Elastic modulus increased from 0.78 ± 0.25 MPa (PDMS-a) to 2.83 ± 0.26 MPa (PDMS-c), and decreased down to 1.66 ± 0.18 MPa (PDMS-e) (Figure 3). Even though the manufacturer’s recommended optimum formulation for higher elastic modulus compared to other PDMS formulations is PDMS-b (2.59 MPa) [2], our results showed that the highest elastic moduluswas for PDMS-c (2.83MPa).
For the rest of analyses in this study, we are going to present data from PDMS-a, PDMS-b, and PDMS-e since their stiffness values were significantly different, and therefore, likely provide meaningful insights on CTP growth characteristics.
Cell morphology and proliferation
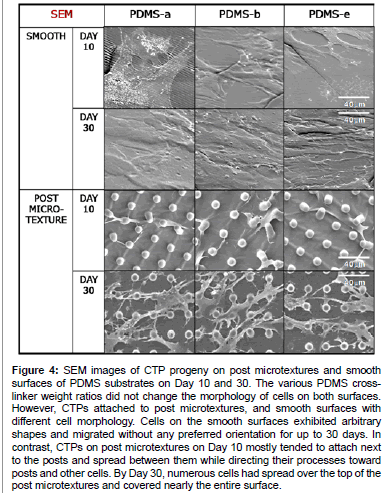
The various PDMS cross-linker weight ratios did not appear to influence the morphology of cells on post or smooth surfaces. However, the morphology of cells grown on the post microtextures was visually different from those on the corresponding smooth surfaces (Figure 4). Cells on the smooth surfaces exhibited arbitrary shapes and migrated without any preferred orientation for up to 30 days. In contrast, CTPs on post microtextures on Day 10 mostly tended to attach next to the posts and spread between them while directing their processes toward posts and other cells. By Day 30, numerous cells had spread over the top of the post microtextures and covered nearly the entire surface.
Figure 4: SEM images of CTP progeny on post microtextures and smooth surfaces of PDMS substrates on Day 10 and 30. The various PDMS crosslinker weight ratios did not change the morphology of cells on both surfaces. However, CTPs attached to post microtextures, and smooth surfaces with different cell morphology. Cells on the smooth surfaces exhibited arbitrary shapes and migrated without any preferred orientation for up to 30 days. In contrast, CTPs on post microtextures on Day 10 mostly tended to attach next to the posts and spread between them while directing their processes toward posts and other cells. By Day 30, numerous cells had spread over the top of the post microtextures and covered nearly the entire surface.
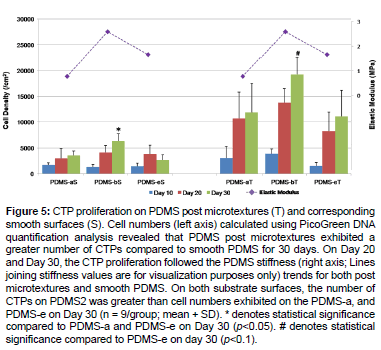
Cell numbers calculated using PicoGreen DNA quantification analysis also revealed that the number of CTPs on PDMS-b was greater than cell numbers exhibited on the PDMS-a, and PDMS-eon both substrate surfaces (Figure 5). In particular, the CTP proliferation followed the PDMS stiffness trends of post microtextures and smooth PDMS, on Day 20 and Day 30. PDMS post microtextures exhibited a greater number of CTPs compared to smooth PDMS (p<0.05) at 30 days. These results demonstrated that the combination effects of surface microtextures and stiffness of PDMS substrates accelerate cell growth.
Figure 5: CTP proliferation on PDMS post microtextures (T) and corresponding smooth surfaces (S). Cell numbers (left axis) calculated using PicoGreen DNA quantification analysis revealed that PDMS post microtextures exhibited a greater number of CTPs compared to smooth PDMS for 30 days. On Day 20 and Day 30, the CTP proliferation followed the PDMS stiffness (right axis; Lines joining stiffness values are for visualization purposes only) trends for both post microtextures and smooth PDMS. On both substrate surfaces, the number of CTPs on PDMS2 was greater than cell numbers exhibited on the PDMS-a, and PDMS-e on Day 30 (n = 9/group; mean + SD). * denotes statistical significance compared to PDMS-a and PDMS-e on Day 30 (p<0.05). # denotes statistical significance compared to PDMS-e on day 30 (p<0.1).
Osteogenic differentiation
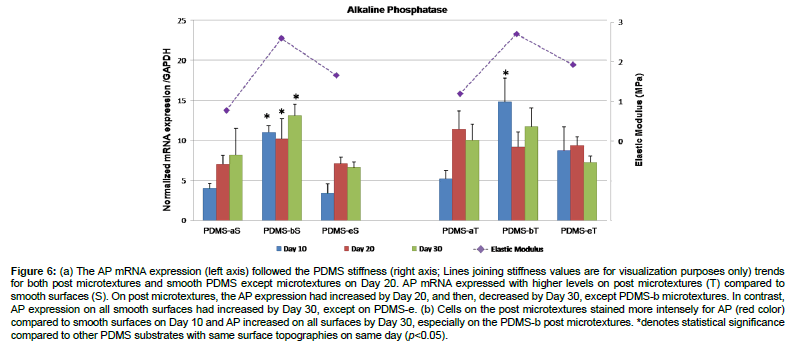
The results of real time RT-PCR revealed that AP mRNA expression was higher on post microtextures compared to smooth surfaces for 30 days except PMDS-b (Figure 6a). On post microtextures, the mRNA expression of AP had increased by Day 20, and then decreased by Day 30, except PDMS-b, which decreased from Day 10 to Day 20, and increased again by Day 30. In contrast, AP expression on all smooth surfaces had increased by Day 30, except on PDMS-e. The cells on PDMS-b showed the highest levels of AP expression on Day 10 (p< 0.05). Cells on all substrates stained positive for AP, which is used as an early marker of osteoblastic differentiation (Figure 6b). Cells on the post microtextures stained more intensely for AP compared to smooth substrates on Day 10, and AP increased on all substrates by Day 30, especially on the PDMS-b post microtextures.
Figure 6: (a) The AP mRNA expression (left axis) followed the PDMS stiffness (right axis; Lines joining stiffness values are for visualization purposes only) trends for both post microtextures and smooth PDMS except microtextures on Day 20. AP mRNA expressed with higher levels on post microtextures (T) compared to smooth surfaces (S). On post microtextures, the AP expression had increased by Day 20, and then, decreased by Day 30, except PDMS-b microtextures. In contrast, AP expression on all smooth surfaces had increased by Day 30, except on PDMS-e. (b) Cells on the post microtextures stained more intensely for AP (red color) compared to smooth surfaces on Day 10 and AP increased on all surfaces by Day 30, especially on the PDMS-b post microtextures. *denotes statistical significance compared to other PDMS substrates with same surface topographies on same day (p<0.05).
The mRNA expression of OC significantly increased from Day 10 to Day 20 (p<0.05) on both substrates, with consistently greater expression for 30 days (Figure 7a). However, there was no significant difference in OC mRNA expression between smooth substrates and post microtextures for all days. Regardless surface topographies, cells on PDMS-b expressed more OC compared to PDMS-a and PDMS-e on Day 30. The highest level of OC expression was on PDMS-b smooth surface and post microtextures on Day 30. These results indicate that OC expression had started by Day 10 and increased immensely over time. OC IHC staining showed minimal OC intensity on the all substrates on Day 10, but greatly increased by Day 30 (Figure 7b). Furthermore, the intensity of the OC IHC stain on PDMS-b post microtextures was much greater compared to the other substrates.
Figure 7: (a) The mRNA expression of OC significantly increased from Day 10 to Day 20 on both substrates, with consistently greater expression for 30 days. The OC mRNA expression (left axis) followed the PDMS stiffness (right axis; Lines joining stiffness values are for visualization purposes only) trends for both post microtextures and smooth PDMS on Day 30. However, there was no significant difference in OC mRNA expression between smooth substrates and post microtextures for all days. Regardless surface topographies, cells on PDMS-b expressed more OC compared to PDMS-a and PDMS-e on Day 30. The highest level of OC expression was on PDMS-b smooth surface and post microtextures on Day 30. These results indicate that OC expression had started by Day 10 and increased immensely over time. (b) Phase contrast images show OC immunohistochemistry stain (brown color) and the intensity of this stain on PDMS-b post microtextures on Day 30 greatly increased compared to the other substrates. * denotes statistical significance compared to other PDMS substrates on day 30 and # denote statistical significance each other (p<0.05).
Discussion
It is important to keep in mind that material composition, structure, and processing, all affect the material properties; therefore, alterations in any of these factors could lead to changes in more than one cellular behavior. We have examined the combinatorial effects of topography and stiffness cues on CTP growth. PDMS substrates with variable stiffness and specially designed surface topographies were developed to systematically investigate the combined effects on human bone marrow-derived CTP growth behavior. These results highlight that surface post microtextures with a pre-defined micropost size (10 μm) and higher stiffness levels of PDMS substrates would allow for the acceleration of CTP progeny growth and associated osteogenic indicators such AP expression, as well as OC secretion.
Different PDMS proportions were previously formulated to investigate possible alterations in PDMS properties due to the deviation from the manufacturer’s recommended 10:1 weight ratio (pre-polymer: crosslinker), which corresponds to our PDMS-b notation [2,8]. The PDMS-b formulation was reported to be resistant to the majority of chemicals tested, and exhibited higher elastic modulus compared to other PDMS formulations [2]. However, in our case PDMS-c exhibited the highest Young’s modulus. The variations in the processing conditions, such as time and temperature of curing, and the ratio of base to cross-linker, of PDMS may result in changes in the physical properties of PDMS, such as surface chemistry and stiffness of the substrate [20]. In this study, we presented cell growth characteristics from PDMS-a, PDMS-b, and PDMS-e since their stiffness were significantly different, and therefore, provide some meaningful insights on CTP growth characteristics. (We note, however, that data on cell growth characteristics on PDMS-c and PDMS-d were similar to PDMS-b, and their osteogenic behavior was better pronounced than on PDMS-a and PDMS-e).
Surface stiffness of PDMS can be effectively changed by substrate material used [13,21]. In this study, surface post microtopography of equal size and density, but different PDMS formulation ratio, was used to vary the surface mechanical environment and directly modify the substrate stiffness, and consequently, cell behavior. Results from this study appear consistent with findings from recent studies by Rowlands et al. [14] who demonstrated that the rate of mesenchymal stem cell proliferation was proportional to the substrate stiffness. In another report, Wang et al. observed up to a 2-fold increase in proliferation when the stiffness of substrates was increased [22]. Yim et al. [23] also observed that surface topography or the mechanical properties of the substrate can have a significant effect on interactions between stem cells and their ECM, influencing focal adhesion formation, the organization of the cytoskeleton, and consequent cell growth.
Varying geometry and arrangement of microposts provide an effective technique for engineering the mechanical properties (e.g. stiffness) of discrete, microscale substrate features. It is known that changing micropost height effectively varies surface stiffness without altering the bulk mechanical properties or the surface chemistry of the material used to fabricate the substrate [13,21,24-27]. In line with our previous data [13], Tan et al. and Sochol et al. [21,26] demonstrated that PDMS microposts of different dimensions, such as diameter and height, expressed a range of stiffness values. Because the stiffness of microposts varies as the inverse cube of their height, decreasing the height by half results in a local change in effective stiffness by 8-fold [13]. Theoretically, shorter microposts result in higher effective stiffness, which in turn, allows for the acceleration of cell growth [13, 21,28]. However, decreasing post heights below the optimal value (lower height than cell size, and more specifically, 5 μm high microposts in our previous study [13]), causes fewer adhesions with ECM, and subsequent decreased cell growth behavior [13,21,24-28].
The mechanisms dealing with how cells sense and change their behavior in response to combinations of different types of structural factors, such as substrate stiffness and surface topography, remain unclear. One mechanism is attributed to integrin signaling through focal adhesion complexes [23,29]. The phosphorylation of focal adhesion kinase can be high on stiffer substrates, resulting in growth factor activation of extracellular signal-regulated kinase to promote proliferation and differentiation. Even though the clarification of how cells respond to substrate stiffness via a mechanotransduction cascade is still a much-debated topic, the fact that CTP proliferation and osteogenic differentiation can be accelerated by certain levels of PDMS stiffness suggests that cells can respond to changes in substrate stiffness in a physiologically relevant manner. To clarify the mechanisms, further investigation is needed to elucidate all of the possible factors and establish definitive mechanistic links between cell–surface interactions and cell differentiation.
Another important point to consider is protein affinity for and adhesion to the PDMS surface. Cellular responses are generally attributed to the surface-adsorbed ECM, which comes from the surrounding medium and can also be produced by cells themselves [11]. Varying geometry of microposts changes effective surface area and corresponding protein adsorption area. In addition, it is likely that the cells are adhering to the protein layer on the PDMS so perhaps the “stiffness” that the cells experience is related to how “bound” or “stuck” the proteins are to the surface. This study has shown that the increased number of CTPs on post microtextures resulted in increasing ECM production and subsequent osteoblast-specific gene expression by cells on post microtextures. In the present study, interestingly, there was no significant difference in OC mRNA expression between smooth substrates and post microtextures (Figure 7a), while AP expressed greater on post microtextures than smooth surfaces on early days (Figure 6a). Regardless surface topographies, cells on PDMS-b consistently expressed more osteocalc in compared on other substrates on day 30. These results collectively indicate that CTP proliferation and early osteogenic differentiation are more likely to be affected by surface microtextures, while substrate stiffness is more likely to influence the late osteogenic differentiation.
In addition, it is interesting that increased early ostegenic differentiation observed when culturing on microposts did not translate to increased late osteogenic differentiation. The microposts benefit is diminished at the late differentiation stage where there were no difference observed between smooth and microposts surfaces. It is possible that if late differentiation marker is the end goal, topographical features may not play as an important of role. To clarify and confirm the results, future work could encompass the testing multiple assays for gene and protein expression to establish definitive mechanistic links between cell–surface interactions and cell differentiation.
It is known that substrate stiffness can direct mesenchymal stem cells to differentiate into specific lineages: a soft substrate induces a neurogenic phenotype, while increasingly stiffer substrates induce myogenic and osteogenic phenotypes accordingly, because it is easier for the cells to develop a higher cytoskeletal tension on a stiffer substrate [23]. Taken together, the observations from microtopography-induced and stiffness-directed differentiation suggest that physical interactions between the cells and the extracellular environment, either in the form of topography or stiffness, or the combination thereof, can modulate cell function and stem cell growth behavior.
Conclusions
In bone tissue engineering applications, the incorporation of micro-scale surface topography and optimal stiffness levels at the cell–substrate interface might provide an attractive approach to enhancing specific cellular responses without destabilizing the delicate biochemical environment. For the first time, this work provides a comparison of the combined influences of varying substrate stiffness and precise topographical features on bone marrow derived human CTP behavior. Although these are preliminary results that must be interpreted with care, it has been shown that culturing CTPs under osteogenic conditions on stiffer post microtextures enhances proliferation and osteogenic differentiation when compared to cells on more compliant smooth surfaces. This study demonstrates a simple, yet powerful in vitro model, based on varying substrate stiffness with the precise and reproducible patterning capabilities of microfabrication techniques, in which to explore the relationship between mechanical and topographical features of bone tissue engineering scaffolds and the likely response of human adult stem cells and progenitor cells in the setting of bone repair in vivo.
Author Disclosure Statement
The authors who have taken part in this study declared that they do not have anything to disclose regarding funding from industry or conflict of interest with respect to this manuscript.
References
- Fleming JE, Cornell CN, Muschler GF (2000) Bone Cells and Matrices in Orthopedic Tissue Engineering Orthop. Clin North Am 31: 357-374.
- Brown XQ, Okawa K, Wong JY (2005) Evaluation of polydimethylsiloxane scaffolds with physiologically-relevant elastic moduli: interplay of substrate mechanics and surface chemistry effects on vascular smooth muscle cell response. Biomaterials 26: 3123-3129.
- Artmann GM, Chien S (2008) Bioengineering in cell and tissue research. Springer Newyork, NY, USA.
- Raghavan S, Chen CS (2004) Micropatterned Environments in Cell Biology. Adv Mater 16: 1303-1313.
- Chen CS, Jiang X, Whitesides G (2005) Microengineering the Environment of Mammalian Cells in Culture MRS. Bulletin 30: 194-201.
- Chen CS, Tan J, Tien J (2004) Mechanotransduction at Cell-Matrix and Cell-Cell Contacts. Annu Rev Biomed Eng 6: 275-302.
- Gray DS, Tien J, Chen CS (2003) Repositioning of cells by mechanotaxis on surfaces with micropatterned Young's modulus. J Biomed Mater Res 66A: 605-614.
- Mata A, Fleischman AJ, Roy S (2005) Characterization of Polydimethylsiloxane (PDMS) Properties for Biomedical Micro/Nanosystems Biomed. Microdevices 7: 281-293.
- http://www.engin.umich.edu/class/bme456/bonefunction/bonefunction.htm
- Mata A, Kim EJ, Boehm CA, Fleischman AJ, Muschler GF. et al. (2009) A three-dimensional scaffold with precise micro-architecture and surface micro-textures. Biomaterials 30: 4610-4617.
- Kim EJ, Boehm CA, Mata A, Fleischman AJ, Muschler GF, et al. (2009) Post microtextures accelerate cell proliferation and osteogenesis. Acta Biomater 6: 160-169.
- Mata A, Boehm C, Fleischman AJ, Muschler G, Roy S (2002) Growth of connective tissue progenitor cells on microtextured polydimethylsiloxane surfaces. J Biomed Mater Res 62: 499-506.
- Kim EJ, Fleischman AJ, Muschler GF, Roy S (2013) Response of bone marrow derived connective tissue progenitor cell morphology and proliferation on geometrically modulated microtextured substrates. Biomed Microdev 15: 385-396.
- Rowlands AS, George PA, Cooper-White JJ (2008) Directing osteogenic and myogenic differentiation of MSCs: interplay of stiffness and adhesive ligand presentation. Am J Physiol Cell Physiol 295: C1037-C1044.
- Tzvetkova-Chevolleau T, Stéphanou A, Fuard D, Ohayon J, Schiavone P, et al. (2008) The motility of normal and cancer cells in response to the combined influence of the substrate rigidity and anisotropic microstructure. Biomaterials 29: 1541-1551.
- Muschler GF, Midura RJ, Nakamoto C (2003) Practical Modeling Concepts for Connective Tissue Stem Cell and Progenitor Compartment Kinetics. J Biomed Biotechnol 3: 170-193.
- Kim EJ, Boehm CA, Fleischman AJ, Muschler GF, Kostov YV, et al. (2009) Modulating human connective tissue progenitor cell behavior on cellulose acetate scaffolds by surface microtextures. J Biomed Mater Res 90A: 1198-1205.
- Regehr KJ, Domenech M, Koepsel JT, Carver KC, Ellison-Zelski SJ, et al. (2009) Biological implications of polydimethylsiloxane-based microfluidic cell culture. Lab Chip 9: 2132-2139.
- Cool SM, Nurcombe V (2005) Substrate Induction of Osteogenesis from Marrow-Derived Mesenchymal Precursors. Stem Cells Dev 14: 632-642.
- Wang PY, Tsai W, Voelcker NH (2012) Screening of rat mesenchymal stem cell behaviour on polydimethylsiloxane stiffness gradients. Acta Biomaterialia 8: 519-530.
- Tan JL, Tien J, Pirone DM, Gray DS, Bhadriraju K, et al. (2003), Cells lying on a bed of microneedles: An approach to isolate mechanical force. Proc Nat Acad Sci USA 100: 1484-1489.
- Wang H, Dembo M, Wang Y (2000) Substrate flexibility regulates growth and apoptosis of normal but not transformed cells. Am J Physiol Cell Physiol 279: C1345-C1350.
- Yim EK, Darling EM, Kulangara K, Guilak F, Leong KW (2010) Nanotopography-induced changes in focal adhesions, cytoskeletal organization, and mechanical properties of human mesenchymal stem cells. Biomaterials 31: 1299-1306.
- Schulte VA, Diez M, Hu Y, Möller M, Lensen M (2010) Combined Influence of Substrate Stiffness and Surface Topography on the Antiadhesive Properties of Acr-sP(EO-stat-PO) Hydrogels. Biomacromolecules 11: 3375-3383.
- McBeath R, Pirone D, Nelson C, Bhadriraju K, Chen CS (2004) Cell shape, cytoskeletal tension, and RhoA regulate stem cell lineage commitment. Dev Cell 6: 483-495.
- Sochol RD, Higa AT, Janairo R, Li S, Lin L (2011) Unidirectional mechanical cellular stimuli via micropost array gradients. Soft Matter 7: 4606-4609.
- Turner AM, Dowell N, Turner SW, Kam L, Isaacson M, et al. (2000) Attachment of astroglial cells to microfabricated pillar arrays of different geometries. J Biomed Mater Res 51: 430-441.
- Schrader J, Gordon-Walker T, Aucott RL, Deemter MV, Quaas A, et al. (2011) Matrix stiffness modulates proliferation, chemotherapeutic response, and dormancy in hepatocellular carcinoma cells. Hepatology 53: 1192-1205.
- Schwartz MA, Ginsberg MH (2002) Networks and crosstalk: integrin signalling spreads. Nat Cell Biol 4: E65-E68.
Relevant Topics
Recommended Journals
Article Tools
Article Usage
- Total views: 13661
- [From(publication date):
February-2014 - Apr 06, 2025] - Breakdown by view type
- HTML page views : 9060
- PDF downloads : 4601
