Research Article Open Access
Bioremediation Rate of Total Petroleum Hydrocarbons from ContaminatedWater by Pseudomonas aeruginosa Case Study: Lake Albert, Uganda
| Kiraye M*, John W and Gabriel K | |
| Department of Chemistry, Makerere University, Kampala, Uganda | |
| *Corresponding Author : | Kiraye M Department of Chemistry Makerere University, Kampala, Uganda E-mail: mickiraye@gmail.com |
| Received January 27, 2016; Accepted February 18, 2016; Published February 22, 2016 | |
| Citation: Kiraye M, John W, Gabriel K (2016) Bioremediation Rate of Total Petroleum Hydrocarbons from Contaminated Water by Pseudomonas aeruginosa Case Study: Lake Albert, Uganda. J Bioremed Biodeg 7:335. doi: 10.4172/2155-6199.1000335 | |
| Copyright: © 2016 Kiraye M, et al. This is an open-a ccess article distributed under the terms of the Creative Commons Attribution License, which permits unrestricted use, distribution, and reproduction in any medium, provided the original author and source are credited. | |
Visit for more related articles at Journal of Bioremediation & Biodegradation
Abstract
Uganda is currently exploiting petroleum products. This is mainly around the fresh water bodies. However, these water bodies are habitants for several aquatic organisms and also the main drinking water sources. Despite the fact that they are known for several uses both ecological and economical, they are likely to be seriously polluted by crude oil petroleum hydrocarbons (PHs). Therefore they will require to be treated by ecologically friendly methods. Pseudomonas aeruginosa naturally habits Ugandan water bodies and it’s known for no health hazards to human (after boiling the water) and to aquatic organisms. Therefore multiplying its numbers in aquatic environments has no health implications yet it’s known for degrading PHs. Thus the current study aimed at determining the rate at which Pseudomonas aeruginosa can remediate PHs from water of Lake Albert. Method: Water from Lake Albert was collected to laboratory, contaminated with 10% m/v PHs (100g/L). This was then inoculated with Pseudomonas aeruginosa (turbidity of 0.04 absorbance at a wave length of 600 nm) in a 1cm cuvette containing about 3.0×10⁷ colony-forming unit (CFU)/mL. The waters were left at room temperatures to replicate the temperature of the natural water body in Uganda. Results: Results showed that the initial rate, Rbioi was 32.3 g/liter per day for n-hexane soluble PHs. Also, the maximum amount removed when the rate reduced to zero was 89.3/liter. The bioremediation process followed second order kinetics with half-life of 3.9 days. This means the original amount will reduce to half the original amount after 3.9 days (about 93.6 hrs). Pseudomonas aeruginosa significantly (p=0.03) (p<0.05) remediates PHs from Lake Albert water with maximum removal rate between day 1 and day 3. However, physico-chemical factors for example temperature, pH were not investigated in this current study.
| Keywords |
| Bioremediation rate; Lake Albert; Petroleum hydrocarbons; Pseudomonas aeruginosa |
| Introduction |
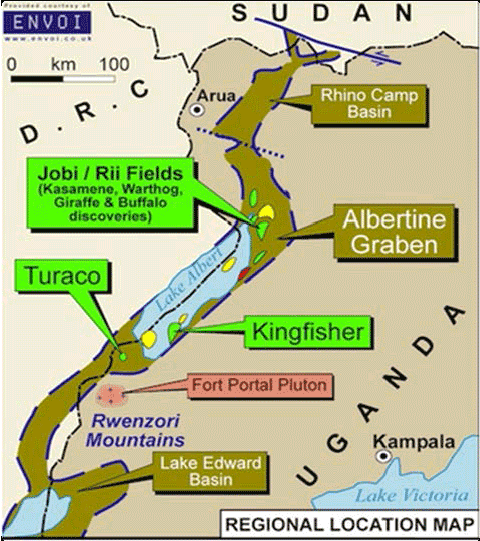
| Uganda is presently trying to explore and engage in the exploitation of petroleum products. This is largely around the fresh water bodies in the Albertine Graben. On the other hand, the water bodies in Albertine graben are habitants for numerous water organisms and also the focal drinking water point sources. In spite of the fact that Lake Albert waters are known for quite a lot of uses both ecological and economical, they are expected to be extremely polluted by crude oil petroleum hydrocarbons (PHs). Consequently they will need to be dealt with by ecologically friendly methods. Bioremediation is one of such ways of which microorganisms of the species pseudomonas aeruginosa were used to biodegrade unsafe organic pollutants to ecologically safer toxic doses [1]. These microorganisms embrace other bacteria and fungi like yeast and moulds [2]. These microorganisms predominantly have been considered petroleum hydrocarbon biodegrading mediators living in the environment freely. |
| The PHs is progressively becoming water contaminants of great worry within the environment [3]. They have the potential to dissolve in lipids within vulnerable water organisms meaning they can bio accumulate in the food chain and can be delivered to other trophic levels of the food chain [4]. |
| Furthermore, Spills of petroleum Hydrocarbons occurring on water usually are far more harmful than the spill on land [5]. The oil exploration industry in Uganda creates susceptibility of the country to petroleum related ecological encounters as well as spillage. Regrettably, there are no well-studied ecologically friendly means for bioremediation of petroleum hydrocarbons spillage in aquatic environment within the country. Oil exploration industry currently is in Buliisa District whose general population obtains water from point water sources that can be vulnerable to PHs contamination in case of crude oil spills [6]. |
| The study aimed at exploring the rate at which Pseudomonas aeruginosa can reduce petroleum hydrocarbons spillage that may occur on Lake Albert water in future. |
| Materials and Methods |
| Study area and sample collection |
| Samples of water for this work were collected from Lake Albert at a point (01°32.032N, 03°57.958E) called Kaiso, selected because the oil exploration upstream facility is in the vicinity. Lake Albert is located in western Uganda in the Albertine region, Two (2) liters of water from Lake Albert was collected in sterile bottles. These were then placed on Ice in cooler boxes and transported to Makerere University Chemistry pesticide laboratory. The bottles were then refrigerated for 10 hours. |
| Contaminated sample preparation |
| The PHs was purchased from oil and gas market in Kampala (Uganda). The experimental bottles along with the control were contaminated with the PHs up to 10%m/v (100 g/L). The control sample of Lake Albert water was autoclaved before being contaminated with PHs. [Both the control and the natural (experimental) water were contaminated with 10% m/v PHs (100g/L)]. The experimental bottle was then inoculated with Pseudomonas aeruginosa (turbidity of 0.04 absorbance at 600 nm) (3.0×10⁷ colony-forming units (CFU)/ mL) [7]. Both control and the experimental bottles were left at room temperatures to replicate the temperature of the natural water body in Uganda. |
| Culturing |
| Growth of Pseudomonas aeruginosa was done in a sterile nutrient broth (100 ml) incubated at 37°C for a period of 1.5 hours that was expected for the log phase of these species of bacteria [7]. |
| Bioremediation procedure |
| Aliquot volume of water contaminated with petroleum hydrocarbon (10 mL), was introduced in a 250 ml flask in which there was nutrient broth (100 mL). And aliquot of a starter culture (100 μl) containing Pseudomonas aeruginosa of turbidity absorbance of 0.04 at 600 nm was added. The unresolved complex mixture was shaken at a speed of 180 r/min for 24 hours at room temperature using a shaker model THZ- 82. The activity of bacterial was momentary halted by decreasing the temperature of the resulting mixture to about 2°C to 8°C after every 24 hours. |
| Petroleum hydrocarbons extraction |
| The Petroleum hydrocarbons extraction from water was done using n-hexane following a method styled by A UNEP/IOC/IAEA 1992 method for PHs. Unresolved complex mixtures approach for Gas Chromatography-Mass Spectroscopy quantification was used for determination of amount removed. |
| Instrumentation analysis |
| An Agilent 6890N gas chromatograph (GC), combined with Mass spectroscopy detector (5975) was set. A sample of 1.0 μL aliquot of the extract was injected using the injector port held at150°C and run in split mode. Helium carrier was used to sense PHs at a split ratio of 1:20. The following temperature-programme was used: Preliminary temperature at 95°C for 1 min followed by 95-190°C at 20°C/min then190-250°C at 15°C/min and 250-300°C at 25°C/min for 3.0 min, resulting in a total run time of 18.5 min. The detector temperature was held at 150°C. Software, Agilent Chemstation was used for acquisition of the chromatogram data calculations using unresolved complex mixtures approach. The entire peaks were integrated to determine the total area counts for every sections of the chromatogram before and after bioremediation (Table 1). Dividing the difference in total area counts before and after bioremediation by the total area before bioremediation gave the biodegrading amount removed [8]. Biodegrading amount removed was used to represent the concentration of the total petroleum hydrocarbon used up during bioremediation activity in grams per 10ml of PHs spreading on Lake Albert water for every 24 hours for 7 days. |
| A software, Minitab17 [9] statistics package developed at the Pennsylvania State University by researchers was used to analyze results. From the analyzed results, various slopes of the tangents that signify bioremediation rate (Rbio) in grams per day at 0.60, 1.20, 2.10, 3.00, 3.30, 4.20, 4.80 and 5.40 days of the remediation process along the curve were determine and the following results got as in Table 2. |
| Results and Discussions |
| Amount removed and left by Pseudomonas aeruginosa (m1)(g/L) |
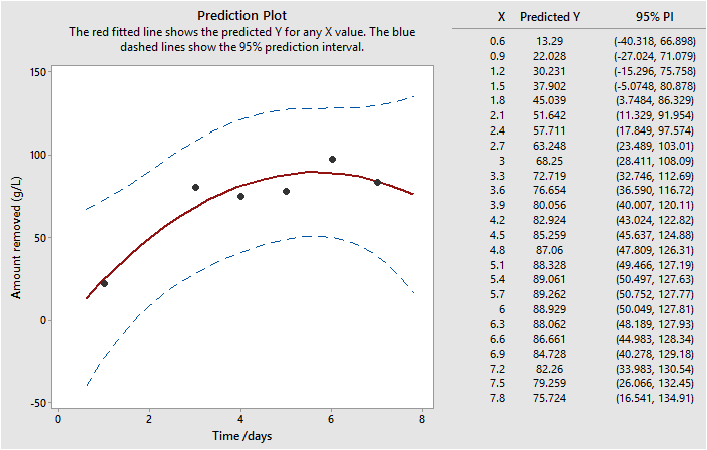
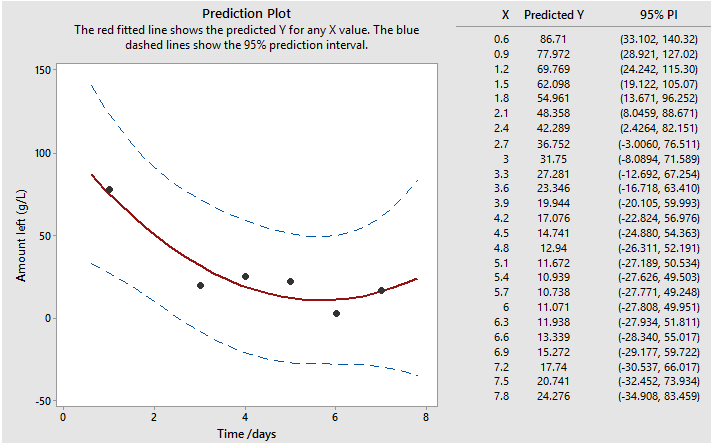
| This work is the first bioremediation study on Lake Albert fresh water. The concentration of the PHs removed from Lake Albert contaminated samples by Pseudomonas aeruginosa, are in Table 1. The concentrations of what was left were also recorded. The highest amount removes was registered on day six, the point at which the rate of bioremediation was almost zero. A similar work [10] reported the maximum removed amount in this period of time. The observation from Table 1 showed that some PHs was also registered in the control experiment even though Pseudomonas aeruginosa were not present here. This suggested that, Lake Albert perhaps contained some PHs at the time when the water sample was picked. This agrees with the historic quotations that oil in Lake Albert (Uganda) was discovered following the seepage observations [11]. |
| In Figure 1, the variation of amount of PHs removed and amount left in grams per litre with time in days were followed to generate Figure 2 that showed that bioremediation reaction followed second order though [12] suggested a first order kinetics, Figure 2 demonstrated this. |
| Bioremediation rate and its half-life |
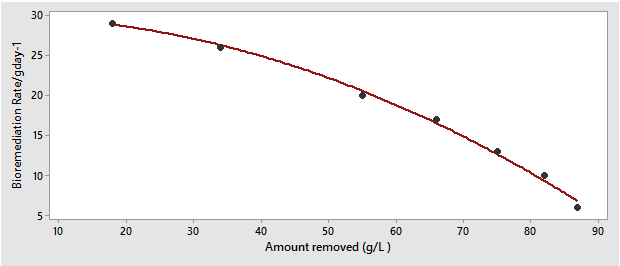
| To make the relationship between bioremediation rate in gram per day versus amount removed squared stand out, a graph in Figure 3 below was drawn that depicted a linear state of connectedness typical of second order reactions [13] of the form Rate= c+(-k)A2 with a second order rate constant,-k, since removal of PHs were followed indicated by a negative sign. The constant, c, put into consideration of other factors that could be involved and a concentration term-A, indicated the amount removed in grams per liter. |
| In (Figure 2a) Regression for Bioremediation Rate/gday-1 vs. (Amount removed)2/g2/L2 |
| The relationship between bioremediation rate and the amount removed by microbes stood out as in Figure 2b indicating an upward curving line that is typical of the second order kinetics [13]. |
| The rate equation for the reaction turned out to be: Rate = 30.31-
(3.3×10⁻³) (Rbio)2 in agreement with second order kinetics of the
form Rate = k(Rbio)2 keeping other factor constant, giving a half-life
(T½) period of |
| Bioremediation rate versus reciprocal of amount of PHs removed |
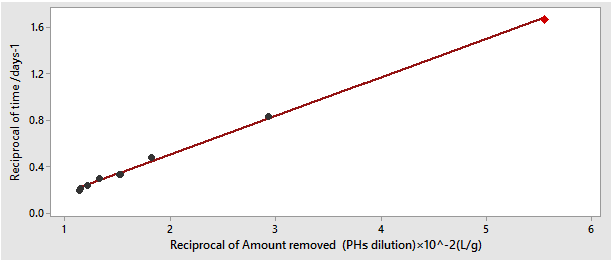
| Figure 4 shows realistically the relationship between bioremediation rate as the reciprocal of time and dilution as the reciprocal of the amount removed reflecting the fashion how Pseudomonas aeruginosa used up PHs, Table 3. |
| As depicted by the graph in Figure 4, it was observed that, bioremediation rate demonstrated direct proportionality with PHs reduction from the water surface (dilution). This is in agreement [14] who asserted that the biodegradation process follows kinetic models, and indeed it was found to follow 2nd order kinetics. To be precise, the rate of removal is proportional to the PHs diluted concentration; this was demonstrated in Figure 4. PHs reduction from the surface of Lake Albert water gets bulky as Bioremediation Rate gets greater and when PHs dilution grows lesser, the Bioremediation Rate grows lesser too. The meaning of this is that as the dilution increases, the removal rate also increases, basically applicable for heavy spills of Petroleum hydrocarbons on Lake Albert water surface that will elicit a heavily greater rate of removal by Pseudomonas aeruginosa of such a spill [15]. The explanation to this trend is done by means of the aspects that act as the source of Bioremediation Rate to surge when there is greater quantity of PHs. In this work, Pseudomonas aeruginosa behavior showed that the PHs were identified as their substrate, denoting that larger quantity of PHs would promote the growth of large population of these microorganism capable of removing the PHs until saturation point is re-reached as shown in Figure 1. |
| Conclusions |
| Pseudomonas aeruginosa remediates Petroleum Hydrocarbons from Lake Albert water significantly (p<0.05) with maximum removal rate between the first day and the third day. However, physico-chemical factors for example temperature, pH were not investigated in this current study. |
References
|
Tables and Figures at a glance
| Table 1 | Table 2 | Table 3 |
Figures at a glance
 |
 |
 |
 |
 |
| Figure 1 | Figure 2a | Figure 2b | Figure 3 | Figure 4 |
Relevant Topics
- Anaerobic Biodegradation
- Biodegradable Balloons
- Biodegradable Confetti
- Biodegradable Diapers
- Biodegradable Plastics
- Biodegradable Sunscreen
- Biodegradation
- Bioremediation Bacteria
- Bioremediation Oil Spills
- Bioremediation Plants
- Bioremediation Products
- Ex Situ Bioremediation
- Heavy Metal Bioremediation
- In Situ Bioremediation
- Mycoremediation
- Non Biodegradable
- Phytoremediation
- Sewage Water Treatment
- Soil Bioremediation
- Types of Upwelling
- Waste Degredation
- Xenobiotics
Recommended Journals
Article Tools
Article Usage
- Total views: 11924
- [From(publication date):
March-2016 - Jul 02, 2025] - Breakdown by view type
- HTML page views : 10810
- PDF downloads : 1114
