Biological Variability of SARS-CoV-2 RT-PCR Nasopharyngeal Swab Test
Received: 17-Dec-2020 / Accepted Date: 24-Dec-2020 / Published Date: 07-Jan-2021 DOI: 10.4172/2332-0877.1000449
Abstract
We studied the variability among viral target Cycle Thresholds (Cts) of SARS-CoV-2 RT-PCR collected with conventional and 3D printed nasopharyngeal swabs from separate nostrils at the same time by the same investigator. There was far greater variation in the viral copy number than could be explained by the amount of material collected, as measured by the Cts of the RNaseP human Internal Control Gene (IC). We conclude that there are underlying biological differences in the distribution of the virus within the nasopharynx and nasal passages and that this communication encourages further study.
Keywords: COVID-19; Nasopharynx (VI); Printing, Three- Dimensional; Polymerase Chain Reaction; Severe Acute Respiratory Syndrome Coronavirus 2; Ribonuclease P
Introduction
Many studies have noted false negative SARS-CoV-2 RT-PCR tests, as high as 29%-41% [1-3]. Such inconsistency could result from variability in the duration of symptoms [4-6], type of sample e.g. NP, throat, deep endotracheal [5] as well as suboptimal collection or use of a less sensitive molecular test. We developed a 3D printed swab to cope with anticipated and subsequent actual shortages of commercial NP swabs. Two of the authors (KC and ML) collected both conventional and 3D swabs from 24 previously documented Coronavirus Disease 2019 (COVID-19) positive patients at the same time, eliminating many of the variables that might contribute to discordant results.
Methods
Patient population
Twenty-four patients admitted to the UF Health Shands hospital Gainesville, FL in March- April, 2020 known to have been positive for SARS-CoV-2 were tested by both conventional and 3D printed swabs. Four of these tested negative with both swab types, leaving a final group of 20 who had at least one positive viral gene.
Swab manufacturing
Production occurred at Exactech Inc, Gainesville, Florida, utilizing Good Manufacturing Practices and ISO 13485 standards. Swabs were produced using stereolithography printer (Formlabs Form 2 or 3b models) using a swab design provided by the University of South Florida, North well Health, and Form labs [7]. Figures in Appendix show the swabs during different stages of production.
Collection procedure
Collection personnel had extensive collection experience and collected both types at the same time using 1 nostril for each swab type. All were tested at the same time upon receipt in the laboratory without freezing. The 3D swabs were placed in Quest VCM (Diagnostic Hybrids, Athens, OH). The standard swab was the Copan FLOQSwabs® Copan Diagnostics, Murrieta, CA.
Laboratory testing
SARS-CoV-2 RT-PCR testing was performed on the ElITech In Genius platform (ELITech Group, Puteaux, France) using the FDA EUA cleared Gene FinderTM COVID-19 Plus RealAmp Kit [8] (Osang Healthcare, Gyeonggi-do, South Korea), independently validated at the UF Health Shands Hospital Core Laboratory. The real time PCR has a limit of detection of 500 copies/ml and detects RdRp, E and N genes, along with the human RNAse P gene as an Internal Control (IC). Cycling parameters and test methods were performed as described by EliTech after onsite training.
Statistics
To test for overall statistical differences between swab types, we used Fisher’s Exact Test and for the paired net difference in Cts both the Mann-Whitney U test and t-test. Standard Deviations (SDs) were compared by the F test (http://www.statskingdom.com/220VarF2.html, accessed 08/12/2020). Correlation coefficients were calculated at: https://www.socscistatistics.com/tests/pearson/default2.aspx, and the statistical significance of the difference between 2 correlation coefficients at: http://vassarstats.net/rdiff.html? Both were accessed 10/13/2020.
Results
The 3D swabs and the conventional swabs performed comparably as measured by the average Cycle Threshold (Ct). For those that were detected by each viral gene, the average Cts of the conventional swab RdRp, E and N genes were: 23.2 ± 4.4, 23.9 ± 7.4, and 27.6 ± 7.7 cycles, compared with 25.8 ± 5.3, 23.5 ± 5.0 and 28.2 ± 6.9 cycles respectively for the 3D swabs p=NS. The average Ct for the internal control human RNAse P gene was 26.1 ± 2.0 and 25.2 ± 2.2 cycles for the conventional and 3D swabs, respectively. Although the Ct averages were equivalent, the 3D swab did not detect any viral genes in 1/20 (5.0%) that the conventional swab detected, while the conventional swab did not detect any viral genes in 3/20 (15%) that were detected by the 3D swab.
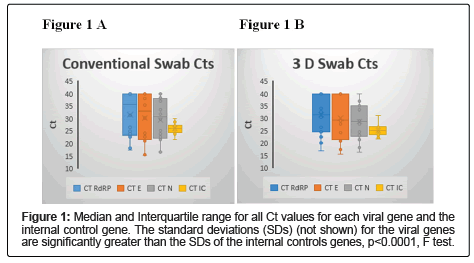
Although the 2 swab types were equivalent on average, there was a great deal more variability between the swab types than within each type and within the human RNaseP internal control gene that reflects the amount of sample obtained. One way to show this variation is that 10/20 (50%) swab pairs had at least 1 viral gene that differed by >10 fold between the swab types, compared with 1/20 (5%) for the internal control gene, p=0.0033, Fisher’s Exact p. Figures 1A (conventional) and 1B (3D) shows the median, range and interquartile range for the viral genes and the internal control gene. The F test showed that the SDs of each of the viral genes for each swab type was significantly larger than those for the comparable internal control genes, p<0.00001.
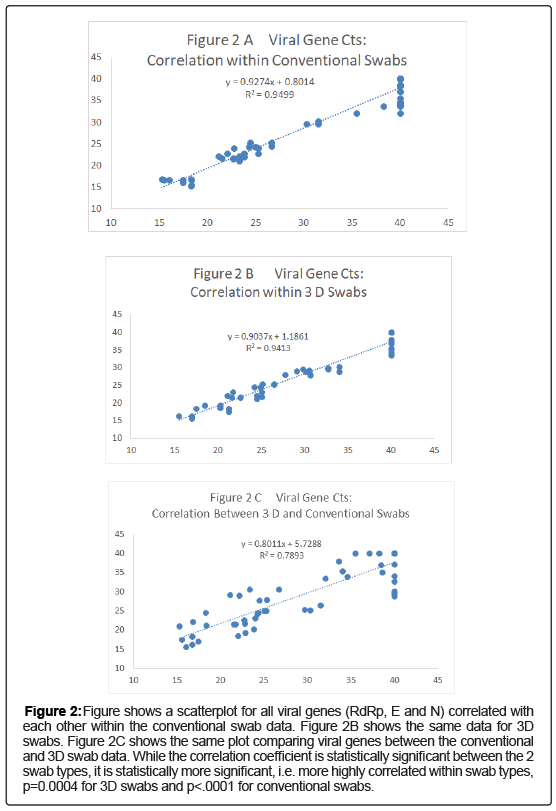
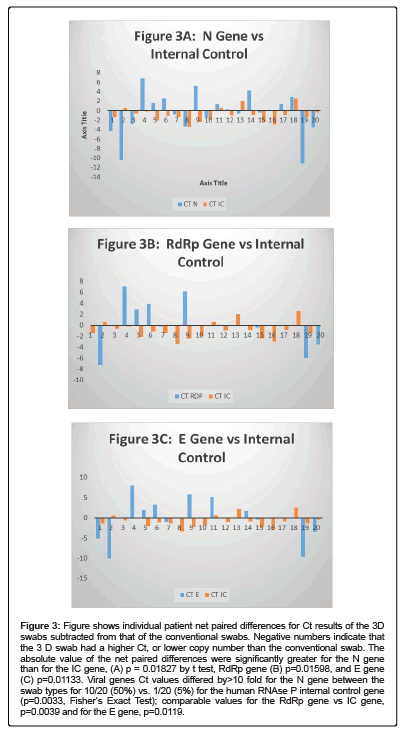
For each swab pair that detected a viral gene and the internal control gene, paired net differences in Ct between the 2 swab types was calculated and is shown graphically in (Figures 2A-2C). There is clearly a great deal more variability in the absolute value of the viral genes paired differences than for the IC: RdRp gene vs. IC gene, p=0.01598 by t test, E gene p=0.01133 and N gene p=0.01827 (Figures 2A-2C). In addition for the viral genes that were detected Ct values differed by >10 fold for the N gene between the swab types for 10/20 (50%) vs. 1/20 (5%) for the human RNAse P internal control gene (p=0.0033, Fisher’s Exact Test); comparable values for the RdRp gene vs. IC gene, p=0.0039 and for the E gene, p=0.0119.
Figure 2: Figure shows a scatterplot for all viral genes (RdRp, E and N) correlated with each other within the conventional swab data. Figure 2B shows the same data for 3D swabs. Figure 2C shows the same plot comparing viral genes between the conventional and 3D swab data. While the correlation coefficient is statistically significant between the 2 swab types, it is statistically more significant, i.e. more highly correlated within swab types, p=0.0004 for 3D swabs and p<.0001 for conventional swabs.
Figures 3A and 3B show scatter gram plots for the correlation of all viral gene vs internal control gene Cts within each swab type compared with the same plot between swab types, Figure 3C. The correlation coefficient within swab types is significantly higher than between swab types for all viral genes, p=0.0004 within 3D vs. between 3 D and conventional, p<0.0001, within conventional vs. between 3D and conventional.
The steps and details of the 3D printing process are shown the Supplementary Material Figure legend.
Figure 3: Figure shows individual patient net paired differences for Ct results of the 3D swabs subtracted from that of the conventional swabs. Negative numbers indicate that the 3 D swab had a higher Ct, or lower copy number than the conventional swab. The absolute value of the net paired differences were significantly greater for the N gene than for the IC gene, (A) p = 0.01827 by t test, RdRp gene (B) p=0.01598, and E gene (C) p=0.01133. Viral genes Ct values differed by>10 fold for the N gene between the swab types for 10/20 (50%) vs. 1/20 (5%) for the human RNAse P internal control gene (p=0.0033, Fisher’s Exact Test); comparable values for the RdRp gene vs IC gene, p=0.0039 and for the E gene, p=0.0119.
Discussion
To our knowledge this is the first study to compare SARS CoV 2 RT PCR from both nostrils collected at the same time by experienced investigators. Our results show there is far greater variation between an individual’s 2 nostrils in the viral copy number than that of the IC. Since the IC measures the human RNAse P gene, the IC Ct values directly measures the amount of human material collected [9]. Thus,the differences in viral Cts most probably reflect underlying biological differences in distribution within the nasopharynx and nasal passages. These differences could reflect differences in expression of the ACE 2 receptor, the known binding site for the SARS-CoV-2 Spike protein, or potentially differences in the degree of replication in the goblet or other cells of the nasal passages [10]. Limitations include sample size and being a single center study, however, the results are consistent with widespread experience in laboratory COVID-19 variability [1- 6]. Another potential limitation is that the internal control gene Ct can vary depending on the copy number of the other targets in the multiplex PCR reaction. We think this is unlikely to have influenced our results because the average Ct of the internal control gene did not change when no targets, 1, 2 or all 3 targets were detected, irrespective of the target Ct (data available on request).
Conclusion
In conclusion, we found that the ability to detect SARS CoV- 2 was equivalent between the conventional and 3D printed swabs, allowing our institution to provide testing at a time when supplies were problematic. As part of this validation, we observed that the SARS CoV-2 viral distribution in the nose/nasopharynx was biologically more variable than could be accounted for by the amount of human material obtained by the swab process...We suggest this observation be confirmed in other institutions and extended by further studies.
Acknowledgment
We gratefully acknowledge the support of the UF Health Shands Hospital laboratory staff in carrying out the laboratory testing and UF medical students who have helped with swab collections and demonstrated leadership at the forefront of the COVID-19 response process.
Ethics Statement
The Chairman of the University of Florida Health Science Center Institutional Review Board (IRB) determined that this study was performed strictly for the purpose of validation of a laboratory specimen type and not for research. Therefore IRB approval was not required.
Author Bio:
Dr. Rand is the Director of the UF Health Shands Clinical Microbiology Laboratory and Professor of Pathology, Immunology and laboratory Medicine and Infectious Diseases at the University of Florida. His primary research interest is in application of molecular diagnostics of infectious diseases.
Funding
This study was supported through internal funds from the University of Florida.
References
- Ai T, Yang Z, Hou H, Zhan C, Chen C , et al. (2020) Correlation of chest CT and RT-PCR testing for coronavirus disease 2019 (COVID-19) in China: A Report of 1014 Cases. Radiology 296:E32-E40.
- Fang Y, Zhang H, Xie J, Lin M, Ying L, et al. (2020) Sensitivity of chest CT for COVID-19: comparison to RT-PCR. Radiology 296:E115-E117.
- Yang Y, Yang M, Shen C, Wang F, Yuan J, et al. (2020) Evaluating the accuracy of different respiratory specimens in the laboratory diagnosis and monitoring the viral shedding of 2019-nCoV infections [pre-print] medRxiv.
- Zou L, Ruan F, Huang M, Liang L, Huang H, et al. (2020) SARS-CoV-2 viral load in upper respiratory specimens of infected patients. N Engl J Med 382:1177-1179.
- Wang W, Xu Y, Gao R, Lu R, Han K, et al. (2020) Detection of SARS-CoV-2 in Different Types of Clinical Specimens. JAMA 323:1843-1844.
- Wikramaratna P, Paton RS, Ghafari M, Lourenco J (2020) Estimating false-negative detection rate of SARS-CoV-2 by RT-PCR. [pre-print] MedRxiv.
- Ford J, Goldstein T, Trahan S, Neuwirth A, Tatoris K, et al. (2020) A 3D-printed nasopharyngeal swab for COVID-19 diagnostic testing. 3D Print Med 6:1.
- Fact sheet for healthcare providers. Gene finder COVID-19 plus realamp Kit – OSANG Healthcare April 18, 2020 Osang Healthcare website.
- Rosenstraus M, Wang Z, Chang SY, DeBonville D, Spadoro JP, et al. (1998) An internal control for routine diagnostic PCR: Design, properties, and effect on clinical performance. J Clin Microbiol 36:191-197.
- Sungnak W, Huang N, Bécavin C, Berg M, Queen R, et al. (2020) HCA Lung Biological Network. SARS-CoV-2 entry factors are highly expressed in nasal epithelial cells together with innate immune genes. Nat Med 26:681-687.
Citation: Rand KH, Cherabuddi K, Lauzardo M, Beal SG, Harris N, et al. (2021) Biological Variability of SARS-CoV-2 RT-PCR Nasopharyngeal Swab Tests. J Infect Dis Ther 9:449. DOI: 10.4172/2332-0877.1000449
Copyright: © 2021 Rand KH, et al. This is an open-access article distributed under the terms of the Creative Commons Attribution License, which permits unrestricted use, distribution, and reproduction in any medium, provided the original author and source are credited.
Share This Article
Recommended Journals
Open Access Journals
Article Tools
Article Usage
- Total views: 2125
- [From(publication date): 0-2021 - Feb 22, 2025]
- Breakdown by view type
- HTML page views: 1502
- PDF downloads: 623


