Availability of Heavy Metal in soil of Lahore City, Pakistan and Mapping by Using GIS Techniques
Received: 01-Jul-2022 / Manuscript No. jescc-22-68373 / Editor assigned: 04-Jul-2022 / PreQC No. jescc-22-68373 (PQ) / Reviewed: 18-Aug-2022 / QC No. jescc-22-68373 / Revised: 21-Jul-2022 / Manuscript No. jescc-22-68373 (R) / Accepted Date: 21-Jul-2022 / Published Date: 28-Jul-2022 DOI: 10.4172/2157-7617.1000629
Abstract
Considering the importance of Lahore for environmental degradation by contaminated Soils, this research was made to investigate and determine heavy metals contamination in the Soil. The main threats to human health from heavy metals are associated with exposure to lead, cadmium, mercury and arsenic. These metals have been extensively studied and their effects on human health regularly reviewed by international bodies such as the WHO. Heavy metals have been used by humans for thousands of years. Although several adverse health effects of heavy metals have been known for a long time, exposure to heavy metals continues, and is even increasing in some parts of the world, in particular in less developed countries, though emissions have declined in most developed countries over the last 100 years (Mahurpawar 2015). Heavy metals are toxic to soil, plants, aquatic life and human health if their concentration is high in the compost. Heavy metals exhibit toxic effects towards soil biota by affecting key microbial processes and decrease the number and activity of soil microorganisms. Even low concentration of heavy metals may inhibit the physiological metabolism of plant. Uptake of heavy metals by plants and subsequent accumulation along the food chain is a potential threat to animal and human health. Twenty of the busiest and engaged locations in the Lahore city were scrutinized for the contamination of zinc (Zn), Nickel (Ni), Copper (Cu), iron (Fe), manganese (Mn). The research highlights sampling techniques and sample digestion method employed for the determination of heavy metals in the soil of Lahore. The most widely used technique for the analytical consequent of heavy metal contents is AAS (Atomic Absorption Spectrometer).Multivariate Geospatial analyses were accomplished by using GIS and SPSS 20 helped in Statistical Analysis.
Keywords: Soil pollution; Heavy metals; GPS locations; GIS maps; AAS (Atomic Absorption Spectrometer)
Introduction
Soil is a vital component of rural and urban environments, and in both places land management is the important to soil quality. Mining, manufacturing, and the use of synthetic products (e.g. pesticides, paints batteries, industrial waste, and land application of industrial or domestic sludge) can cause heavy metal contamination of urban and agricultural soils. Over a few decades, rapid increase in population caused high urbanization and industrialization. Industrial revolution have proved to be of great importance and beneficial to humans but on the other side is secretly damaging human life and also destroyed nature on earth (Brümmer 1986). In urban areas, the potential for increased demands of industries is important. The phenomenon of increased urbanization can be defined by high rate of population growth, population density and migration from rural to urban areas in a few years environmental pollution as a result of all such common activities, have become a rising bugbear for stable and balanced ecosystem (Williamson 1988). Heavy metals also occur naturally, but rarely at toxic levels. Potentially contaminated soils may occur at old landfill sites (particularly those that accepted industrial wastes), build up areas, old orchards that used insecticides pesticides containing cadmium as an active ingredient, fields that had past applications of waste water or municipal sludge areas in or around mining waste piles and tailings, industrial areas are rich in chemical contamination where chemicals may have been dumped on the ground, or in areas downwind from industrial sites (Peters 1999) [1].
Excess heavy metal accumulation in soils is toxic or harmful to humans and other animals. Soils may become polluted by the accumulation of heavy metals and (Mahurpawar 2015) metalloids through emissions from the rapidly expanding industrial areas, mine tailings, disposal of high metal wastes, leaded gasoline and paints, land application of fertilizers, animal manures, sewage sludge, pesticides waste water irrigation, coal combustion residues, spillage of petrochemicals, and atmospheric deposition.
Heavy metals constitute an ill-defined group of inorganic chemical hazards, and those most commonly found at contaminated sites are zinc (Zn), copper (Cu), manganese (Mn), iron (Fe), cadmium (Cd) and nickel (Ni). Soils are the major sink for heavy metals released into the environment by abovementioned anthropogenic activities. Changes in their chemical forms (speciation) and bioavailability are, however, possible. Exposure to heavy metals is normally chronic (exposure over a longer period of time), due to food chain transfer. Acute poisoning from heavy metals is rare through ingestion or dermal contact, but is possible.
The most common problem causing cadmium, nickel, copper, zinc, iron and manganese, Heavy metals uptake by plants and successive accumulation in human tissues and Bio magnifications through the food chain causes both human health and environment concerns. Heavy metals are considered one of the major sources of soil pollution. Heavy metal pollution of the soil is caused by various metals, especially Cu, Ni, Cd, Zn, Fe and Mn. Some heavy metals (like Fe, Zn, Cu and Mg) have been reported to be of bio-importance to man and their daily medicinal and dietary allowance. The presence of toxic metals in soil can severely inhibit the biodegradation of organic contaminants [2]. Heavy metal contamination of soil may pose risks and hazards to humans and the ecosystem through: direct ingestion or contact with contaminated soil, the food chain (soil-plant-human or soil-plantanima lumen), drinking of contaminated ground water, reduction in food quality (safety and marketability) via phytotoxicity reduction in land usability for agricultural production causing food insecurity, and land tenure problems. Copper compounds are currently mainly used in re-chargeable nickel–cadmium batteries Copper emissions have increased dramatically during the 20th century, one reason being that copper-containing products are rarely re-cycled, but often dumped together with household waste. The general population is exposed to nickel from air and food in roughly equal proportions. During the last century, lead emissions to ambient air have caused considerable pollution, mainly due to lead emissions from petrol. Children are particularly susceptible to nickel exposure due to high gastrointestinal uptake and the permeable blood–brain barrier. Blood levels in children should be reduced below the levels so far considered acceptable, recent data indicating that there may be neurotoxic effects of nickel at lower levels of exposure than previously anticipated. Heavy metals have been used in many different areas for thousands of years. In developing countries with great population density and scarce funds available for environmental restoration, low cost and ecologically sustainable remedial options are required to restore contaminated lands so as to reduce the associated risks, make the land resource available for agricultural production, enhance food security, and scale down land tenure problems [3].
The principles, advantages, and disadvantages of immobilization, soil washing, and phytoremediation techniques as options for soil cleanup are also presented. The study of pollution indicated that different areas of Lahore city are at a high risk of degradation with mainly soil pollution in different areas.
Study Area
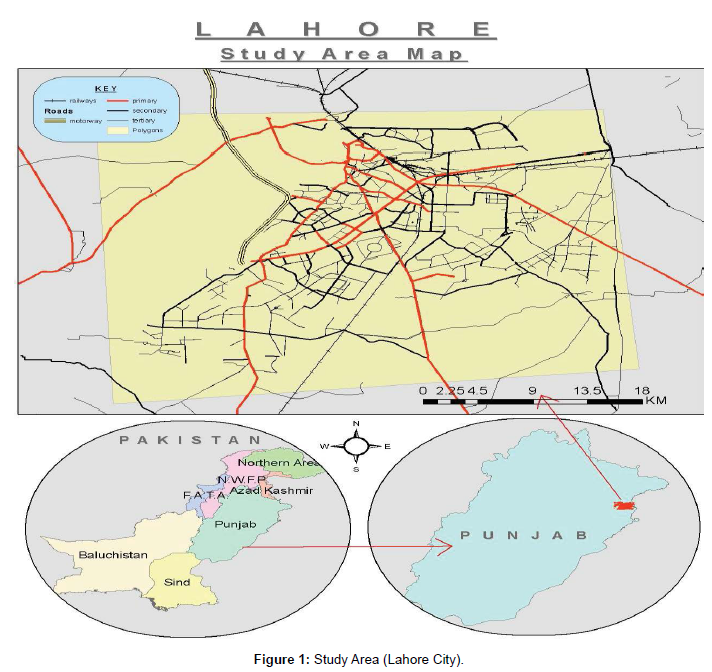
Lahore known as “city of colleges” Lahore is the capital city of the Pakistan province of Punjab. It is the second most populous city in Pakistan and the 32nd most populous city in the world. The city is located in the north-eastern end of Pakistan's Punjab province, near the border with the Indian state of Punjab. Lying between 31°15′—31°45′ N and 74°01′—74°39′ E, Lahore is bounded on the north and west by the Sheikhupura District, on the east by Wagah, and on the south by Kasur District. The Ravi River flows on the northern side of Lahore [4].
Lahore city covers a total land area of 1014 km² and is still growing. Lahore is the capital of Pakistan's largest province, Punjab; with a population exceeding 10 million, it is a megacity and ranked as the country's second largest metropolis (after Karachi). Collectively, it is also the fifth largest city in South Asia. As a major urban center of Pakistan, it was graded in 2008 as a city with high sufficiency to become a Gamma world city. The city has been flourished within the manufacturing and agricultural markets due to extensive road networks and rail links. Lahore enjoys air, rail & road connections with rest of the country [5]. The AL lama Iqbal International Airport caters the needs of Lahore and its adjacent cities, as regular national & international flights are made from here. Lahore is a major railway junction serving links to major cities. On the south of Lahore National Highway N-5 links Multan, on North West & North runs Motorway M-1 and National Highway N-5 towards Gujranwala. On the west it is linked with Textile city of Faisalabad with a 4-lane highway, built on BOO (Built operate & Own) basis. If we talk about elevation of Lahore city then we can say that Lahore is 215m above from the sea level. A historical Grand Trunk road which was a major artery during subcontinent era, originally built by Shyer Shah Sure, the Afghan ruler, leads toward Indian border passing through the city. According to the 1998 census, Lahore's population was 6,318,745. An estimate in January 2015 gave the population of the Lahore agglomeration as 10,052,000. The city has a Muslim majority and Christian minority population. According to the 1998 census, 94% of Lahore's population is Muslim, up from 60% in 1941. Other religions include Christians (5.80% of the total population, though they form around 9.0% of the rural population) and small numbers of Baha’is, Hindus, Ahmedabad, Parses and Sikhs. Lahore has a semi-arid climate (Köppen climate classification BSh) [6]. The hottest month is June, when average highs routinely exceed 40 °C (104.0 °F). The monsoon season starts in late June, and the wettest month is July, with heavy rainfalls and evening thunderstorms with the possibility of cloudbursts. The coolest month is January with dense fog.
The study of pollution indicated that different areas of Lahore city are at a high risk of degradation with mainly soil pollution in different areas (Figure 1).
Objectives of Study
• To investigate the soil pollution.
• To investigate the contamination of toxic heavy metals.
• To investigate the acceptable and exceed amount of heavy metals in soil.
• To investigate the effects of toxic heavy metals on the human health.
Materials and Methodology
Many researchers use GIS in various disciplines and it is also used as a tool for many types of Assessments via; soil, water, land and air pollution assessments etc. Lahore is an industrial City and is vulnerable to contamination of soil therefore by monitoring and observing Contamination of heavy metals in soil of different locations is at a high risk of pollution in the city. The research preceded with the collection of numerous soil samples from the selected areas in Lahore. The different samples of soil were taken at a depth of almost 20-25cm in Soil because the surface soil lies in this depth. A GPS was also used to record the quadrants of the selected areas for spatial analysis. After collecting samples we need 30g soil for next preparation [7]. Because for the purpose of grinding we need soil in large quantity. First of all, we need the process of grinding, in this process when grinding is start the soil will be reduced in quantity. If the soil is in the wet form then we need to dry the soil in oven for 24 hours at 100 Celsius. After that when we grind the soil the rocks present in the soil will be drooped. For the process of grinding we need 10-15 minutes. After this we give sample number to our soil which is divided in portions. Next we need plastic bottles beaker test tube. For the purpose of DPT we need 20g soil. Then we will measure soil number wise for this purpose we use a machine named as weighing. On the surface of this machine a plastic beaker is present; we put the sample soil in this beaker and measure the sample. In this way we complete the process of measuring and grinding. The samples were subjected to wet digestion in nitric acid. Well mixed samples of 20g also mixed with 40 ml of distilled water [8].
Analysis:
Heavy metal analyses were carried out using Atomic absorption spectrometer GBC Avanta version 1.31. The calibration curves were prepared separately for all the metals by running different concentration of standard solution. The instrument was set to zero by running the respective reagent blanks. (2009). Average values of three replicates were taken for each determination. The detection limits for Fe, Zn, Cu, Ni, Mn and Cd are 0.816, 0.8934, -0.059, -0.018, -0.046 and cadmium give negative values [9].
Spatial maps of pollution assessment and spatial distribution of heavy metals in different areas were digitized by using ARCGIS 10.2 software.
Results and Discussion
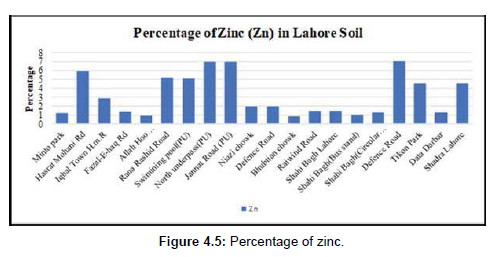
Different areas contained different concentrations of the observed heavy metals. Zinc is one of the most conventionally used heavy metal. Zinc is exposed to the external environment through smelting and refining activities. Zinc is also discharged into the environment through industrial wastewater. Heavy metals constitute an ill-defined group of inorganic chemical hazards, and those most commonly found at contaminated sites are manganese (Mn), zinc (Zn), cadmium (Cd), copper (Cu), iron (Fe), and nickel (Ni). Soils are the major sinks for heavy metals released into the environment by aforementioned anthropogenic activities and unlike organic contaminants which are oxidized to carbon (IV) oxide by microbial action, most metals do not undergo microbial or chemical degradation and their total concentration in soils persists for a long time after their introduction. The presence of toxic metals in soil can severely inhibit the biodegradation of organic contaminants. Heavy metal contamination of soil may pose risks and hazards to humans and the ecosystem through: direct ingestion or contact with contaminated soil, the food chain (soil-plant-human or soil-plant-animal-human), drinking of contaminated ground water, reduction in food quality (safety and marketability) via phytotoxicity, reduction in land usability for agricultural production causing food insecurity, and land tenure problems [10]. In general, soils at industrial sites can have distinct groups of heavy metal contaminants, which depend on the respective industries and their raw materials and products. Soils in all urban areas are generally contaminated with nickel (Ni), zinc (Zn), cadmium (Cd) and copper (Cu) from traffic, paint and many other non-specific urban sources. Although the heavy metal composition of agricultural soils tends to be more closely governed by the parent material, inputs from sources such as deposition of longdistance, atmospherically-transported aerosol particles from fossil fuel combustion and other sources, organic material applications and contaminants in fertilizers can also be significant. (Alloway 2013).in the soil of study area, concentration of zinc range from 6.9845 (mg\kg) to 0.8934 (mg\kg).highest concentration of zinc was recorded in Defense Road, Jannat Road PU, North Under Pass PU, Shahi Bag, Allah Hoo Chowk (Rana Rashid Road), Bhubtian Chowk were reported to have less amount of zinc. Iqbal town have 5.9532 (mg\kg).swimming pool (PU) have 5.0864.like that different location have different quantity of heavy metals. There are different diseases are caused by excess amount of zinc. Stomach infections and immunity problem are also result of excess exposure of zinc [11].
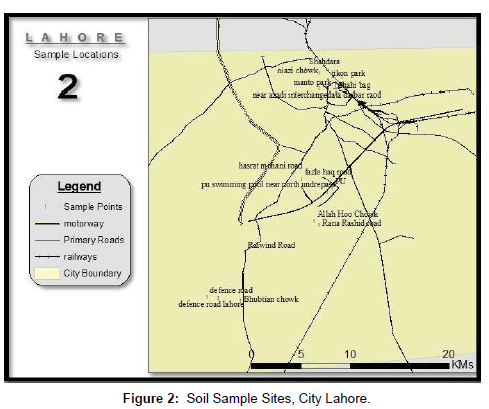
The variation in Cu contamination ranged from 6.477-(-0.059) (mg\kg) and has been characterized through spatial map. The highest concentration of Cu within the range 6.477-4.250 (mg\kg) was inspected in Tikon Park, Shadra, north underpass (PU), Defense Road were recorded for highest amount of Cu (Figure 2).
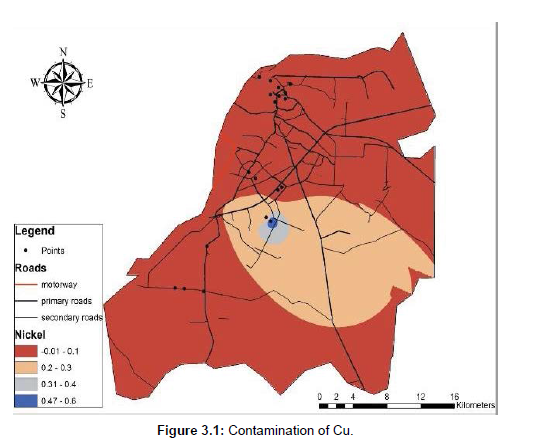
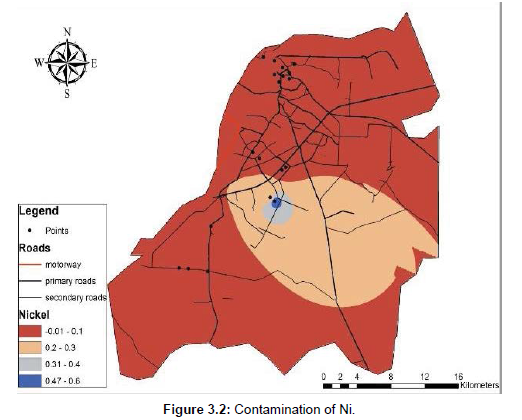
This map shows the suitable and harmful amount of heavy metal copper in soil of Lahore city with specific locations. Maximum amount of copper is present in Tikon Park, shadra, university of Punjab, defense road, Raiwind road. The locations where the quantity of copper is lower are shahi Bag, bhubtian chowk, iqbal town, fazal-e-haq road, and niazi chowk. Maximum and minimum quantity of copper is 6.477 (mg\kg),- 0.059 (mg\kg) respectively (Figure 3.1-3.2).
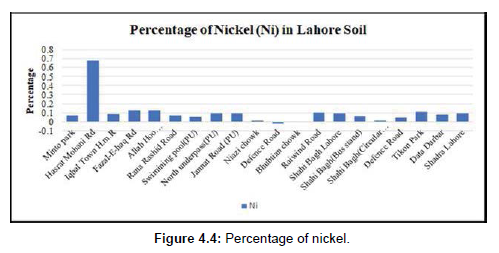
This map shows the amount of nickel with specific locations. If we check the sample locations then we can observe that maximum or harmful amount of Nickel is present in Rana Rashid road, faze-e-haq road, Tikon Park, Raiwind road, shadra, and shahi Bag. Besides this, minimum amount or suitable amount of nickel is present in defense road, niazi chowk, bhubtian chowk, and university of Punjab. The maximum and minimum quantity of nickel is 0.130 (mg\kg), -0.018 (mg\kg) respectively.
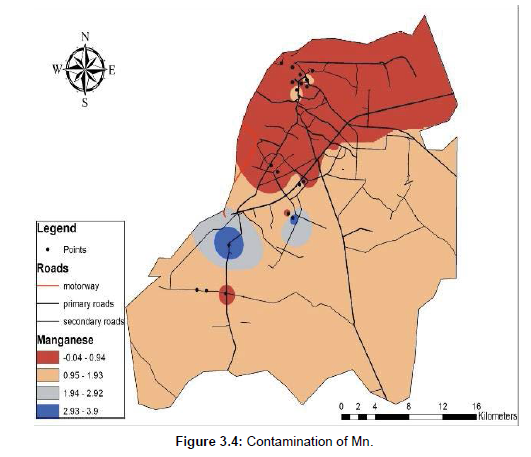
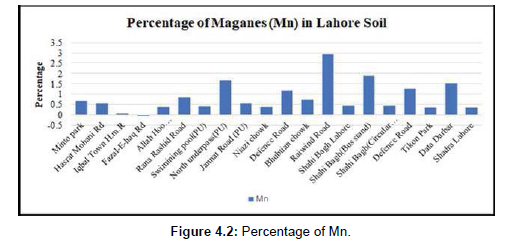
This map also shows the harmful, not suitable, moderately suitable, and suitable amount of manganese with locations. The highest amount of Mn present in Rana Rashid Road, Raiwind Road, Shahi Bag, university of Punjab, Data Darbar, defense Road,. Minimum amount of manganese present in Tikon Park, Shadra, iqbal town, fazel-E-haq road. Maximum and minimum amount of manganese is 3.843 (mg\ kg),-0.046 (mg\kg) respectively (Figure 3.3-3.4).
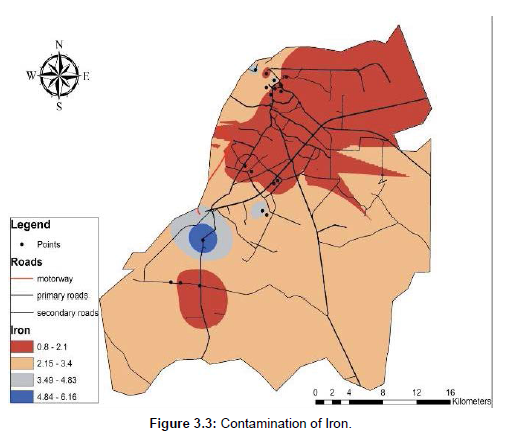
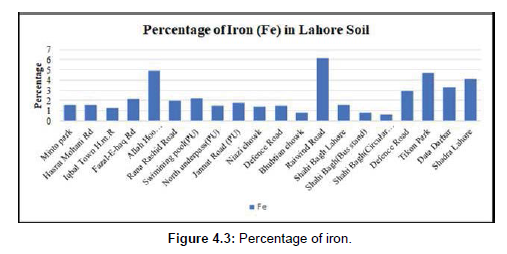
This map also shows the acceptable and harmful amount of iron with locations. Maximum amount of iron is present in Raiwind road, Rana Rashid Road, Tikon Park, shadra, Data Durbar. Minimum amount of iron is present in iqbal town, shahi bagh. Maximum and minimum amount of iron is 6.174 (mg\kg), 0.816 (mg\kg) respectively.
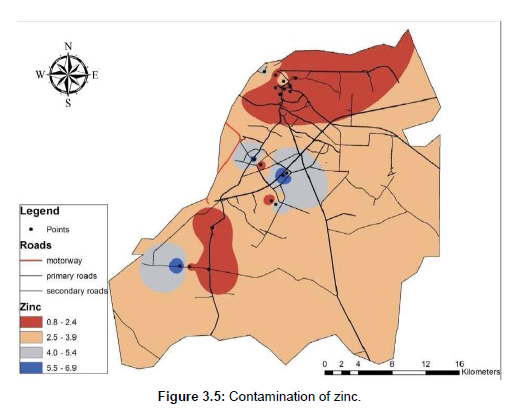
This map shows the effect with the quantity of heavy metal zinc in soil of Lahore city with specific locations. Maximum amount of zinc is present in Tikon Park, shadra, university of Punjab, defense road, Raiwind road. The locations where the quantity of copper is lower are shahi Bag, bhubtian chowk, iqbal town, fazal-e-haq road, and niazi chowk. Maximum and minimum quantity of copper is 6.9845 (mg\kg), 0.8934 (mg\kg) respectively (Figure 3.5).
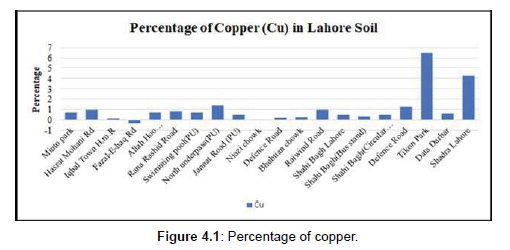
If we show the percentage of heavy metals in graph pattern then it will be in this graph we explain the quantity of heavy metal in sample according to sample number. In this graph sample 18 have maximum amount of Cu then sample 20 then sample no 8 then sample no 18 and so on (Figure 4.1).
This graph shows the quantity of meganease.in this graph we can see that different sample have different amount of MN. For example sample no 13, 15, 8, 19 have the maximum quantity (Figure 4.2).
This graph shows the iron quantity. This graph also has the variations in the quantity. If we study this graph then we can observe that sample no 13, 5, 18, 20 have the maximum amount of iron in Lahore soil (Figure 4.3).
Like other graphs this graph also the quantity of nickel.in this graph just sample no 2 have the maximum amount of nickel and remaining all sample have the minor amount of nickel (Figure 4.4).
This graph shows the quantity of zinc. If we observe this graph then we can observe that these almost all sample have maximum amount of zinc.at the end we can say that zinc is present at the large scale in Lahore soil (Figure 4.5).
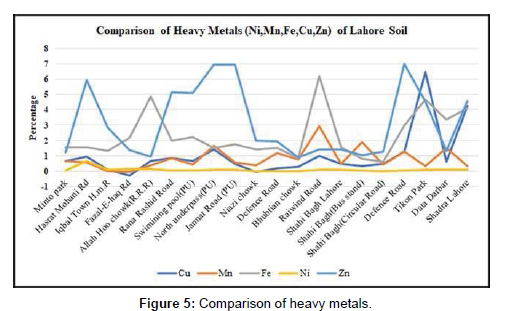
This graph shows the comparison of five major heavy metals in Lahore soil. After studying this graph carefully, we can understand easily that zinc have the highest amount in soil. Zinc is present in excess amount in Lahore area. Next iron is present at second number. Iron is very essential component but in excess every component is harmful. After zinc and iron, copper is at third number. Copper is also important for soil. After copper, manganese is present in soil, and at the end nickel is present at a low rate in Lahore soil (Figure 5)
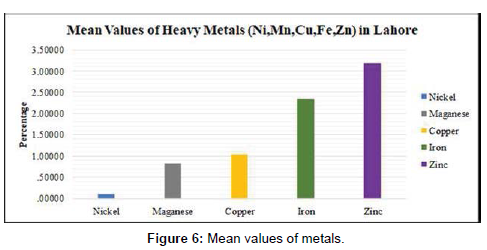
This graph shows the mean values of heavy metals in Lahore soil (Figure 6).
At the end, we can say that highest amount of zinc and lowest amount of nickel is present in Lahore soil (Table 1-2).
| Parameters | Acceptable limits | Mean value |
|---|---|---|
| Zn | 5.0-5.5 | 3.189015 |
| Fe | 5.0-5.5 | 2.34645 |
| Cu | 5.0-5.5 | 1.03420 |
| Mn | 5.0-5.5 | .82625 |
| Ni | 5.0-5.5 | .09880 |
| Cd | 5.0-5.5 | Negative value |
Table 1: Comparison of heavy metals values with acceptable limits.
| N | Range | Minimum | Maximum | Sum | Mean | Std. Deviation | Variance | |
|---|---|---|---|---|---|---|---|---|
| Statistic | Statistic | Statistic | Statistic | Statistic | Statistic | Statistic | Statistic | |
| Nickel | 20 | .698 | -.018 | .680 | 1.976 | .09880 | .143111 | .020 |
| Manganese | 20 | 2.971 | -.046 | 2.925 | 16.525 | .82625 | .726307 | .528 |
| Copper | 20 | 6.777 | -.300 | 6.477 | 20.684 | 1.03420 | 1.580086 | 2.497 |
| Iron | 20 | 5.577 | .593 | 6.170 | 46.929 | 2.34645 | 1.528181 | 2.335 |
| Zinc | 20 | 6.0911 | .8934 | 6.9845 | 63.7803 | 3.189015 | 2.2939588 | 5.262 |
| Valid N (list wise) | 20 |
Table 2: Descriptive Statistics.
Effects of (Mahurpawar 2015)
The term “heavy metals” refers to any metallic element that has a relatively high density and is toxic or poisonous even at low concentration. Some heavy metals have bio-importance as trace elements but, the bio toxic effects of many of them in human biochemistry are of great concern. It is also important to know their sources, leaching processes, chemical conversions and their modes of deposition to pollute the environment, which essentially supports lives [12].
Their presence is considered unique in the sense that it is difficult to remove them completely from the environment once they enter in it. The impact of these toxic agents on human health is currently an area of intense interest due to the ubiquity of exposure. With the increasing use of a wide verity of metals in industry and in our daily life, problems arising from toxic metal pollution of the environment have assumed serious dimensions.
Sources and Emissions
Toxic metals, to a large extent, are dispersed in the environment through industrial effluents, organic wastes, refuse burning, and transport and power generation. They can be carried to places many miles away from the sources by wind, depending upon whether they are in gaseous form or as particulates. Metallic pollutants are ultimately washed out of the air into land or the surface of water ways. Thus air is also a route for the pollution of environment another means of dispersal is the movement of drainage water from catchment areas.
Copper is a naturally-occurring metallic element that occurs in soil at an average concentration of about 50 parts per million (ppm). The major sources of environmental copper releases include the mining, smelting and refining of copper, industries producing products from copper such as wire, pipes and sheet metal, and fossil fuel combustion. The principal source of copper in drinking water results from the leaching of copper from pipes and bath fixtures due to acidic water. Blue-green stains left in bath fixtures are a sign of the presence of copper in water. Ingestion of excessive copper can cause temporary gastrointestinal distress with symptoms such as nausea, vomiting, and abdominal pain. Liver toxicity was seen in doses high enough that resulted in death. High levels of exposure to copper can cause destruction of red blood cells, possibly resulting in anemia. Long Term (Chronic) Effects Mammals have efficient mechanisms to regulate copper stores in the body such that they are generally protected from excess dietary copper levels. However, at high enough levels, chronic overexposure to copper can damage the liver and kidneys. Wilson's disease is an inherited (genetic) disorder in which copper builds up in the liver. Symptoms of liver toxicity (jaundice, swelling, pain) usually do not appear until adolescence. Copper have shown increased cancer risks. Nickel is a compound that occurs in the environment only at very low levels. Humans use nickel for many different applications. The most common application of nickel is the use as an ingredient of steal and other metal products. It can be found in common metal products such as jewelry. Nickel uptake will boost when people eat large quantities of vegetables from polluted soils. Plants are known to accumulate nickel and as a result the nickel uptake from vegetables will be eminent when the uptake is too high it can be a danger to human health. An uptake of too large quantities of nickel has the following consequences: Higher chances of development of lung cancer, nose cancer, larynx cancer and prostate cancer Sickness and dizziness after exposure to nickel gas Respiratory failure, Lung embolism, Birth defects, Asthma and chronic bronchitis, Allergic reactions such as skin rashes, mainly from jewelry, Heart disorders. Nickel fumes are respiratory irritants and may cause pneumonitis. Exposure to nickel and its compounds may result in the development of a dermatitis known as “nickel itch” in sensitized individuals. The first symptom is usually itching, which occurs up to 7 days before skin eruption occurs. Consumption of zinc, either too much, the wrong type or just an intolerance on your part can cause stomach upset. Problems such as indigestion, heartburn, headaches and abdominal cramps are not uncommon. Ironic that adequate zinc intake is often said to improve your immune system. Too much zinc can still cause eminent health problems, such as stomach cramps, skin irritations, vomiting, nausea and anemia. Very high levels of zinc can damage the pancreas and disturb the protein metabolism, and cause arteriosclerosis. Extensive exposure to zinc chloride can cause respiratory disorders.
Iron may cause conjunctivitis, thyroiditis, and retinitis if it contacts and remains in the tissues. Chronic inhalation of excessive concentrations of iron oxide fumes or dusts may result in development of a benign pneumoconiosis, called siderosis, which is observable as an x-ray change. No physical impairment of lung function has been associated with siderosis. Inhalation of excessive concentrations of iron oxide may enhance the risk of lung cancer development in workers exposed to pulmonary carcinogens. Manganese is a very common compound that can be found everywhere on earth. Manganese is one out of three toxic essential trace elements, which means that it is not only necessary for humans to survive, but it is also toxic when too high concentrations are present in a human body. Manganese effects occur mainly in the respiratory tract and in the brains [13]. They may become impotent Symptoms of manganese poisoning are hallucinations, forgetfulness and nerve damage. Manganese can also cause Parkinson, lung embolism and bronchitis. A syndrome that is caused by manganese has symptoms such as schizophrenia, dullness, weak muscles, headaches and insomnia (Whitney 1975).
Conclusion
Industrial revolution and urbanization are significant factors all the countries as well Pakistan. Many large cities of Pakistan are becoming cause of environmental degradation. As most of all the cities are involving in many environmental glitches and Gujranwala cannot exclude from it. Conclusively, based on experimental studies, the advances of toxicology has improved our knowledge about human exposure to toxic elements (metals and metalloids) and there. Health effects, such as developmental retardation, several types of cancer, kidney damage, endocrine disruption, immunological, neurological effects and other disorders. The ongoing research works throw more light onto new insights and biochemical and molecular mechanisms involved in the development of pathological conditions in human. It is urged that should make laws and implementation of that laws to check and control the proper control of heavy metals that are crucial to urban environment.
Acknowledgement
Special thanks to Dr.Ghani-ul-Rehman (Ph.D. Geography), Ahmed Yaseen Ghouri (GIS- Specialist)
Author Contribution
All authors contributed to the study conception and design. Material preparation, data collection, and analysis were performed by Ahmed Yaseen Ghouri and Fahad Rasheed.
Funding
No any Funding Provided.
Availability of Data and Materials
Collect soil Sample with the help of field survey.
Conflict of interest
The authors have no conflict of interest to declare that are relevant to the content of this article.
References
- Yeang K, Richards I (2007) Eco Skyscrapers. Images Pub.
- Brunsell NA, Gillies RR (2003) Length scale analysis of surface energy fluxes derived from remote sensing. J Hydrometeorol 4(6):1212–1219.
- Karnieli A (2010) Use of NDVI and land surface temperature for drought assessment limitations. J Clim 23(3):618-633.
- Kustas W, Anderson M (2009) Advances in thermal infrared remote sensing for land surface Modeling. 12(4):2071–2081.
- Kalma JD (2008) Estimating land surface evaporation: a review of methods using remotely sensed surface temperature data. 29(4):421–469.
- Arnfield AJ (2003) Two decades of urban climate research: a review of turbulence, exchanges energy and water, and the urban heat island. 23(1):1-26.
- McDowell J (2013) Satellite Catalog. Jonathan's Space Page. Retrieved 16 June.
- Landsat 5 Solar Array Drive Anomaly (2017) USGS. Archived from the original.
- LANDSAT 7 Satellite details 1999-020A NORAD 25682 (2015). N2YO 25.
- Adrienne A (2016) NASA's Restore-L Mission to Refuel Landsat 7, Demonstrate Crosscutting Technologies. NASA.
- Susca T, Gaffin SR, Dell GR (2011) Positive effects of vegetation: urban heat island and green roofs. Environ Pollut 159(8-9), 2119–2126.
- Pettorelli N, Vik JO, Mysterud A (2005) Using the satellite-derived NDVI to assess ecological responses to environmental change. Trends Ecol Evol 20(9):503-510.
- Choi H, Lee W, Byun W (2012) Determining the effect of green spaces on urban heat distribution using satellite imagery. Asi J Atmo Environ 6(2):127- 135.
Indexed at, Google Scholar, Crossref
Indexed at, Google Scholar, Crossref
Indexed at, Google Scholar, Crossref
Indexed at, Google Scholar, Crossref
Indexed at, Google Scholar, Crossref
Indexed at, Google Scholar, Crossref
Citation: Ghouri AY, Rasheed F, Yousaf A (2022) Availability of Heavy Metal in soil of Lahore City, Pakistan and Mapping by Using GIS Techniques. J Earth Sci Clim Change, 13: 629. DOI: 10.4172/2157-7617.1000629
Copyright: © 2022 Ghouri AY, et al. This is an open-access article distributed under the terms of the Creative Commons Attribution License, which permits unrestricted use, distribution, and reproduction in any medium, provided the original author and source are credited.
Share This Article
Recommended Journals
Open Access Journals
Article Tools
Article Usage
- Total views: 52647
- [From(publication date): 0-2022 - Apr 02, 2025]
- Breakdown by view type
- HTML page views: 2259
- PDF downloads: 50388

