Automated Image Analysis of Lymphocytes in Lymphocytic Colitis
Received: 08-Dec-2015 / Accepted Date: 15-Dec-2015 / Published Date: 20-Dec-2015 DOI: 10.4172/2161-0681.1000261
Abstract
Background and aims: The diagnosis of microscopic colitis (MC) rests on a triad of clinical symptoms, a normal endoscopy and characteristic histopathological findings, among which the number of intraepithelial lymphocytes (IELs) is a determining histopathological factor in diagnosing lymphocytic colitis (LC). When the surface epithelium in a HE stained slide shows a largely increased number of IELs, the diagnosis of LC is easy. However, diagnosing incomplete lymphocytic colitis (LCi) may be difficult as mitotic-and/or apoptotic figures can be hard to rule out. The same goes for distinguishing LCi from LC. The purpose of this study was to address such diagnostic challenges by developing software to count immunostained (CD3) T-lymphocytes of colon biopsies in order to facilitate diagnostics of LC and LCi.
Methods and results: Software for automated image analysis (AIA) was developed using a training set of 10 colon biopsies (LC, LCi and normal) to match manual scorings of IELs in the surface epithelium. The study set consisted of blinded biopsies from 59 patients with LC or LCi in which four pathologists individually gave a diagnosis of LC, LCi or normal colon. The result of AIA was correlated to the diagnosis provided by the 4 pathologists. The overall agreement between AIA and the manual scoring was 96.6% (Cohen’s Kappa: 0.858).
Conclusion: AIA is capable of quantifying CD3 stained lymphocytes in colon biopsies and is applicable as a supplementary diagnostic tool in borderline cases of LC and LCi as well as in research on prospective cohort studies.
Introduction
Microscopic colitis (MC) is a common cause of chronic watery diarrhoea and comprises the two major subgroups of collagenous colitis (CC) and lymphocytic colitis (LC) [1,2]. Recently a third subgroup, incomplete microscopic colitis (MCi), comprising incomplete lymphocytic colitis (LCi) and incomplete collagenous colitis (CCi) has been introduced [3,4]. The diagnosis of MC and MCi rests on a triad of clinical symptoms, normal or near-normal endoscopy and characteristic histo-pathological findings [1,2].
The key histological feature of LC is an increased number of surface intraepithelial lymphocytes (IELs) exceeding 20 IELs/100 epithelial cells combined with an increased number of lymphoplasmocytic cells of the lamina propria visualized by haematoxylin eosin (HE) stained slides. LCi shares the same clinical signs as LC, but with a smaller number of IELs compared to LC [4]. Patients with LCi seem to benefit from medical treatment with the same response as patients with LC [5].
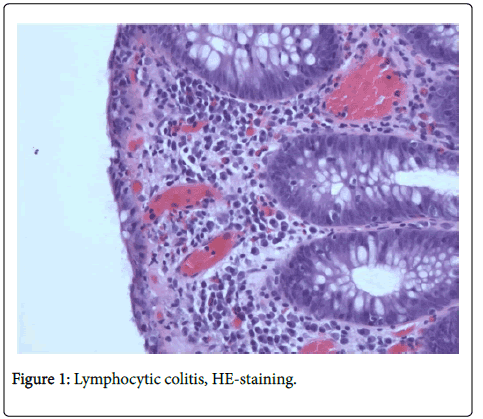
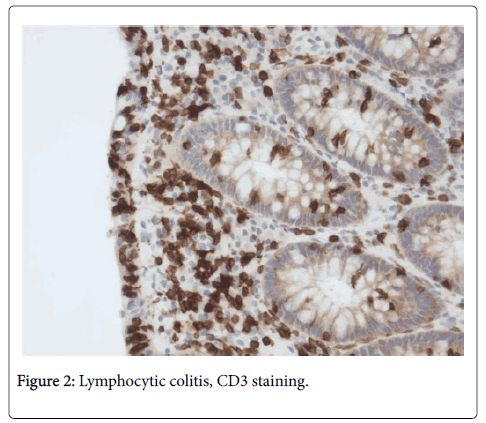
Based on HE stained slides, discriminating MC (CC + LC + MCi) from inflammatory bowel disease (IBD) and normal colonic mucosa [6] has revealed very good observer agreement, but agreement is lower when discriminating between the three MC subgroups [6]. HE stained slides (Figure 1) are usually sufficient to make the diagnosis of LC [4], but in LCi, i.e. in borderline cases of LC, it is recommended to perform CD3 staining (Figure 2) to determine the precise number of IELs [1].
A recent study by Fiehn et al. [7] has investigated application of supplementary CD3 staining in diagnostics of LC and LCi, showing that CD3 staining increases results in increased diagnostic agreement between pathologists and reduces the number of cases primarily considered as LCi. It is therefore suggested to add a CD3 staining in borderline cases-and always prior to giving the histopathological diagnosis LCi.
Automated image analysis (AIA) is useful in research of diseases characterized by the presence accumulation of specific cell population cells, for instance eosinophils in eosinophilic esophagitis [8], mast cells in Hodgkin’s lymphoma [9] and T-lymphocytes in lung allograft biopsies [10]. LC is also a disease with a specific type of cell, the T-lymphocyte; a disease characterized by accumulations of T-lymphocytes and we found it appropriate to explore the usefulness of AIA in targeting the intraepithelial T-lymphocytes in LC and LCi. The aim of this study was therefore to develop and validate software for automatic counting of T-lymphocytes in colon biopsies in order to improve follow-up and treatment of patients with LC and especially LCi.
Materials and Methods
Patient selection
The material for developing software for counting CD3 stained lymphocytes, the training set, consisted of included five cases of LC, 3 cases of LCi and 2 cases of normal colon biopsies. The study set consisted of biopsies from 59 patients diagnosed with LC or LCi during 2013 at the Department of Pathology, Roskilde Hospital, a subset of biopsies of the study of Fiehn et al [7].
According to the pathology reports colonic endoscopy was performed due to diarrhea (54 cases), inflammatory bowel disease (4 cases) and collagenous colitis (1 case) and according to the patients’ records, the colon mucosa was normal or with slight edema in all 59 cases.
Histopathological evaluation of the study set
In 44 cases (75 %), the primary diagnosis was based on HE and CD3 stained slides (Figure 1 and 2 respectively). Before reviewing the study set, biopsies of the remaining 15 cases were stained with CD3 as well. The HE and CD3 stained slides were reviewed independently by four pathologists (P1, P2, P3 and P4) and classified into one of three diagnostic categories, LC, LCi or normal, according to the histopathological characteristics shown in Table 1 [1,4]. Although the material did not include biopsies diagnosed primarily as normal, we thought it wise considered it necessary to include this option category in the review of the study set as it is a differential diagnosis against to LCi. An optional box was available for comments on special features.
All slides were numbered in random order by a technician and the sign-out diagnosis of LC or LCi was unknown to the pathologists. The histopathological characteristics of LC and LCi had to be present in at least one biopsy in an area covering at least three adjacent crypts with no spatial relation to lymphocytic aggregates in the lamina propria. IELs were assessed only in the surface epithelium of the colon biopsies.
Definition of diagnostic categories used for statistical analysis
The individual diagnostic category is the diagnosis made by each of the pathologists in the 59 cases. The common diagnostic category is the most frequent diagnosis occurring in cases with more than one diagnostic category among the 4 pathologists.
Digital analysis
All CD3-stained slides were digitized using a Nanozoomer HT 2.0 slide scanner from Hamamatsu Photonics (Hamamatsu, Japan) and subsequently the digital images were processed using Visiopharm Quantitative Digital Pathology software (Hoersholm, Denmark).
The training set was used to configure the algorithm and calculate the cut-offs on the ratio of positive IEL’s, to differentiate between normal, LCi and LC biopsies. The task was split into the following steps:
• Identification of the biopsies, excluding aggregates of lymphocytes in the lamina propria
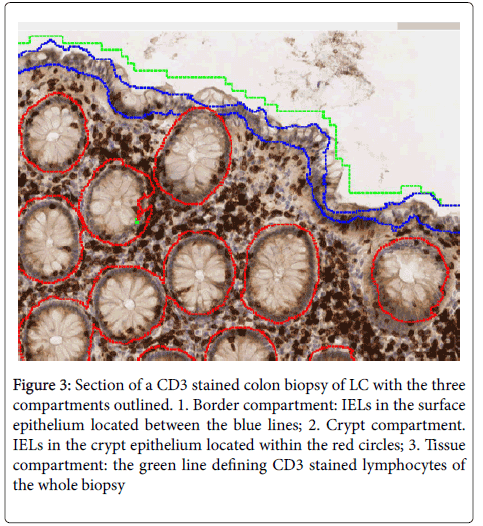
• Analysis of the biopsies, i.e. counting the number of CD3 positive and negative cells of the surface epithelium (border compartment), cryptal epithelium (cryptal compartment) and whole biopsy (tissue compartment) as shown in Figure 3.
Figure 3: Section of a CD3 stained colon biopsy of LC with the three compartments outlined. 1. Border compartment: IELs in the surface epithelium located between the blue lines; 2. Crypt compartment. IELs in the crypt epithelium located within the red circles; 3. Tissue compartment: the green line defining CD3 stained lymphocytes of the whole biopsy
• Comparison of the number of IELs of the surface epithelium counted by AIA to the number counted by pathologists.
The first image processing step involves a segmentation of the tissue from the background. This is performed at a 2 times magnification, digitally created in the software. By limiting the magnification, the data is decreased, thus increasing processing speed. The image is segmented using a simple threshold classifier, on an intensity and DAB color-deconvolution representation of the image. Following post-processing, the tissue is segmented into two areas, whole tissue area and edge.
The identified areas are subsequently analyzed at 5 times to identify key compartments (surface epithelium, cryptal epithelium and lamina propria). Together, these compartments constitute the entire biopsy. The identification is conducted using a threshold classifier on features representing the image saturation, local linear objects and variation. The local linear objects are identified on a Haematoxylin color-deconvolution representation of the image, using Visiopharms Polynomial Local Linear filter.
On the identified tissue areas, high-resolution analysis is performed, using a Bayesian classifier trained on preprocessing steps that highlight the red, blue chromaticity and local circular objects (using Visiopharms Polynomial Blob filter). This detects CD3 positive and negative cells and performs an automatic count of positive/negative objects to calculate the positive ratio. The estimated positive ratios for each sample are compared to the category chosen by the pathologist. Statistics is used to derive the cut-off for when a sample is normal, LCi and LC, while maximizing the agreement to the pathologists. For both the training set and the study set concordance analysis and Cohen’s kappa () statistics were performed using Excel. The cut-off values that gates positive fraction into the diagnostic categories, LC, LCi or normal were initially determined through optimization of Cohen’s , discriminating normal biopsies from LCi, and LCi from LC.
Ethics
The Committee on Health Research Ethics of Regions Zealand, Denmark (SJ-412) approved the study on September 4, 2014, stating that informed consent from the patients was not required. The Danish Data Protection Age ncy (REG-73-2014) approved the study on September 1.
Results
Pathologists diagnostic agreement
Pathologists review showed that in 33 cases (56%) 4 pathologists agreed on the same diagnostic category (full agreement), in 18 cases (30%) 3 pathologists agreed on the same diagnostic category (partial agreement). In 8 cases (13%), the pathologists’ diagnoses were divided on two or three diagnostic categories (disagreement). In the present study, as in the study by Fiehn [7], full and partial diagnostic agreement was considered as a correct diagnosis for which we have used the term “the common diagnostic category”. To reach a common diagnostic category in cases of disagreement, LC and LCi was given precedence to LCi and non-specific inflammatory changes respectively, i.e. LC is weighted higher than LCi, and LCi is weighted higher than normal biopsies and the common diagnostic category was chosen according to that the pathologists’ diagnostic agreement of the 59 cases is shown in Table 2. The pair wise agreement of pathologist P2, P3 and P4 is very high (86%-94%), while agreement with P1 is lower (57%-66%). This table also shows the level of agreement of the individual pathologist’s diagnostic category and the common diagnostic category.
| Histological characteristics | LC | LCi | Normal/Non-specific findings |
|---|---|---|---|
| IELs | >20 | >5 - 20 | ≤ 5 |
| Surface epithelial damage | ++ | + / ++ | - / + |
| Lamina propria inflammation | + | - / + | - / + |
Abbreviations:
LC: lymphocytic colitis; LCi: lymphocytic colitis incomplete: IEL intraepithelial lymphocytes
Table 1: Histological characteristics of lymphocytic colitis (LC), lymphocytic colitis incomplete (LCi) and normal/non-specific findings.
| Compartment | Before editing | After editing |
|---|---|---|
| Positive in border compartment | 12.26% | 12.26% |
| Positive in crypt compartment | 10.31% | 11.34% |
| Positive in tissue compartment | 8.64% | 8.34% |
Table 2: Percentage of CD3stained lymphocytes counted by automated image analysis in ten biopsies before and after editing the three compartments.
Comparing diagnostics of pathologists and AIA
Table 3 shows agreement of the pathologists’ individual and common diagnostic category and AIA of the three compartments. The highest agreement appears in the border compartment, 97% (Cohen´s Kappa: 0.858). The second best agreement is found in the tissue compartment, 90% (Cohen´s Kappa: 0.486), and the lowest agreement is found in the cryptal compartment, 67% (Cohen´s Kappa: 0.323). Details of agreement of the pathologists’ common diagnostic category and AIA of the border compartment are shown in Table 4. To investigate the accuracy of the algorithms´ ability to identify the relevant compartments, a subset of 10 biopsies was selected for manual review and editing i.e. ensuring correct outlining of the surface epithelium, crypt epithelium and lamina propria. Following editing, the counting of CD3 positive cells was repeated and the results were compared to the original (un-edited) analysis. The repeated automatic analysis of IELs did not change the number of CD3 positive cells as shown in Table 5.
| Individual pathologists` diagnostic category | Common diagnostic category P1,P2,P3 and P4 | ||||
|---|---|---|---|---|---|
| P1 | P2 | P3 | P4 | ||
| P1 | 66% | 58% | 58% | 59% | |
| P2 | 86% | 86% | 92% | ||
| P3 | 95% | 95% | |||
| P4 | 95% | ||||
Table 3: Study set of 59 biopses-Pair wise agreement of pathologists’ individual diagnostic category and agreement of pathologists’ individual diagnostic category and their common diagnostic category.
| Automatic image analysis | |||
|---|---|---|---|
| Pathologisits individual diagnostic category | Border compartment | Tissue compartment | Cryptal compartment |
| P1 | 59% | 55% | 71% |
| P2 | 92% | 86% | 76% |
| P3 | 92% | 90% | 71% |
| P4 | 95% | 92% | 73% |
| Pathologists common diagnostic category | 97% | 90% | 76% |
Table 4: Agreement of pathologist’s individual as well as common diagnostic category and automated image analysis of CD3 lymphocytes in the three compartments.
| Pathologists common diagnostic category | |||||
|---|---|---|---|---|---|
| Normal/non- specific | LCi | LC | Total | ||
| Automated image analysis | Normal/non-specific | 1 | 0 | 0 | 1 |
| LCi | 0 | 6 | 2 | 8 | |
| LC | 0 | 0 | 50 | 50 | |
| Total | 1 | 6 | 52 | 59 | |
| Percent agreement | 96.60% | ||||
| Cohen´s kappa | 0.858 | ||||
Table 5: Agreement of pathologists’ common diagnostic category in the border compartment and automated image analysis of the border compartment.
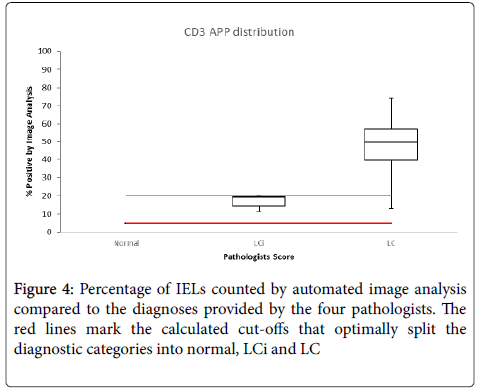
Figure 4 shows the percentage IELs, counted by AIA, compared to the diagnostic category provided by the four pathologists and the cut-offs that optimally split the three diagnostic categories are marked.
Discussion
We have shown that the software is capable of counting CD3 positive lymphocytes of the surface epithelium, crypt epithelium and of the whole biopsy with great accuracy. Manual editing of the compartments did not increase the accuracy of the subsequent AIA, demonstrating that the software is a reliable tool for counting CD3 positive lymphocytes. We have also demonstrated a positive correlation between the pathologists’ diagnostic categories and AIA of the border compartment as well as a positive correlation between the pathologists’ diagnostic categories and AIA the biopsy as a whole. The latter correlation could be explained that CD3 lymphocytes in LC are recruited to the colon mucosa and that an increased number of IELs in the surface epithelium is a consequence of the increased flow of CD3 lymphocytes to the lamina propria.
By convention the identification of LC is primarily based on IELs of the surface epithelium, but occasionally IELs are increased in the crypt epithelium as well, and in a few cases the extent of cryptal IELs exceeds that of the surface epithelium IELs [13]. In our study AIA of the cryptal epithelium showed a positive correlation with the pathologists’ diagnosis (76%), yet inferior to the results of the surface epithelium (97%).
A recent study has shown that biopsies fulfilling the histopathological criteria of MC are temporally often preceded by biopsies with subtle morphological changes, such as increased lymphoplasmocytic infiltrate of the lamina propria [14]. Due to the composition of our study set we have mostly been confined to focus on distinction between LC and LCi, leaving out to study the important issue of distinguishing between subtle morphological changes, such as increased lymphoplasmocytic infiltrate of the lamina propria, and LCi. Having reviewed the study set it turned out that in four cases the pathologists were divided on the diagnostic categories of normal colon and LCi. AIA applied to these cases showed one normal case and three cases of LCi. This indicates that the software is able to distinguish between LCi and normal or unspecific findings.
In histopathological full blown cases of LC, the diagnosis is easily made on HE stained slides, but in borderline cases it may be difficult to distinguish between LC and LC. LCi. In spite of additional CD3 stainings disagreement remains and in such cases AIA has the potential as a diagnostic tool When it comes to research AIA may be helpful too. Being an objective and reproducible tool, eliminating observer variability, AIA minimizes diagnostic disagreement, which is mandatory to achieve uniform pathological diagnosis in multi-center studies and in follow-up on LC and LCi.
A drawback of digital pathology and AIA is the expensive equipment and necessity of special training of the staff, explaining why a definite implementation of digital pathology and AIA is still missing. However the technological progress continues at a high rate and it is a question of time when costs efficiency rates are turning to the favor of digital pathology [15]. Looking in the field of primary diagnostics of gastro intestinal tract pathology there are good reasons to believe that AIA and automated diagnosis assessment will be available in the near future [16,17].
Conclusion
Software developed for counting CD3 stained T-lymphocytes in colon biopsies of LC and LCi, reaches excellent concordance rates with experienced pathologists. When it comes to diagnosing LC and LCi the software has the potential of being an assisting diagnostic tool in borderline cases, which are of most difficulty to the pathologist. The software is also capable of obtaining uniform and reproducible diagnostic material for research purposes.
Authors Contributions
Peter Engel, Anne-Marie Kanstrup-Fiehn and Martin Kristensson designed the research. Peter Engel, Anne-Marie Kanstrup-Fiehn, Ulla Højholt Engel and Susanne Holck performed the diagnostics of the histology slides Martin Kristensson developed the CD3 software, performed data analysis of the scanned slides and analyzed the data. Lars K Munck contributed with clinical information of the patients. All authors contributed equally to writing the paper.
Conflicts of interest
Martin Kristensson is an employee of Visiopharm.
References
- Münch A, Aust D, Bohr J, Bonderup O, FernándezBañares F, et al. (2012) Microscopic colitis: Current status, present and future challenges: statements of the European Microscopic Colitis Group. J Crohns Colitis 6:932-945.
- Munch A, Langner C (2015) Microscopic Colitis: Clinical and Pathologic Perspectives. Clin Gastroenterol Hepatol 13:228-236.
- Munck LK (2013) Incomplete micriscopic colitis: a broader and clinically relevant persepctive. In: Miehlke S, Münch A, editiors. Microscopic colitis-creating awareness for an underestimated disease. Basel, Switzerland: Falk Workshop Basel27-31.
- Langner C, Aust D, Ensari A, Villanacci V, Becheanu G, et al. (2015) Histology of microscopic colitis-review with a practical approach for pathologists. Histopathology 66: 613-626.
- Bjornbak C, Engel PJ, Nielsen PL, Munck LK (2011) Microscopic colitis: clinical findings, topography and persistence of histopathological subgroups. Aliment PharmacolTher 34:1225-1234.
- Fiehn AM, Bjornbak C, Warnecke M, Engel PJ, Munck LK (2013) Observer variability in the histopathologic diagnosis of microscopic colitis and subgroups. Hum Pathol 44:2461-2466.
- Fiehn AK, Engel U, Holck S, Munck LK, Engel PJH (2016) CD3 immunohistochemical staining in the diagnosis of lymphocytic colitis. Human Pathology 48: 25-31.
- GarcÃa-Rojo M, Sánchez JR, de la Santa E, Durán E, Ruiz JL, et al. (2014) Automated image analysis in the study of lymphocyte subpopulation in eosinophilicoesophagitis. Diagnostic Pathology 9: S7.
- Andersen MD, Kamper P, Nielsen PS, Bendix K, Riber-Hansen R, et al. (2015)Tumor-associated mast cells in classical Hodgkin's lymphoma: correlation with histological subtype, other tumor-infiltrating inflammatory cell subsets and outcome.European Journal of Haematology.
- Krustrupa D, Iversenb M, Martinussenc T, Andersena CB (2014) Time elapsed after transplantation the influences relationship between the number of regulatory T cells in lung allograft biopsies and subsequent acute rejection episodes. Transplant Immunology 31: 42-47.
- Langner C, Aust D, Ensari A, Villanacci V, Becheanu G, et al. (2015) Histology of microscopic colitis-review with a practical approach for pathologists. Histopathology 66:613-626.
- Münch A, Aust D, Bohr J, Bonderup O, Bañarese FF, et al (2012) Microscopic colitis: Current status, present and future challenges: statements of the European Microscopic Colitis Group. J Crohns Colitis 6:932-945.
- Rubio CA, Lindholm J (2002) Cryptal lymphocytic coloproctitis: a new phenotype of lymphocytic colitis. J ClinPathol 55:138-140.
- Rasmussen J, Engel PJH, Wildt S, Fiehn AK, Munck LK (2015) The temporal evolution of histologic abnormalities in microscopic colitis. Journal of Crohns and Colitis.
- Kayser K, Görtler J, Bogovac M, Bogovac A, Goldmann T, et al. (2009) AI (artificial intelligence) in histopathology-from image analysis to automated diagnosis. Folia Histochemica et Cytobiologica 47:355-361.
- Al-Janabi S, Huisman A, Vink A, Leguit RJ, OfferhausGJm, et al. (2012) Whole slide images for primary diagnostics of gastrointestinaltrct pathology: a feasibility study. Human Pathology 43: 702-707.
- de Bryin J, Meier SL, Wildeberg ME, Bemelman WA, van den Brink GR, et al. (2015) Development of fibrosis in acute and long- standing ulcerative colitis. Journal of Crohn´s and Colitis 966-972.
Citation: Engel PJH, Fiehn AK, Kristensson M, Engel U, Munck LK, et al. (2015) Automated Image Analysis of Lymphocytes in Lymphocytic Colitis. J Clin Exp Pathol 5:261. DOI: 10.4172/2161-0681.1000261
Copyright: © 2015, Engel PJH, et al. This is an open-access article distributed under the terms of the Creative Commons Attribution License, which permits unrestricted use, distribution, and reproduction in any medium, provided the original author and source are credited.
Share This Article
Recommended Journals
Open Access Journals
Article Tools
Article Usage
- Total views: 12465
- [From(publication date): 12-2015 - Apr 04, 2025]
- Breakdown by view type
- HTML page views: 11519
- PDF downloads: 946
