Atmospheric SO2: Principal Control Knob Governing Earth’s Temperatures
Received: 28-Jan-2019 / Accepted Date: 27-Feb-2019 / Published Date: 06-Mar-2019 DOI: 10.4172/2573-458X.1000170
Abstract
An examination of the effects of SO2 aerosols in earth’s atmosphere shows that they are responsible for all of the changes that have occurred in earth’s temperatures since the Roman Warming period, and, by extension, the cause of all of the ice ages throughout earth’s history.
They are primarily of volcanic origin, but since circa 1950, anthropogenic SO2 aerosol emissions began rising, peaking at ~136 Megatons in 1979, and, because of their cooling effect, fears of a return to little ice age conditions.
However, because of acid rain and health concerns, global clean air efforts to reduce SO2 aerosol emissions were instituted in the early 1970’s, and temperatures began to rise because of the cleaner, less polluted air.
This warming has been attributed to the accumulation of CO2 in earth’s atmosphere, but the analysis presented in this paper shows that the expected warming from the reduction in SO2 aerosol emissions precisely matches the actual rise in global temperatures, leaving NO room for any of the hypothesized warming from “greenhouse” gasses. The warming is simply an unfortunate side effect of clean air efforts.
Keywords: Climate change; Environment; Sulphur dioxide aerosols; Volcanoes
Introduction
It is well known that stratovolcano eruptions can cause temporary cooling of the earth’s surface because of their injection of dimming Sulphur dioxide (SO2) aerosols into the stratosphere. This atmospheric pollution eventually settles out, and temperatures recover to pre-eruption levels, or higher, because of the cleansed air.
In their discussion of atmospheric aerosols, NASA states that “Stratospheric SO2 aerosols reflect sunlight, reducing the amount of energy reaching the lower atmosphere and the earth’s surface, cooling them”. And, anthropogenic SO2 aerosols, from the burning of fossil fuels, “absorb no sunlight but they reflect it, thereby reducing the amount of sunlight reaching the earth’s surface”. Thus, their climatic effects are identical [1].
Anthropogenic SO2 aerosol emissions peaked at ~ 36 Megatons in 1979 [2], and they have steadily fallen since then, to 114 Megatons in 2014, due to global clean air efforts. As with the warming caused by the settling out of volcanic SO2 aerosols, it would be expected that reductions in anthropogenic SO2 aerosol emissions should be responsible for most, if not all, all of the anomalous warming that has occurred since circa 1979.
This paper examines the role of SO2 aerosols in earth’s climate, from the end of the roman warming period to the present, to determine their effect upon the incoming solar radiation.
Discussion
The Roman Warming Period (RWP) (circa 250 BC-AD 450), the Medieval Warm Period (MWP) (c. 950-c. 1250), and the Little Ice Age (LIA) (c. 1257-c. 1850) were all world-wide events [3], caused by decreases or increases in the amount of volcanic SO2 aerosol emissions into the atmosphere.
The RWP ended with the VEI6+ eruption of Llopango (El Salvador) and the Plinian (most powerful known category) eruption of Pelee (both circa 450), Vesuvius (VEI5) in 472, and at least 71 VEI4 or larger eruptions in the interim before the MWP, including three Plinian eruptions, c. 730, 823, and 890 [4]. Other large as-yet-unidentified oceanic or land eruptions may also have occurred.
When this extensive volcanism abated, warming naturally occurred as their SO2 aerosolsx settled out of the atmosphere, and the medieval warming period began.
This, in turn, was followed by the LIA, which began with the large VEI7 eruption of Mount Rinjani in 1257, and Katia (VEI5) in 1262. These were followed by a string of VEI5 or VEI6 eruptions in 1280 (6), 1350, 1352, 1450, 1452, 1471, 1477 (6), 1563, 1580 (6), 1586, 1593, 1600 (6), 1625, 1630, 1631, 1632, 1640. 1641, 1650, 1653, 1657, 1660 (6), 1673, 1680, 1707, 1721, 1739, 1755, 1809 (6) (location unknown), 1815 (7), 1832, 1835, with the VEI7 eruption of Mount Tambora in 1815 resulting in the 1816 “year without a summer”. Within the LIA period, there were also at least 95 VEI4 eruptions, all of which would have contributed to the cooling
(As noted in [3], there were a few warmer periods interspersed within the LIA. These would have been periods between eruptions where volcanic SO2 aerosols had settled out of the atmosphere, usually with the expected formation of a volcanic-induced, or “volcanic recovery” El Nino).
(The “Maunder Minimum” (circa 1645-circa 1715), when very few sunspots were observed, had no effect on LIA temperatures. The reduced flux of various isotopes such as Carbon-14, and N-15 (from cosmic ray impacts) measured for that period was due to obstructing layers of volcanic SO2 aerosols in the atmosphere, and not due to changing solar irradiance levels. However, the temperature reconstructions do provide useful information as to the historical amounts of volcanic SO2 aerosols in the atmosphere).
Again, the LIA ended when the string of large eruptions ended, and temperatures began to rise toward those seen during the earlier warming periods. However, they were prevented from doing so because of anthropogenic SO2 emissions from the developing industrial revolution, which largely replaced those of volcanic origin.
The next large eruption, Mount Krakatoa (VE16, 1883), occurred 68 years later, which provided time for all of Tambora’s SO2 aerosols to have settled out of the atmosphere (5-10 years). Krakatoa’s eruption occurred during the warming from the March 1882-June 1885 recession, somewhat muting its cooling effect (it did not form the usual La Nina).
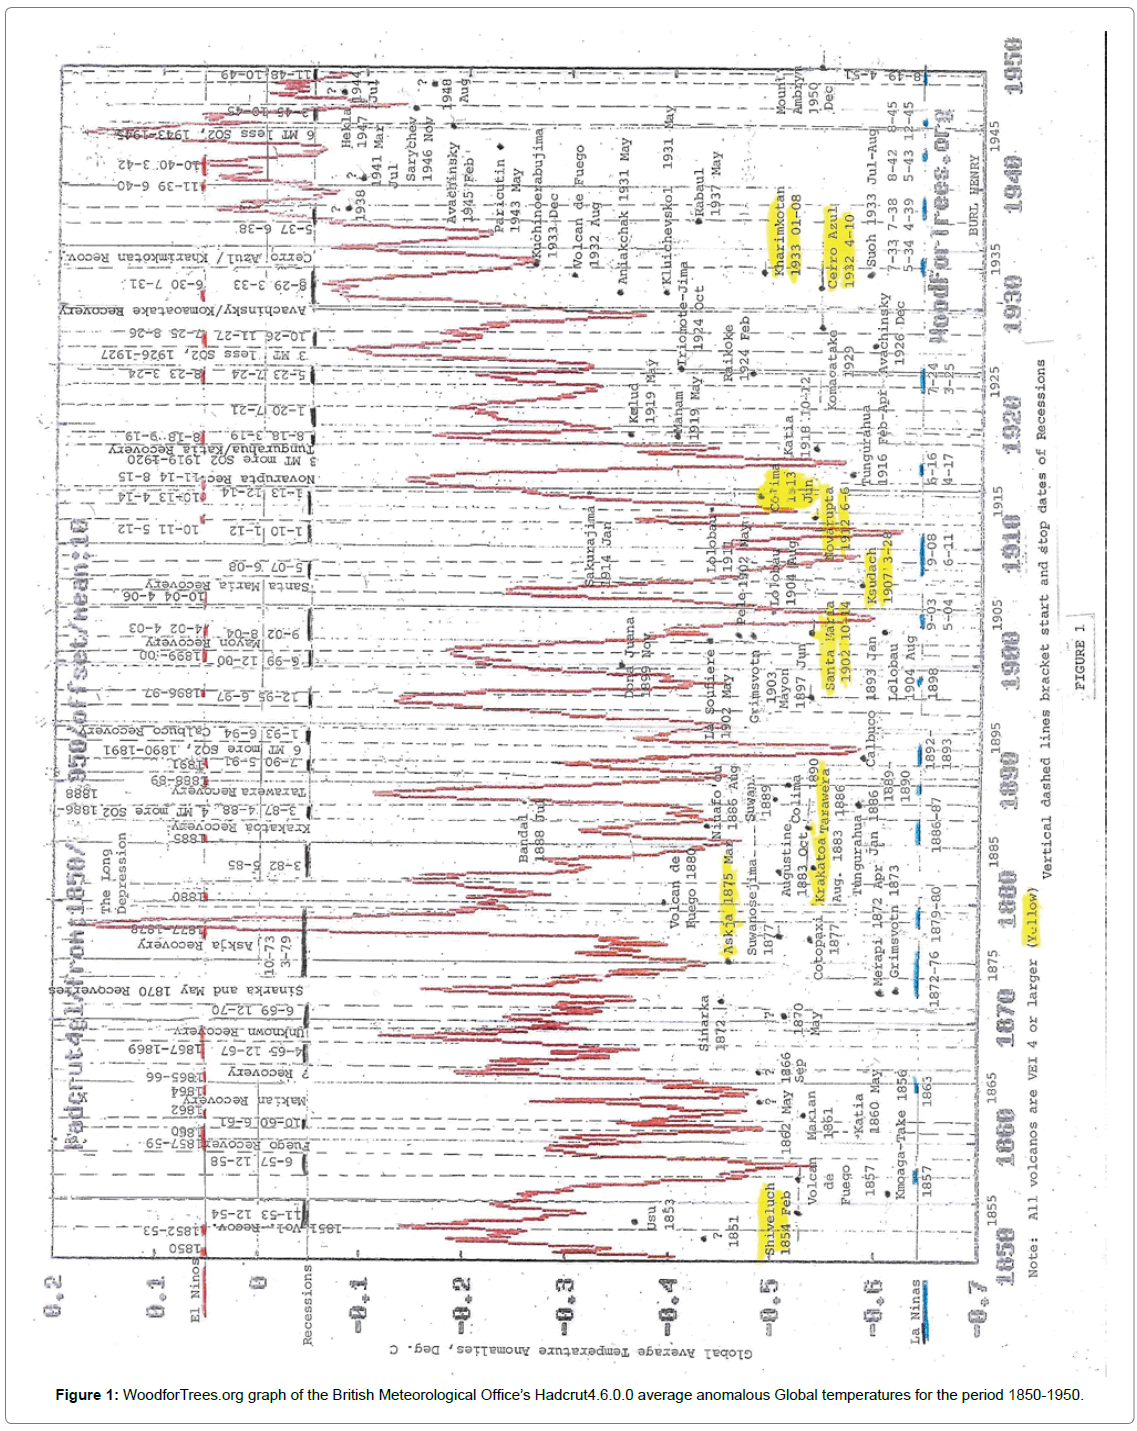
Figure 1 is an enlarged WoodforTrees.org graph of the British Meteorological Office’s HadCRUT.4.6.0.0 average anomalous global temperatures for the period 1850-1950 (with respect to the average of 1961-1990 temperatures). It is annotated with the dates of American business recessions, the dates of El Ninos, La Ninas, and most of the VEI4-VEI7 volcanic eruptions, and shows that essentially all of the temporary excursions in the climate record are related to changing levels of SO2 aerosols in the atmosphere, primarily due to volcanic activity. A few are coincident with American business recessions.
(Recession-induced warming results from fewer anthropogenic SO2 aerosol emissions into the atmosphere due to reduced industrial activity). Its association with American business recessions speaks to the size of the American economy, whose effects can also be enhanced if their recessions spread to other countries.
(However, recessions prior to about 1865 did not result in any noticeable warming, because of the low levels of anthropogenic SO2 aerosols in the atmosphere at that time).
(The “volcanic recovery” warming noted above is due to cleansing of the lower atmosphere by the rain of Stratospheric SO2 aerosols (fine Sulfuric acid droplets) coalescing with those in the troposphere and flushing them out as they descend to the earth’s surface, thus cleansing the lower atmosphere). This should occur with every large stratovolcano eruption with SO2 emissions, unless quenched by a closely following eruption or increased anthropogenic SO2 emissions. This warming typically lags the date of an eruption by 18-24 months).
(Because of the lack of earlier records, data for most of the 1850- 1880 period, including eruptions, may not be as accurate or as complete as that of later years).
Analysis of the “Long Depression” of Oct 1973-Mar 1879 is instructive. It began during the 1872-76 La Nina (caused by the Sinarka, Merapi, Grimsvotn, and Askja eruptions). When their La Nina ended, warming due to fewer atmospheric SO2 aerosols because of the ongoing depression was unmasked, and, along with “volcanic recovery” warming from the 1875 VEI5 Askja eruption in 1877-78, temperatures spiked, resulting in temperatures not seen until more than 120 years later, in 1997, during the very strong Apr 1997-May 1998 El Nino.
According to the HadCRUT.4.6.0.0 data, the warmest anomalous average global temperature increase for this period was +0.40 °C. in Feb 1878. This was substantially higher than any anomalous temperatures of the 1930’s depression years, which peaked at (-) 0.01°C in 1938 (during the May 1937-June 1938 recession years).
The warming of the 1930’s was confined to the northern hemisphere, as shown on the NASA GISS temperature maps, and was caused by greatly reduced industrial SO2 aerosol emissions during the depression years. Between 1929 and 1932, SO2 emissions fell by 13 Megatons, but the resultant warming does not show up in the average anomalous global temperatures for the 1930’s because of the cooling from the two VEI5 (1932, 1933) and six VEI4 (1931, 1931, 1932, 1933, 1933, 1937) eruptions that occurred during those years].
An occurrence similar to the 1877-78 warming happened in August 2003, when a high-pressure system stalled over western Europe, primarily over France. This allowed the anthropogenic SO2 aerosols within the area to settle out, cleansing the air and allowing temperatures to rise. Since factories in France routinely shut down in August for vacations, there were essentially no replacement SO2 aerosol emissions, and local temperatures climbed, reaching 40°C. (104 °F) and causing almost 15,000 deaths in France alone (approx. 23,500 overall).
(A stalled low pressure system could also have temperature increases for the same reason).
The 1997-1998 El Nino is another example of higher temperatures being caused by a reduction in SO2 aerosol emissions into the troposphere. In this instance, due to global Clean Air efforts, between 1996 and 1997 anthropogenic SO2 aerosol emissions fell by a reported 7.7 million tons. This cleansing of the air, along with volcanic recovery warming from the 1994 Rabaul eruption, caused anomalous average Jan-Dec global temperatures to rise by 0.33 °C, from 1996 to 1998 (per both Hadcrut4 and GISS).
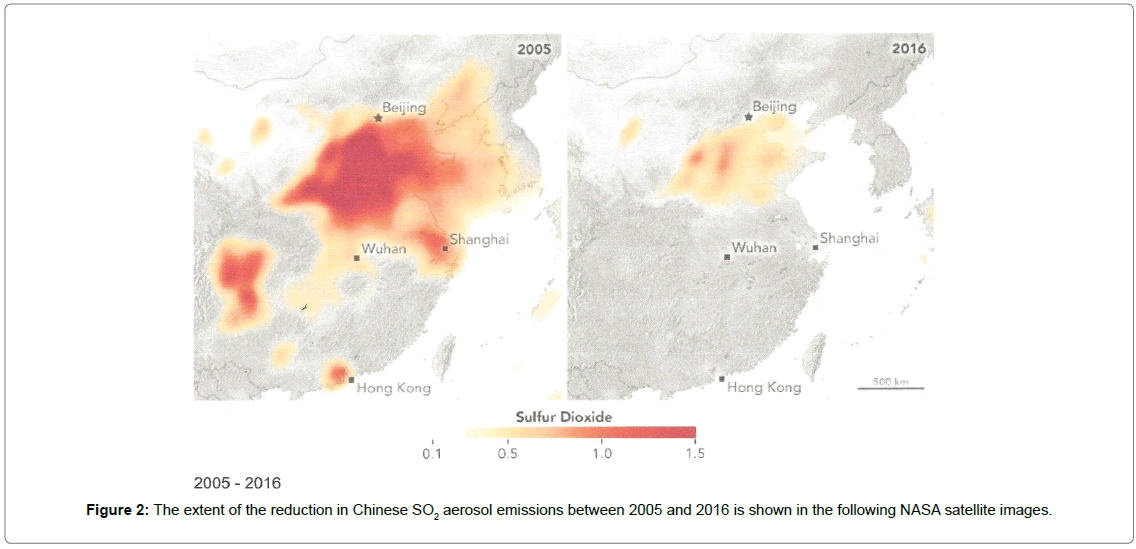
The 2014-2016 El Nino was also caused by a massive reduction in the amount of anthropogenic SO2 aerosol emissions. Although data on worldwide SO2 emissions beyond 2014 is currently not available, EPA data for the United States shows a reduction of 2 Megatons between 2014-16; a projected Gothenburg target of 2.5 MT reduction between 2014-2016 for European emissions (no longer being tracked), and a completely unexpected reduction of approx. 29 Megatons for China [5,6]. All in all, total reductions for 2014-2016 probably exceeded 35 MT, and easily explains the anomalous average 2016 global Jan-Dec Hadcrut4 temperature increase of 0.80°C. (0.99°C., per GISS 1200 km fill-in data).
The extent of the reduction in Chinese SO2 aerosol emissions between 2005 and 2016 is shown in the following NASA satellite images Figure 2:
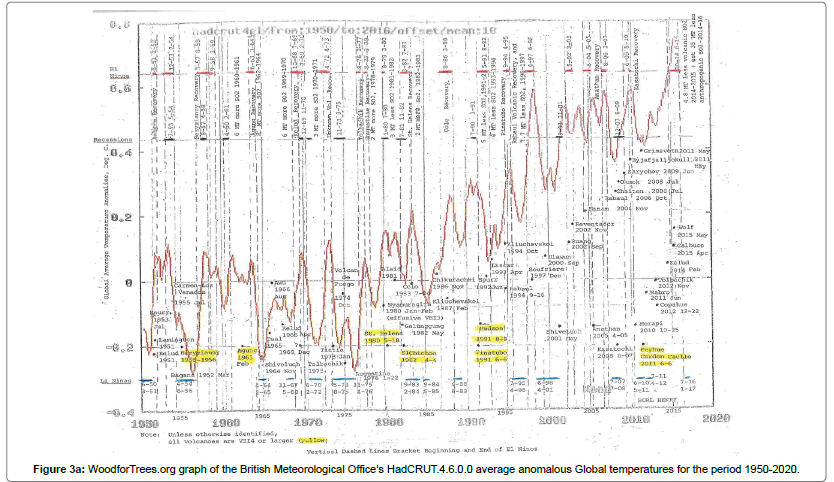
Figure 3 is similar to Figure 1, but is for the period 1950-2020. In this graph, temporary increases in average global temperatures are also shown to occur when there are net reductions in global anthropogenic SO2 aerosol emissions due to global clean air efforts. As noted earlier, these emissions peaked at ~136 Megatons in 1979, and by 2014, they had fallen to ~111 Megatons, with the 25 Megaton decrease (along with some natural warming due to recovery from the end of the LIA cooling) being the cause of all of the anomalous warming that has occurred since circa 1975.
The “rule of thumb”, or climate sensitivity factor, for temperature changes due to changes in the amount of global SO2 aerosol emissions is ~0.02°C. of warming (or cooling) for each net Megaton of change in global SO2 aerosol emissions.
This factor was obtained from the nearly simultaneous eruptions of Mt. Pinatubo and Mt. Hudson (1991), which injected ~22 Megatons of SO2 aerosols into the stratosphere and caused about 0.45 °C. of global cooling, or ~.02 °C of cooling for each Megaton of reduction in atmospheric SO2 aerosol emissions.
With respect to anthropogenic SO2 aerosols, the 25 Megaton reduction between 1976 and 2014 resulted in an average global Jan- Dec anomalous temperature rise of 0.52°C (per Hadcrut4), which is an identical .02 °C of temperature change for each Megaton of change in SO2 aerosol emissions.
(Although anthropogenic aerosols quickly wash out of the atmosphere, most are from quasi-continuous sources, such as power plants, factories, smelters, home heating units, foundries, etc., and are quickly replaced, so that their effective lifetimes far exceed those injected into the stratosphere by volcanic eruptions).
With the same factor being obtained from both volcanic and anthropogenic SO2 aerosols, its application can confidently be used to determine what temperature change to expect for a given change in SO2 aerosol emissions.
As an example, between 1976 and 2011, anthropogenic SO2 aerosol emissions fell by 21 Megatons. 0.02 x 21= an expected temp of rise of 0.42 °C. The reported Hadcrut4 temp. was 0.43 °C.
[To obtain this accuracy, the effect of temporary warming due to an El Nino must be taken into consideration (none in 2011)].
The fact that average global temperatures can be precisely predicted simply from changes in the amount of SO2 aerosol emissions is proof that there is NO additional warming from the accumulation of CO2 or other “greenhouse gasses” in the atmosphere!
As for Figure 1, all VEI4 and higher eruptions are shown. As would be expected, their climatic effects can vary due to differing amounts of SO2 aerosol emissions, plume altitudes, geographical locations, existing ENSO temperatures, etc.
(It should also be noted that, because of simultaneous volcanic eruptions and recoveries, and clean air reductions, the cause of some temperature excursions are not always clearly identifiable).
The following Tables 1-3 summarize observations from the graphs on Recessions, El Ninos, and La Ninas.
Table 1 lists the recessions/depressions since 1850. Of the 34 that have occurred, 15 are associated with an El Nino (with some being enhanced by “volcanic recovery” warming). The others either occurred before anthropogenic SO2 levels had risen, during the cooling period following a volcanic eruption, or because of increased anthropogenic SO2 aerosol emissions, where the cooling precluded any El Nino formation.
| Recession-Induced EL NINOS | ||
|---|---|---|
| Recession-induced El Nino | Reason for no El Nino | |
| Dates of recessions | El Nino Dates | More SO2 |
| 1853 Nov-1854 Dec | Shiveluch 1854 Feb eruption | |
| 1857 Jun-1858 Dec | Volcan de Fuego 1857 Jan | |
| 1860Oct-1861 Jan | 1862 | |
| 1865 Apr-1867 Dec | 1867-1869 | |
| 1869 Jun-1870 Dec | Unidentified 1868 or 1869 eruption | |
| 1873 Oct-1879 Mar | Suwanosejimsa, Cotopaxi, Agung | |
| 1882 Mar-1885 May | 1885 | |
| 1887 Mar-1888 Apr | 1888-1889 | |
| 1890Jul-1891 May | 1891 | |
| 1893 Jan-1894 Jun | Calbuco 1893 Jan | |
| 1895 Dec-1897 Jun | 1896-1897 | |
| 1899 Jun-1900 Dec | 1899 Dec-1900 Oct | |
| 1902 Sep-1904 Aug | *1902 Apr-1903 Apr | |
| 1907 May-1908Jan | Ksudach 1907 May (VEI5) | |
| 1910Jan-1912 Jan | 1910 Nov-1912 May | |
| 1913 Jan-1914 Dec | 1913 Oct-1914 Apr | |
| 1918 Aug-1919 Mar | *1918 Aug-1919 Sep | |
| 1920Jan-1921 Jul | Manam 1919 May | |
| 1923 May-1924 Jul | 1923 Aug-1924 Mar | |
| 1926 Oct-1927 Nov | 1925 Jul-1926 Aug | |
| 1929 Aug-1933 Mar | 1930 Jun-1931 Jul | |
| 1937 May-1938 Jun | Rabaul 1937 May | |
| 1945 Feb-1945 Oct | Avachinsky 1945 Feb | |
| 1948 Nov-1949 Oct | Ambrym 1950 Jan | |
| 1953 Jul-1954 May | 1953 Dec-1954 Feb | |
| 1957 Aug-1958 Sep | 1958 Sep-1959 Mar | |
| 1960 Apr-1961 Feb | 6 MT more S02, 1960-1961 | |
| 1969 Dec-1970 Nov | *1969 Oct-1970 Nov | |
| 1973 Nov-1975 Mar | volcano de Fuego 1974 Oct | |
| 1980 Jan-1980 Jul | 1979-Dec-1980 Oct | |
| 1981 Jul-1982 Nov | 1982 Mar-1983 Jul | |
| 19901o1-1991 Mar | 1991 Nov-1993 Aug | |
| 2001 Mar-2001 Nov | 2002 May-2003 Mar | |
| 2007 Dec-2009 Jun | 2009 Jun-2010 May | |
Table 1: The temporary warming caused by a recession results In an El Nino unless it occurs during the cooling period following a VEI4 or larger eruption, which forms a to Nina, or because of increased levels of anthropogenic SO2 emissions. The time to the onset of an El Nino after a recession begins varies because of differing ENSO temperatures at that time, with a median time of about 10 months. *Volcanic Recovery El Nino (enhanced by the recession-induced warming).
Table 2 lists the causes of the 46 El Ninos reported since 1850. About half (26) are attributed exclusively to “volcanic recovery” warming, 10 exclusively to recessions [although some may have been coincident with extended periods (>3-4 years) between VEI4 eruptions, where all volcanic aerosols had settled out, causing warming for that reason-see between 1890-1900, for example], 2 exclusively to reduced anthropogenic SO2 aerosol emissions and with the balance occurring during a recession with possible concurrent “volcanic recovery” warming. In all instances, they were caused by decreased quantities of SO2 aerosols in the atmosphere.
| EL NINO causes | |||
|---|---|---|---|
| Dates of El Winos | Recession | Volcanic recovery warming | Anthropogenic SO2 |
| 1850 | ?Formate! 1846 Oct (V614?) | ||
| 1852-1853 | Unidentified 1851 Jul | ||
| 1857-1859 | ?Komaga-Take 1856 Sep | ||
| 1860 | ?Fuego 1857 Jan (VEI4?) | ||
| 1862 | ?Makian 1861Jan (VEI4?) | ||
| 1864 | Makian 1862 Cont. (VE14?) | ||
| 1865-1866 | Unidentified 1862/63 eruption | ||
| 1867-1869 | Unidentified 1866 Sep | ||
| 1877-1878 | 1873 Oct-1879 Mar | Askja 1875 Mar (VEl5) | |
| 1880 | Suwanosejlma/Cotppaxi (1877) | ||
| 1885 | Krakatoa 1883 Aug (VEI6) | ||
| 1888-1889 | Tarawera 1886 Jun (VEl5) | ||
| 1891 | 1890 Jul-1891 May | ||
| 1896-1897 | 1895 Dec-1897 Jun | ||
| 1899 Dec-1900 Oct | 1899 Jun-1900 Dec | ||
| 1902 Apr-1903 Apr | 1902 Sep-1904 Aug | ||
| 1904 Oct-1906 Apr | Santa Maria 1902 Oct (VEI6) | ||
| 1911 Oct-1912 Sep | 1910Jan-1912 Jan | ||
| 1913 Oct-1914 Apr | 1913 Jan-1914 Dec | ||
| 1914 Nov-1915 Aug | Novarupta 1912 Jun (VEI6) | ||
| 1918 Aug-1919 Sep | 1918 Aug-1919 Mar | ||
| 1923 Aug-1924 Mar | 1923 May-1924 Jul | ||
| 1925 Jun-1926 Aug | Ralkoke 1924 May | ||
| 1930 Jun 1931 Jul | 1929 Aug-1933 Mar | ||
| 1939 Nov-1940 Jun | 1937 May-1938 Jun | Rabual 1937 May | |
| 1940 Oct-1942 Mar | 7 MT less, 1940-42 | ||
| 1951 Jun-1952 Feb | 1948 Nov-1949 Oct | Ambrym 1950Jan | |
| 1953 Dec-1954 Feb | 1953 Jul-1954 May | Bagana 1952 Mar | |
| 1957 Mar-1959 Aug | 1957 Aug-1958-Apr | Bezymianny 1956 Mar (VEI5) | |
| 1963 Jun-1964 mar | Agung 1963 Mar (VEI5) | ||
| 1968 Oct-1969 Jul | Kelud 1966 Apr | ||
| 1969 Jul-1970 Feb | 1969 Dec-1970 Nov | 6 MT less, 1969-70 | |
| 1972 Apr-1973 Apr | Unidentified 1969 Dec eruption | ||
| 1976 Aug-1977 Mar | Tolbachik 1975 Jul | ||
| 1977 Aug-1978 Mar | Augustine 1976Jan | ||
| 1979 Sep-1980 Mar | Unidentified 1977 Aug | ||
| 1982 Mar-1983 Jul | 1981 Jul-1982 Nov | El Chichon 1982 Apr (VEI5) | 3 MT less, 1981-42 |
| 1986 Aug-1988 Mar | Nevado del Ruiz 1985 Sept | ||
| 1991 Apr-1992 Jul | 1990 Jul-1991 Mar | Kelud 1990 Feb | |
| 1994 Aug-1995 Apr | Pinatubo (VEI6)/Hudson VEI5) 1991 Jun/Aug | ||
| 1997 Apr 1998 Jun | 7.7 MT less, 1996-97 | ||
| 2002 May-2003 Mar | 2001 Mar-2001 Nov | ||
| 2004 Jun-2005 May | Nyamuragira 2002 Jul | ||
| 2006 Aug-2007 Feb | Anathan 2005 Apr | ||
| 2009 Jun-2010 Apr | 2007 Dec-2009 Jun | Kasachotl 2008 Aug | 5MT less, 2008-09 |
| 2014 Oct-2016Jun | est 35 MT less, 2014-2016 | ||
Table 2: Of the 46 identified El Ninos, all were associated with reductions in atmospheric SO2 levels, either due to a recession, 'Volconic recovery" warming, or Clean Air Activities. The "volcanic recovery” warming generally occurs within 18-24 months of an eruption.
Table 3 is a listing of the causes of the La Ninas. Of the 31 identified on the graphs, all correlated with increases in atmospheric SO2 levels, primarily due to volcanic eruptions. Volcanic La Nina formations lag the date of an eruption (as would be expected) by an average of 15 months. They do not occur randomly.
| LA NINA causes | ||
|---|---|---|
| Dates of La Ninas | Volcano and (VEI) | Anthropogenic SO2 |
| 1857 | Komanga-Take 1856Sep (4) | |
| 1863 | Maklan 1861 Dec (4) | |
| 1872-1876 | Sinarka 1872 'Jun' (4) | |
| 1872-1876 | Merapi 1872 Apr (4) | |
| 1872-1876 | Grimsvotn 1873 Jan (4) | |
| 1872-1876 | Askja 1875 Mar (4) | |
| 1879-1880 | Swanosejima 1877 "Jun" (4) | |
| 1886-1887 | Krakatoa 1883 Aug (6) | 4 MT more, 1885-88 |
| 1889-1890 | Banbai 1888 Jul (4) | |
| 1892-1893 | Colima 1890 Feb (4) | |
| 1898 | Mayon 1897 | |
| 1903-1904 | Santa Maria 1902 Oct (6) | |
| 1908 Sep-1911 Jul | ksudach 1907 Mar (5) | |
| 1916 Jun-1917 Apr | ?Novarupta 1912 Jun (6) | 5 MT more, 1915-17 |
| 1916 Jun-1917 Apr | Colima 1913 Jun (5) | |
| 1917 Jun-1917 Apr | Sakurajima 1914 Jan (4) | |
| 1918 Jun-1917 Apr | Tungurahua 1916 Apr (4) | |
| 1924 Jul-1925 Mar | Raikoke 1924 Feb (4) | |
| 1933 May-1934 May | Cerro Azul 1932 Apr (6) | |
| 1933 May-1934 May | Kharimkotan 1933 Jan (5) | |
| 1938 May-1939 Jun | Rabaul 1937 May (4?) | 3 MT more, 1937-39 |
| 1942 Jun -1943 May | Tolbachik 1941 May (3) | 2 MT more, 1941-43 |
| 1945 Jun-1945 Dec | Paricutin 1943 May (4) | |
| 1949 Aug-1951 Apr | Villarica 1948 Oct (3) | 9 MT more, 1949-51 |
| 1954 Apr-1956 Jun | Bagana 1952 Mar (4) | 10 MT more, 1954-56 |
| 1954 Apr-1956 Jun | Spurr 1953 Dec (4) | |
| 1964 Apr-1965 Feb | Agung 1963 Jun (5) | |
| 1967 Nov-1968 May | Kelud 1966 Apr (4) | 4 MT more, 1967-68 |
| 1967 Nov-1968 May | Awu 1966 t Aug (4) | |
| 1970 Jun-1972 Feb | Fernandina 1968 Jul (4) | 3 MT more, 1970-72 |
| 1973 Apr-1976 May | Tia Tia 1973 Jan (4) | 6 MT more, 1972-73 |
| 1975 Nov-1976 Apr | Volcan de Fuego 1974 Oct (4) | 6 MT more, 1975-76 |
| 1983 Aug-1984 Feb | El Chichon 1982 Apr (5) | |
| 1984 Sep-1985 Jul | Colo 1983 Jul (4) | 2 MT more, 1984-85 |
| 1988 Apr-1989 Jun | Kliuchesko 1987 Feb (4) | |
| 1995 Jul-1996 Apr | Rabaul 1994 Sep (4?) | |
| 1998 Jun-2001 Apr | Nyamuragira 1998 Oct (4?) | 4 MT more, 1997-98 |
| 2007 Jul-2008 Jul | Rabaul 2006 Oct (4) | |
| 2010 May-2012 Apr | Sarychev 2009 Aug (4) | 2 MT more, 2010-11 |
| 2010 May-2012 Apr | Eylafiallajohull 2010 Mar (4) | |
| 2016 Jul-2017 Jan | Calbuco 2015 Apr (4) | |
| 2017 Sep-2018 Apr | ||
Table 3: Although most years have multiple eruptions, La Ninas appear to be associated only with VEI4 or larger eruptions. Eruptions occurring during an El Nino, such as Pinatubo (VEI6) rarely produce enough cooling to overcome the El Nino warming and cause a La Nina. On average, a La Nina forms about 15 months after an eruption.
Figure 3a (above) examines the period 1970-2018 in greater detail, with respect to the effects of VEI4-VEI6 volcanic eruptions. This graph differs from the previous graphs in that there is less smoothing of the data, allowing each eruption to be precisely located and its climatic effect to be observed. A listing of the plume altitude and Megatons of SO2 emissions is included for the majority of the eruptions [4].
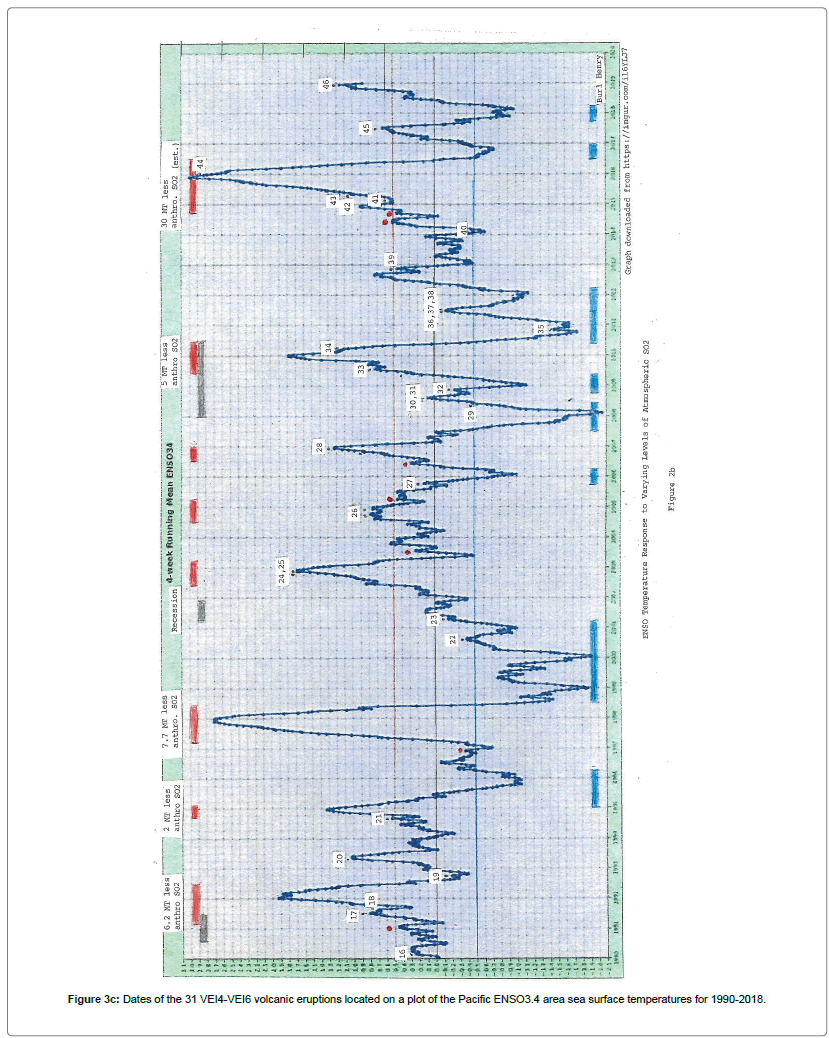
Figure 3b (above) is a similar graph, which locates the dates of the 31 VEI4-VEI6 volcanic eruptions on a plot of the Pacific ENSO-area sea surface temperatures for 1990-2018. There were also 29 reported VEI3 eruptions for the period, but only 7 (red dots) left a detectable peak-possibly underreported VEI4 eruptions).
As can be noted, all of the significant changes in ENSO temperatures (which strongly affect global temperatures) occurred because of changing levels of SO2 emissions in the atmosphere, of either volcanic or anthropogenic origin.
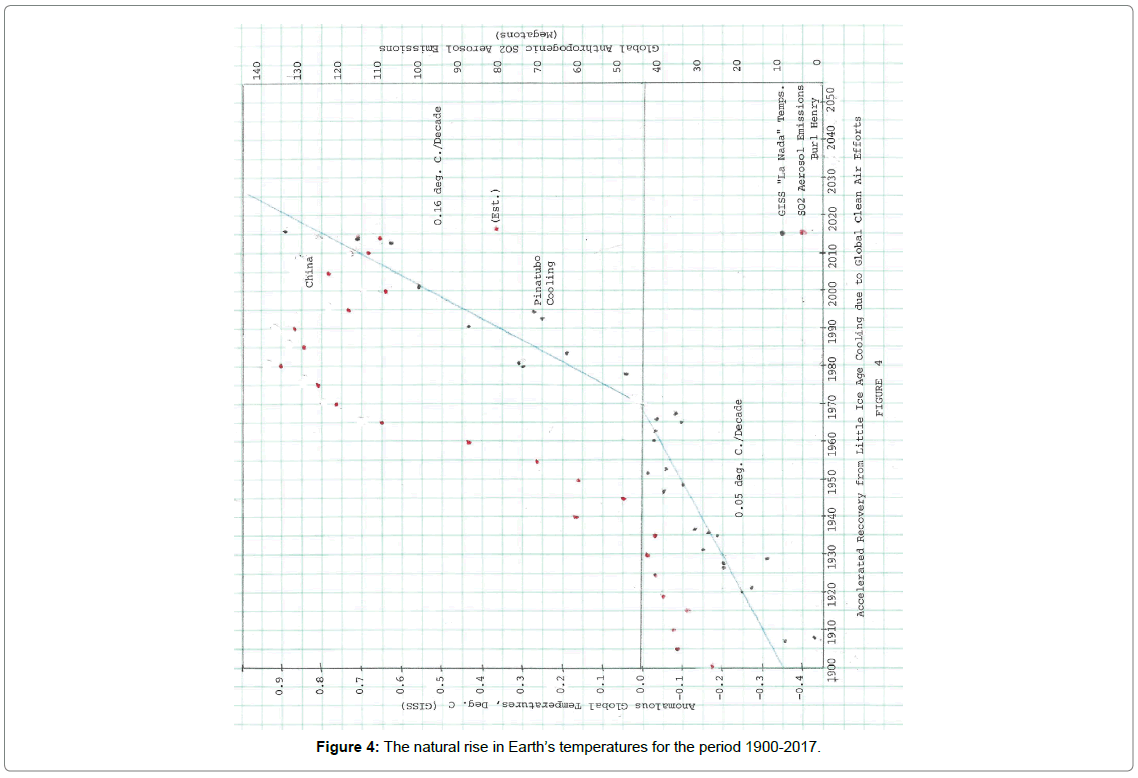
The natural rise in earth’s temperatures for the period 1900-2017 is shown in Figure 4, which plots the average global temperatures for those years without an El Nino or a La Nina to affect temperatures (a ”La Nada”). Up until about 1970, the warming rate was ~ 0.05 °C/ decade. Afterwards, the warming rate increased to about 0.16 °C / decade, because of the cleaner air due to reductions in the amounts of anthropogenic SO2 aerosol emissions.
(A projection of the 1900-1970 natural warming rate is shown by the dashed line on Figure 2a, reaching 0.2 °C. at 2015).
As was discussed in the summary for Table 2, all El Ninos are caused by reductions in the amount of SO2 aerosols in the atmosphere, which enhances the intensity of the sun’s radiation striking the Earth’s surface.
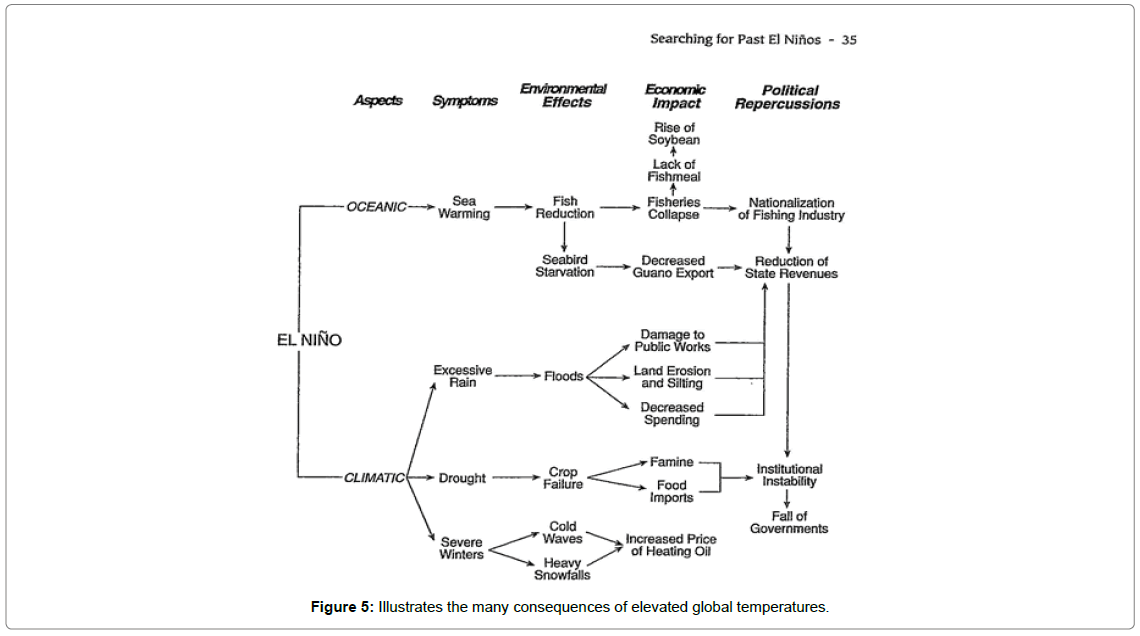
Figure 5, from the book “El Nino in History” (2001), by Cesar N. Caviedes (with permission) illustrates the many consequences of elevated global temperatures resulting from an El Nino, such as changed weather patterns, increased storminess, heat waves, droughts, forest fires, cold waves, localized heavy rainfall, flooding, etc.
Although based upon El Ninos prior to year 2001, current average global temperatures are even higher now, than they were then, and we are seeing more of their disastrous effects.
The following table is a compilation of the climatic effects of all of the El Ninos since 1850, and they are surprisingly uniform. With respect to the 12 months prior to an El Nino, they increase average global temperatures in the narrow range of only 0.0 to 0.2 °C, with few (usually explainable) exceptions Table 4.
| El Nino characteristics, 1850-2018 | ||||
|---|---|---|---|---|
| Dates | Avg. Temp during El Nino (Deg. C.) | AvgJ-D Temp. 12 Mo. Prior | El Nino Delta | Max. Temp during El Nino |
| 1850 | ? | ? | ? | 12.4 |
| 1852-53 | ? | 14 | -0.1 | 13.9 |
| 1857-59 | ? | 13.6 | 0.3 | 13.9 |
| 1860 | ? | 13.7 | 0.1 | 13.8 |
| 1862 | ? | 13.6 | 0.2 | 13.8 |
| 1864 | ? | 13.7 | 0 | 13.7 |
| 1865-66 | ? | 13.5 | 0.6 | 14.1 |
| 1867-69 | ? | 13.7 | 0.4 | 14.1 |
| 1877-78 | ? | 13.6 | 0.8 | 14.4 |
| 1880 | ? | 13.8 | 0.2 | 14 |
| 1885 | ? | 13.4 | 0.6 | 14 |
| 1888-89 | ? | 13.6 | 0.4 | 14 |
| 1891 | ? | 13.9 | 0.1 | 14 |
| 1896-97 | ? | 13.8 | 0.2 | 14 |
| 1899 Dec-1900 Oct | 13.9 | 13.8 | 0.1 | 14.1 |
| 1902 Apr-1903 Apr | 13.7 | 13.6 | 0.1 | 14 |
| 1904 Oct-1906 Apr | 13.7 | 13.5 | 0.2 | 14 |
| 1913 Oct-1912 Sep | 13.8 | 13.5 | 0.3 | 13.9 |
| 1913 Oct -1914 Apr | 13.8 | 13.5 | 0.3 | 14 |
| 1914 Nov-1915 Aug | 13.9 | 13.8 | 0.1 | 14 |
| 1918 Aug-1919 Sep | 13.8 | 13.6 | 0.2 | 14 |
| 1923 aug-1924 Mar | 13.9 | 13.7 | 0.2 | 14 |
| 1925 Jul-1926 Aug | 13.9 | 13.7 | 0.2 | 14.1 |
| 1930 Jun-1931 Jul | 13.9 | 13.8 | 0.1 | 14.2 |
| 1939 Nov-1940 Jun | 14.1 | 14.1 | 0 | 14.2 |
| 1940 Aug-1942 Mar | 14.2 | 14.1 | 0.1 | 14.3 |
| 1951 May- 1952 Feb | 14 | 13.8 | 0.2 | 14.1 |
| 1953 Jan-1954 Mar | 14 | 14 | 0 | 14 |
| 1957 Mar-1958 Aug | 14.1 | 13.3 | 0.8 | 14.4 |
| 1958 Oct-1959 Apr | 14.1 | 14.1 | 0 | 14.2 |
| 1963 Mar-1964 Mar | 14 | 14 | 0 | 14.3 |
| 1965 Apr- 1966 May | 13.9 | 13.8 | 0.1 | 14 |
| 1968 Sep-1969 Jun | 14 | 13.9 | 0.1 | 14.2 |
| 19699 Jul-1970 Feb | 14.1 | 14 | 0.1 | 14.3 |
| 1972 Apr-1973 Apr | 14.1 | 13.9 | 0.2 | 14.3 |
| 1976 Aug-1977 Mar | 14.1 | 13.9 | 0.2 | 14.2 |
| 1977 Aug-1978 Feb | 14.1 | 13.9 | 0.2 | 14.2 |
| 1979 Sep-1980 Mar | 14.3 | 13.9 | 0.4 | 14.5 |
| 1982 Mar-1983 Jul | 14.2 | 14.3 | -0.1 | 14.5 |
| 19886 Aug-1988 Mar | 14.3 | 14.2 | 0.1 | 14.6 |
| 1991 Apr-1992 Jul | 14.4 | 14.4 | 0 | 14.5 |
| 1994 Aug-1995 Apr | 14.4 | 14.2 | 0.2 | 14.8 |
| 1997 Apr-1998 Jun | 14.4 | 14.3 | 0.1 | 14.9 |
| 2002 May-2003 Mar | 14.6 | 14.6 | 0 | 14.8 |
| 2004 Jun-2005 Mar | 14.6 | 14.6 | 0 | 14.7 |
| 2006 Aug-2007 Feb | 14.7 | 14.7 | 0 | 14.9 |
| 2009 Jun-2010 Apr | 14.7 | 14.7 | 0 | 14.8 |
| 2014 Oct-2016 Jun | 14.9 | 14.7 | 0.2 | 15.3 |
Table 4: All Temperatures are with respect to the 'best estimate of (the) absolute global mean for 1951-1980 (which) Is 14.0 °C., using NASA 6155 data, 1880-present Earlier data Is from Hadcrut4, which Is with respect to 1961-1990, but whose average is also 14.0 °C.
Of greatest concern is the fact that, since 2002, there is no difference in average global temperatures prior to an El Nino, and during the El Nino. Thus, globally, we have been living within El Nino-like temperatures, and all of the weather-related disasters since then can be attributed to our elevated temperatures.
Examination of the wikipedia “List of natural disasters in the United States, 1816-2017 shows that since 2000, in the United States, alone, there were 37 weather-related disasters, with 14 of them happening during the very strong 2014-2016 El Nino, 1 during the 2009-10 El Nino, 2 during the 2006-07 El Nino, 6 during the 2004-05 El Nino, and 2 during the 2002-03 El Nino. The remaining 12 happened simply because of the higher El Nino-like temperatures.
For the preceding 17 years (1983-2000), there were only 16 occurrences (7 El Nino related), and for 1966-1983, only 7 (6 El Nino related). It is obvious that, as temperatures have risen, the occurrence of weather-related disasters has greatly increased.
Earth’s elevated temperatures can easily be reduced by the judicious re-introduction of SO2 aerosols into the atmosphere, until the desired level of cooling is achieved. The hundreds of billions of dollars now being wasted annually in an effort to reduce or control harmless CO2 emissions might better be spent in providing air purifiers for homes, schools, and workplaces until mitigation strategies can be developed and implemented [5-8].
Conclusions
It is abundantly clear that changing concentrations of atmospheric SO2 aerosol emissions are the control knob for earth’s temperatures (in the absence of any significant changes in solar output, which so far has not been observed by any satellite observations).
The earth began naturally warming up after the end of the little ice age, as the atmosphere cleared of its dimming volcanic SO2 aerosol emissions, heading toward temperatures experienced during the Medieval and Roman warm periods.
However, the roughly concurrent beginning of the industrial revolution introduced anthropogenic SO2 aerosols into the atmosphere, largely replacing the earlier volcanic SO2 emissions, and limiting the rate and amount of natural warming that could occur.
(If it were not for the burning of fossil fuels and their attendant SO2 aerosol emissions, we would now be experiencing much higher temperatures than those that are occurring. As it is, average global temperatures are now equivalent to those previously seen only during El Ninos, so that we are now routinely experiencing the weather-related effects associated with their occurrence).
Because of their profound effect upon earth’s climate, random volcanic eruptions will make it impossible to predict future temperatures with any great accuracy. We can, however, recognize that, apart from anthropogenic activity, temperatures will rise when there is little or no VEI4 or larger volcanic activity, and temporarily fall when large eruptions occur. This predictive ability should be helpful for weather forecasters, growers, the insurance industry, etc.
Thus, management of global anthropogenic SO2 aerosol emissions could be used to regulate our climate to some degree, increasing them during warming periods, and decreasing them during cooling periods.
Note: Anthropogenic SO2 aerosol emissions, along with the other gaseous pollutants, are currently being tracked by the Community Emissions Data System (CEDS) team at the University of Maryland and are presently available through 2014. References to quantities of SO2 emissions in the text, on the graphs, and in the Tables are from their data, except as previously noted for 2014-2016.
References
- Rosenthal Y, Linsley BK, Oppo DW (2013) Pacific heat content during the past 10,000 years. Sci 342: 617-621.
- Miller GH, Geirsdottir A, Zhong Y, Larsen DJ, Otto-Bliesner BL (2012) Abruptonset of the little ice age triggered by volcanism and sustained by sea-ice/ocean feedbacks. Geophysical Research Letters Banner 39: 1-5.
- Siebert L, Simkin T, Kimberly P (2011) Volcanoes of the world, 3rd edition. University of California Press.
- Hoesly RM, Smith SJ, Feng L, Klimont Z, Janssens-maenhout G, et al. (2018) Historical (1750–2014) anthropogenic emissions of reactive gases and aerosols from the Community Emissions Data System (CEDS). Geosci Model Dev 11: 369-408.
Citation: Henry B (2019) Atmospheric SO2: Principal Control Knob Governing Earth’s Temperatures. Environ Pollut Climate Change 3: 170. DOI: 10.4172/2573-458X.1000170
Copyright: © 2019 Henry B. This is an open-access article distributed under the terms of the Creative Commons Attribution License, which permits unrestricted use, distribution, and reproduction in any medium, provided the original author and source are credited.
Select your language of interest to view the total content in your interested language
Share This Article
Recommended Journals
Open Access Journals
Article Tools
Article Usage
- Total views: 3562
- [From(publication date): 0-2019 - Nov 13, 2025]
- Breakdown by view type
- HTML page views: 2675
- PDF downloads: 887

