Association and Path Coefficient Analysis of Yield and Yield Attributes of Coffee (Coffea arabica L.) Under Sidama Specialty Coffee Growing Area, Awada, Southern Ethiopia
Received: 22-Aug-2017 / Accepted Date: 29-Aug-2017 / Published Date: 05-Sep-2017 DOI: 10.4172/2329-8863.1000307
Abstract
One hundred twenty germplasm collections of arabica coffee and four standard checks were evaluated for 19 quantitative traits using augmented design with four replications of the checks at Sidama specialty coffee ecology, Southern Ethiopia. The objective of the study was to address the nature of characters correlation and path coefficient among various quantitative traits. The result showed that in most of the traits, genotypic correlation coefficients were higher than the corresponding phenotypic correlation coefficients. Hundred green bean weight, stem diameter, canopy diameter, average length of primary branches, percent of bearing primary branches and leaf length were the most important traits which possessed positive association with coffee green bean yield. Likewise, path coefficient analysis was revealed that among the different yield contributing traits plant height, leaf length, leaf width, hundred green bean weight, percentage of bearing primary branches, stem diameter, average length of primary branches and coffee berry disease infestation influenced green bean weight directly and indirectly. Thus, selection for coffee green bean yield in coffee through these traits would be effective in order to boost the coffee production in Ethiopia.
Keywords: Coffea arabica; Coffee accession; Quantitative trait; Coffee green bean yield; Correlation and path coefficient
Introduction
Arabica coffee (Coffea arabica L.) belongs to genus Coffea and the Rubiaceae family and is an evergreen shrub of variable size. The coffee tree grows up to 8-10 m high and its branches are long, flexible and thin. Branches are semi-erect when young and spreading or pendulous when old [1]. A well-managed coffee tree can be productive for up to 80 years or more, but the economic life-span of a coffee plantation is rarely more than 30 years [2,3]. The one hundred three coffee species have been enumerated and all exclusively restricted to the tropical forests of Africa, Madagascar and Islands of the Indian Ocean [4].
Since, arabica coffee (Coffea arabica L.) is in Ethiopia, from altitudes between 1300 and 2000 m.a.s.l [2,5,6]. Currently, about 538466.80 ha area of land is devoted to coffee production in Ethiopia, from which 392006.222 tons is produced annually. Of these in South Nation Nationality of People Representative (SNNPR), 162767 ha are covered by coffee and 137347 tons is produced [7]. This region is the second largest producer and supplier of arabica coffee next to Oromiya [8,9]. Sidama and Gedio zones represent the major coffee growing and densely populated areas in the SNNPR. The coffee type of Ethiopia are known for their famous coffee types distinguished for their very fine quality, unique aroma and flavor characteristics known internationally by the brands and names, Yirgacheffe, Sidama, Harar, Limmu and Gimbi and they fetch a premium price [10,11].
The Ethiopian national coffee collection program, about 6,717 accessions have been collected from different coffee growing areas of the country and are being maintained at the Jimma Agricultural Research Center (JARC) and its sub-centers [12,13]. From this, Awada Agricultural Research Sub-Center (AARSC) is mandated to generate, develop and disseminate appropriate technologies on coffee for Southern part of Ethiopia and more than 1553 coffee landrace have been collected and maintained at Awada field genebank.
However, these Ethiopian collections are not yet fully evaluated and it is expected that other coffee plants with interesting coffee varieties which can meet the consumer demand. When breeders attempt to improve coffee productivity, they are generally interested in upgrading several attributes of the phenotype simultaneously. Moreover, yield is a complex trait and considered in most, if not all, breeding goals of coffee improvement. It is desirable to know the direct and indirect effect of yield related traits on bean yield in coffee.
But, apart from very few observations no information has been generated to enable the systematic addressing of the genetic potential of coffee germplasm collected from the Sidama Zone. Furthermore, elucidation of the extent and nature of interrelationships prevailing among different traits could help in formulating efficient scheme of multiple trait selection, as it provides information on direct and indirect effects of component characters on the economically important trait. Such an intensive and extensive study can also justify the economic benefits of the high cost of ex-situ maintenance of such a large collection. Therefore, the objective of this study was proposed with to address the nature of traits correlation at phenotypic and genotypic level and their direct and indirect effect of traits on coffee yield and yield components.
Materials and Methods
Experimental site
The field experiment was conducted at Awada Agricultural Research Sub-Center (AARSC), in 2013 cropping season. AARSC is found 45 km South of Hawassa in Sidama Zone and is located at 6°3'N Latitude and 38°E Longitude at an altitude of 1750 m.a.s.l. The area receives an annual minimum and maximum rainfall 858.1 and 1676.3 mm, respectively. The annual average minimum and maximum air temperatures are 11.0°C and 28.4°C, respectively. The major soil types of the center are eutric-nitosol and chromotic-cambisols that are highly suitable for coffee production [14].
Treatments and experimental design
The treatments consisted of 120 coffee land race collected from Sidama Zone (Dale and Aleta Wondo Woredas) and field established in 2006 at the AARSC. These coffee land races collected from different agro-ecologies of Dale and Aleta Wondo Woredas since 2005. Moreover, four released varieties (75227,744,7440 and 1377) were included as standard checks for the study (Appendix 1). The experiment was laid down in the field using augmented design, which is used with replicated checks to assess the performance of nonreplicated accession in complete block designs in four blocks [15]. A single row consisting of ten trees per plot and plant-to-plant spacing used was two meters by two meters, while spacing between blocks was four meter. The recommended agronomic practices were uniformly and properly applied for nursery and field operations.
Data collected
During the time of this study, data on 19 quantitative characters, namely: plant height (cm), stem diameter (cm), number of main stem nodes (no), angle of primary branches (degrees), canopy diameter (cm), average inter node length of main stem (cm), average length of primary branches (cm), number of primary branches (no), number of secondary branches (no), percentage of coffee bearing primary branches (%), leaf length (cm), leaf width (cm), leaf area (cm2), fruit length (mm), hundred green bean weights (g), green bean yield per tree (g), bean length (mm), coffee berry disease (%) and coffee leaf rust (%) were recorded from each accession using the standard procedures of International Plant Genetics Resource Institute [16].
Statistical analysis
Association studies: The correlation coefficients were worked out to determine the degree of association of a character with yield and also among the yield components.
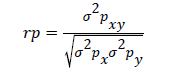
Where, rp=phenotypic correlation coefficient, σ2pxy=Phenotypic covariance between character x and y, σ2px=Phenotypic variance for character x and σ2py=Phenotypic variance for character y
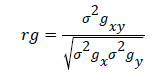
Where, rg=Genotypic correlation coefficient, σ2gxy=Genotypic covariance between character x and y, σ2gx=Genotypic variance for character x and σ2gy=Genotypic variance for character y.
The coefficient of correlation at phenotypic level was tested for its significance with table for simple correlation coefficient using n-2 df or using‘t’ table, with observed t expressed as
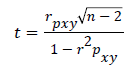
The calculated ‘t’ value was compared with the tabulated ‘t’ value at n-2 degree of freedom, (n=124) at 5% and 1% level of significance (where n is the number of genotypes).
The coefficient of correlation at genotypic level was tested the formula:-
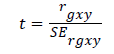
Where rgxy=genotypic correlation coefficient, SErgxy=standard error genotypic correlation coefficient
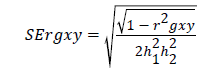
Where h12 and h22 are broad sense heritability for the character 1 and 2
Path analysis: Path coefficient analysis was carried out for each population separately by using the correlation coefficients to know the direct and indirect effects of the components on yield. The formula: rij= Pij+Σrikpkj
where, rij=Mutual association between the independent character (i) and dependent character (j) as measured by the genotypic correlation coefficient, Pij=Component of direct effects of the independent character (i) and dependent character (j) as measured by the genotypic path coefficient and Σrikpkj=Summation of components of indirect effect of a given independent character (i) on the given dependent character (j) via all other independent character (k).
The residual effect (h) was estimated by the following formula:-
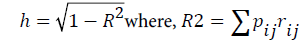
Pij=Component of direct effects of the independent character (i) and dependent character (j) as measured by the path coefficient.
rij=Mutual association between the independent character (i) and dependent character (j) as measured by the correlation coefficient.
Results and Discussion
Phenotypic and genotypic correlation
Phenotypic correlation: the result was showed that coefficients were lower than the genotypic correlation coefficients for most of the traits (Table 1) which could be a result of modifying effect of environments on the association of the characters lower than the inherent genetic effects. This may indicate that the effects due to the environmental variance and covariance are lower than genetic variance for the characters studied. The result agrees with that of the researcher who have reported that phenotypic correlations were in most cases lower than the corresponding genotypic values [17-19]. Average green bean yield exhibited positive and significant correlation with hundred green bean weight, stem diameter, angle of primary branch, canopy diameter, average length of primary branches, percent of bearing primary branches, leaf length and bean width, suggesting that yield per plant would increase with increase of these characters (Table 1).
On the other hand, the characters, plant height, average inter node length of stem, number of primary branches; number of secondary branches, leaf area, and fruit length were positively correlated and nonsignificant difference with average green bean yield, at phenotypic level. This is in agreement with the findings of that average green bean yield exhibited significant and positive association with plant height, stem girth, number of primary branches, canopy diameter and average length of primary branches [20]. However, in contrast to the current results that the phenotypic correlation of bean yield with all morphological characters was non-significant [19]. Leaf width, coffee berry disease and coffee leaf rust reaction had negative and nonsignificant phenotypic correlation with green bean yield.
Genotypic correlation: The result of genotypic correlation coefficients between 19 quantitative characters are given in Table 1. These were estimated as they elucidate true association by excluding the environmental influence. In most instances the genotypic correlation was found to be higher in magnitude than phenotypic correlation, although statistically non-significant due to the high standard error of the genotypic correlation. Higher genotypic correlation may be due to the absence of masking or modifying effect of environment on the genetic association among traits [21]. Average green bean yield has exhibited non-significant and positive genotypic correlation with hundred green bean weight, stem diameter, number of main stem nodes, angle of primary branch, canopy diameter, average length of primary branches, number of primary branches, number of secondary branches, percent of bearing branches, leaf length, fruit length, and bean width (Table 1). These results are in agreement with the results of that average green bean yield per tree had positive genotypic correlations with most of the characters which were considered in his study except leaf length, leaf width and leaf area [17].
| GBYT13 | HGBW | PH | STDIA | NMSTN | APBR | CANDIA | AvILMST | |
|---|---|---|---|---|---|---|---|---|
| GBYT13 | 0.45 | -0.05 | 0.23 | 0.13 | 0.28 | 0.07 | -0.14 | |
| HGBW | 0.29** | 0.12 | -0.22 | -0.27 | -0.09 | -0.25 | 0.19 | |
| PH | 0.04 | 0.13 | 0.04 | 0.49 | 0.41 | 0.12 | 0.98** | |
| STDIA | 0.19* | -0.09 | 0.09 | 0.26 | 0 | 0.14 | 0.09 | |
| NMSTN | -0.01 | -0.12 | 0.33** | 0.29** | 0.3 | 0.38 | 0.26 | |
| APBR | 0.15 | 0.02 | 0.43** | 0.06 | 0.21** | 0.2 | 0.39 | |
| CANDIA | 0.17* | -0.12 | 0.23** | 0.20* | 0.29** | 0.22** | 0.01 | |
| AvILMST | 0.01 | 0.167* | 0.92** | 0.07 | 0.16* | 0.35** | 0.11 | |
| AvLPB | 0.19* | -0.08 | 0.29** | 0.02 | 0.20* | 0.26** | 0.57** | 0.22** |
| NPB | 0.12 | 0.01 | 0.41** | -0.03 | 0.32** | 0.38** | 0.34** | 0.19* |
| NSB | 0.11 | -0.13 | 0.31** | 0.11 | 0.31** | 0.32** | 0.39** | 0.18* |
| PBPB | 0.15* | 0.05 | -0.34 | -0.09 | -0.24 | -0.2 | -0.17 | -0.2 |
| LL | 0.17* | 0.25** | 0.08 | -0.02 | 0.01 | -0.07 | -0.15 | 0.13 |
| LW | -0.14 | -0.13 | 0.21** | -0.13 | 0.01 | 0.21** | 0.22** | 0.18* |
| LA | 0.01 | 0.02 | 0.12 | -0.07 | 0 | 0.01 | 0.09 | 0.1 |
| FL | 0.11 | 0.27** | 0.03 | -0.11 | -0.14 | 0.06 | -0.1 | 0.05 |
| BW | 0.19 | 0.39** | 0.03 | 0.05 | 0.09 | 0.06 | 0.12 | 0.03 |
| CBD | -0.38 | -0.31 | 0.03 | 0.05 | 0.21** | 0.03 | -0.01 | -0.03 |
| CLR | -0.14 | -0.2 | -0.03 | -0.05 | -0.05 | 0.06 | -0.12 | -0.08 |
Table 1(a): Genotypic correlation coefficient (above diagonal) and phenotypic correlation coefficient (below diagonal) in coffee germplasm accessions used in the study at Awada (2013/14).
| AvLPB | NPB | NSB | PBPB | LL | LW | LA | FL | BW | CBD | CLR | |
|---|---|---|---|---|---|---|---|---|---|---|---|
| GBYT13 | 0.19 | 0.18 | 0.08 | 0.27 | 0.3 | -0.37 | -0.26 | 0.14 | 0.4 | -0.33 | 0.04 |
| HGBW | -0.16 | 0.11 | 0.32 | -0.09 | 0.32 | -0.58 | -0.33 | 0.5 | 0.45 | -0.4 | -0.14 |
| PH | 0.27 | 0.36 | 0.16 | -0.45 | 0.06 | 0.2 | -0.07 | 0.08 | -0.1 | 0.15 | -0.16 |
| STDIA | -0.11 | -0.09 | 0.18 | -0.15 | -0.02 | -0.23 | -0.23 | -0.09 | 0.09 | 0.08 | 0.1 |
| NMSTN | 0.18 | 0.45 | 0.67 | -0.35 | 0.04 | 0.05 | 0.11 | -0.13 | 0.18 | 0.17 | 0.16 |
| APBR | 0.29 | 0.31 | 0.28 | -0.26 | -0.08 | 0.35 | -0.03 | 0.15 | 0.07 | 0.14 | -0.14 |
| CANDIA | 0.54 | 0.32 | 0.39 | -0.24 | -0.16 | 0.21 | -0.08 | -0.12 | 0.1 | 0.11 | -0.11 |
| AvILMST | 0.2 | 0.18 | 0.05 | -0.22 | 0.15 | 0.16 | 0.04 | -0.01 | -0.02 | 0.08 | -0.17 |
| AvLPB | 0.36 | 0.63 | -0.24 | -0.03 | 0.32 | 0.07 | -0.04 | 0.07 | -0.06 | 0.03 | |
| NPB | 0.34** | 0.49 | -0.80** | -0.02 | 0.41 | 0.27 | 0.03 | 0.04 | 0.04 | -0.05 | |
| NSB | 0.41** | 0.46** | -0.26 | -0.09 | -0.08 | -0.1 | -0.06 | -0.23 | 0.18 | -0.27 | |
| PBPB | -0.12 | -0.69 | -0.28 | -0.08 | -0.4 | -0.57 | 0.12 | -0.28 | -0.2 | -0.04 | |
| LL | -0.02 | -0.01 | -0.02 | -0.03 | 0.25 | 0.96 ** | 0 | -0.14 | -0.2 | -0.44 | |
| LW | 0.26** | 0.18* | 0.08 | -0.14 | 0.26** | 0.75 | 0.06 | -0.24 | 0.26 | 0.19 | |
| LA | 0.14 | 0.14 | 0.07 | -0.16 | 0.72** | 0.79** | 0.11 | -0.36 | 0.22 | 0.17 | |
| FL | 0.03 | -0.01 | -0.09 | 0.12 | 0.03 | -0.02 | -0.02 | 0.22 | -0.06 | -0.21 | |
| BW | 0.09 | 0.03 | -0.05 | -0.01 | 0.02 | 0.06 | 0.05 | 0.15* | -0.21 | -0.13 | |
| CBD | -0.12 | -0.03 | 0.02 | -0.17 | -0.14 | 0.17* | 0.07 | -0.08 | 0.14 | 0.72 | |
| CLR | -0.09 | 0.12 | 0.11 | -0.12 | -0.19 | 0.01 | -0.04 | -0.06 | 0.02 | 0.46** |
Table 1(b): Genotypic correlation coefficient (above diagonal) and phenotypic correlation coefficient (below diagonal) in coffee germplasm accessions used in the study at Awada (2013/14) continued. *, ** significant at 0.05 and 0.01 level of probability, respectively ns, non-significant, GBYT13=Green bean yield per tree (gm) in 2013; PH=Plant height (cm); STDIA=Stem diameter (cm); NMSTN=Number of main stem nodes; APBR=Angle of primaries branches (degree); CANDIA=Canopy diameter (cm); AvILMST=Average inter node length of main stem (cm); AvLPB=Average length of primary branches (cm); NPB=Number of primary branches; NSB=Number of secondary branches; PBPB =Percentage of bearing primaries branches; LL=Leaf length (cm); LW=Leaf width (cm); LA=Leaf area (cm2); FL=Fruit length (mm); BW=Bean width (mm); HGBW=Hundred green bean weights (gm); CBD = Coffee berry disease (%) and CLR=Coffee leaf rust (%) reaction.
Moreover, from the dendrogram of the 19 coffee traits illustrated in Figure 1 that coffee bean yield was closely related with bean width, hundred bean weight, fruit length and percentage of bearing primaries branches, but plant height, average inter node of main stem, angle of primary branches, number of main stem nodes, number of secondary branches, number of primary branches, canopy diameter and average length of primary branches had close association each other. The other traits like leaf length, leaf area, and leaf width and stem diameter had close correlation to each other. The traits coffee berry disease and coffee leaf rust reaction of coffee accessions had also close association with each other.

Figure 1: Dendrogram of association of 124 coffee genotypes among 19 coffee quantitative traits. V1= Green bean yield per tree (gm) in 2013; V2=Hundred green bean weights (gm); V3=Plant height (cm); V4=Stem diameter (cm); V5=Number of main stem nodes; V6=Angle of primaries branches (degree); V7=Canopy diameter (cm); V8=Average inter node length of main stem (cm); V9=Average length of primary branches (cm); V10=Number of primary branches; V11=Number of secondary branches; V12=Percentage of bearing primaries branches; V13=Leaf length (cm); V14=Leaf width (cm); V15=Leaf area (cm2); V16=Fruit length (mm); V17=Bean width (mm); V18=Coffee berry disease (%) and V19=Coffee leaf rust (%) reaction.
Genotypic path coefficient analysis: Path coefficient analysis was carried out at genotypic level considering coffee green bean yield per tree as dependent and yield contributing traits as independent characters. Each component has direct and indirect effect on coffee yield through components which are not revealed by correlation studies. The genotype correlations direct and indirect effects of 18 independent characters to the dependent character (Table 2).
| HGBW | PH | STDIA | NMSTN | APBR | CANDIA | AvILMST | AvLPB | NPB | NSB | PBPB | |
|---|---|---|---|---|---|---|---|---|---|---|---|
| HGBW | 3.46 | 1.29 | -0.48 | -0.02 | 0 | 0.58 | -2.61 | -0.31 | 0.04 | 0.25 | -0.21 |
| PH | 0.41 | 10.8 | 0.09 | 0.03 | 0.01 | -0.29 | -12.99 | 0.51 | 0.14 | -0.12 | -1.09 |
| STDIA | -0.75 | 0.45 | 2.21 | 0.02 | 0 | -0.34 | -1.16 | -0.21 | -0.03 | -0.14 | -0.35 |
| NMSTN | -0.93 | 5.31 | 0.57 | 0.07 | 0.01 | -0.9 | -3.53 | 0.34 | 0.17 | -0.52 | -0.84 |
| APBR | -0.31 | 4.38 | 0 | 0.02 | 0.02 | -0.48 | -5.17 | 0.58 | 0.12 | -0.22 | -0.63 |
| CANDIA | -0.85 | 1.33 | 0.32 | 0.03 | 0 | -2.38 | -0.17 | 1.04 | 0.13 | -0.31 | -0.58 |
| AvILMST | 0.68 | 10.5 | 0.19 | 0.02 | 0.01 | -0.03 | -13.36 | 0.39 | 0.07 | -0.04 | -0.53 |
| AvLPB | -0.56 | 2.89 | -0.24 | 0.01 | 0.01 | -1.28 | -2.68 | 1.92 | 0.14 | -0.5 | -0.57 |
| NPB | 0.39 | 3.91 | -0.2 | 0.03 | 0.01 | -0.78 | -2.47 | 0.7 | 0.38 | -0.39 | -1.92 |
| NSB | -1.11 | 1.69 | 0.4 | 0.04 | 0 | -0.94 | -0.65 | 1.21 | 0.19 | -0.79 | -0.63 |
| PBPB | -0.3 | -4.89 | -0.32 | -0.02 | 0 | 0.57 | 2.95 | -0.45 | -0.31 | 0.21 | 2.4 |
| LL | 1.12 | 0.62 | -0.04 | 0 | 0 | 0.37 | -2.02 | -0.07 | -0.01 | 0.07 | -0.19 |
| LW | -1.99 | 2.17 | -0.48 | 0 | 0.01 | -0.49 | -2.16 | 0.61 | 0.16 | 0.06 | -0.97 |
| LA | -1.15 | -0.76 | -0.5 | 0.01 | 0 | 0.19 | -0.54 | 0.14 | 0.1 | 0.08 | -1.38 |
| FL | 1.72 | 0.86 | -0.19 | -0.01 | 0 | 0.29 | 0.1 | -0.07 | 0.01 | 0.05 | 0.3 |
| BW | 1.55 | -1.13 | 0.2 | 0.01 | 0 | -0.24 | 0.22 | 0.13 | 0.02 | 0.18 | -0.66 |
| CBD | -1.38 | 1.66 | 0.18 | 0.01 | 0 | -0.27 | -1.12 | -0.12 | 0.02 | -0.14 | -0.49 |
| CLR | -0.5 | -1.68 | 0.23 | 0.01 | 0 | 0.26 | 2.25 | 0.06 | -0.02 | 0.21 | -0.11 |
Table 2(a): Estimate of direct (bold and under lined diagonal) and indirect effects (off diagonal) at genotypic level of 18 quantitative traits on green bean yield in 124 coffee germplasm accessions at Awada.
| LL | LW | LA | FL | BW | CBD | CLR | GC | |
|---|---|---|---|---|---|---|---|---|
| HGBW | 1.95 | -3.45 | 2.38 | -1.18 | -0.18 | -1.17 | 0.09 | 0.45 |
| PH | 0.34 | 1.2 | 0.5 | -0.19 | 0.04 | 0.45 | 0.1 | -0.05 |
| STDIA | -0.12 | -1.3 | 1.62 | 0.2 | -0.04 | 0.24 | -0.07 | 0.23 |
| NMSTN | 0.24 | 0.32 | -0.8 | 0.32 | -0.08 | 0.49 | -0.1 | 0.13 |
| APBR | -0.45 | 2.11 | 0.23 | -0.35 | -0.03 | 0.4 | 0.09 | 0.28 |
| CANDIA | -0.94 | 1.23 | 0.58 | 0.29 | -0.04 | 0.33 | 0.07 | 0.07 |
| AvILMST | 0.91 | 0.97 | -0.29 | 0.02 | 0.01 | 0.25 | 0.11 | -0.14 |
| AvLPB | -0.21 | 1.91 | -0.51 | 0.09 | -0.03 | -0.18 | -0.02 | 0.19 |
| NPB | -0.11 | 2.47 | -1.94 | -0.06 | -0.02 | 0.14 | 0.03 | 0.18 |
| NSB | -0.56 | -0.45 | 0.74 | 0.15 | 0.1 | 0.53 | 0.17 | 0.08 |
| PBPB | -0.47 | -2.43 | 4.09 | -0.29 | 0.11 | -0.59 | 0.03 | 0.27 |
| LL | 6.02 | 1.49 | -6.83 | 0 | 0.06 | -0.58 | 0.28 | 0.3 |
| LW | 1.5 | 5.99 | -5.37 | -0.14 | 0.1 | 0.76 | -0.12 | -0.37 |
| LA | 5.75 | 4.51 | -7.14 | -0.26 | 0.15 | 0.65 | -0.11 | -0.26 |
| FL | -0.01 | 0.35 | -0.78 | -2.36 | -0.09 | -0.18 | 0.14 | 0.14 |
| BW | -0.82 | -1.42 | 2.58 | -0.52 | -0.41 | 0.61 | 0.09 | 0.4 |
| CBD | -1.18 | 1.56 | -1.59 | 0.15 | -0.09 | 2.93 | -0.47 | -0.33 |
| CLR | -2.63 | 1.15 | -1.22 | 0.5 | 0.05 | 2.12 | -0.65 | 0.04 |
Table 2(b): Estimate of direct (bold and under lined diagonal) and indirect effects (off diagonal) at genotypic level of 18 quantitative traits on green bean yield in 124 coffee germplasm accessions at Awada continued. Residual factors=-3.3517, GC=Genotypic correlation coefficient average yield with the characters; HGBW=Hundred green bean weights (gm); PH=Plant height (cm); STDIA=Stem diameter (cm); NMSTN=Number of main stem nodes; APBR=Angle of primaries branches (degree); CANDIA=Canopy diameter (cm); AvILMST=Average inter node length of main stem (cm); AvLPB=Average length of primary branches (cm); NPB=Number of primary branches; NSB=Number of secondary branches; PBPB=Percentage of bearing primaries branches; LL=Leaf length (cm); LW=Leaf width (cm); LA=Leaf area (cm2); FL=Fruit length (mm); BW=Bean width (mm); CBD=Coffee berry disease and CLR=Coffee leaf rust.
Although correlation estimates are helpful in determining the components of complex trait such as yield, they do not provide an exact picture of the relative importance of direct and indirect influences of each of the component characteristics of this trait. Thus, path coefficient analysis is simply a standardized partial regression coefficient that partitions the correlation in to direct and indirect effects. Hence, the use of also reported that the use of this method requires cause and effect relationship among the variables, and the experimenter must assign direction in the casual system based up on priori grounds of experimental evidence.
The highest direct positive effect was shown by plant height (10.80) followed by leaf length (6.02), leaf width (5.99), hundred green bean weight (3.46), coffee berry disease (2.93), percentage of bearing primary branches (2.40), stem diameter (2.21) and average length of primary branches (1.92). Low magnitude and positive direct effects were recorded for number of primary branches (0.38), number of main stem nodes (0.07) and angle of primary branches (0.02) on average green bean yield per tree. The positive direct effects of plant height, stem diameter, number of primary branches, number of main stem nodes and angle of primary branches in this study was similar with other findings [20]. However, path coefficient analysis revealed averages inter node length of main stem (-13.36), leaf area (-7.14), canopy diameter (-2.38), fruit length (-2.36), number of secondary branches (-0.79), coffee leaf rust reaction (-0.65) and bean width (-0.41) had negative direct effect on coffee yield per tree (Table 2).
Leaf length (5.99), hundred green bean weight (3.46), percentage of bearing primary branches (2.40), stem diameter (2.21), average length of primary branches (1.92), number of primary branches (0.38), number of main stem nodes (0.07) and angle of primary branches (0.02) had positive direct effect on average green bean yield per tree, exhibited positive and non-significant genotypic correlation with coffee yield per tree (rg = 0.30, 0.45, 0.27, 0.23, 0.19, 0.18, 0.13 and 0.28, respectively). These traits, however, had no significant genotypic association with yield and exhibited a substantial indirect counter balance effect via one another, suggesting that these characters had significant contribution toward coffee green bean yield at genotypic level. The positive direct effect of stem diameter, number of primary branches and angle of primary branches on coffee green bean yield agreed with other findings [18].
On the contrary, canopy diameter (-2.38), fruit length (-2.36), number of secondary branches (-0.79), coffee leaf rust reaction (-0.65) and bean width (-0.41) had negative direct effect and positive genotypic correlation coefficients of (rg=0.07, 0.14, 0.08, 0.04 and 0.40), respectively on coffee yield per tree. Hence, the positive correlation coefficient was largely due to their respective positive indirect effects.
Plant height (10.80), leaf width (5.99) and coffee berry disease reaction (2.93), which had the highest direct effect and exhibited, negative correlation with coffee yield. The negative correlation they showed with coffee yield was mainly due to negative indirect effects via other traits. This indicated that restricted simultaneous selection has to be followed; as restrictions are to be imposed to nullify the undesirable indirect effects in order to make use of the direct effect of these traits.
Conclusion
The most the morphological traits of the characters of coffee had positive correlations among each other. The characters that exhibited positive and significant correlation with yield, viz. hundred green bean weights, stem diameter, canopy diameter, average length of primary branches, percent of bearing primary branches and leaf length, are important components to improve coffee yield, phenotypic level. Even though non-significant correlation, similar trend was rescored for most of the characters at genotypic level.
The path coefficient analysis was indicated that both the direct and indirect effects of plant height, leaf length, leaf width, hundred green bean weight, and coffee berry disease reaction, percentage of bearing primary branches, stem diameter and average length of primary branches were positive and high. Most of the coffee accessions were superior to the check cultivars for most of the growth characters considered. Such as, plant height, stem diameter, number of main stem nodes, angle of primaries branches, canopy diameter, average inter node length of main stem, average length of primary branches, number of primary branches, number of secondary branches and percentage of bearing primaries branches. Therefore, improvement of coffee landraces may be possible by indirect selection for these characters.
Acknowledgements
The authors would like to acknowledge EIAR for allocating required budget for research. I thank Mr. Meseret Degefa, Mr. Nigussie Hundessa, Mrs. Kidist Abebe, of Awada Agriculture Sub-Center, for their heartfelt help in conducting the field experiment, facilitating working environment and encouragement. I am also grateful to Mr. Birhanu Etiso, Mr. Amhare Bokko and Mr. Demeke G/Mariam, for their multi-faceted assistance and for the timely completion of the field data collection.
References
- Coste R (1992) Coffee: The Plant and the Product. CTA Waginingen, The Netherland.
- Wintgens JN (2004) Coffee: Growing, processing, sustainable production, a guide book for growers, processors, traders, and researchers. WILEY-VCH Verlag GmbH & Co KGaA, Weinheium.
- Taye K (2006) Ecophysiological diversity of wild Arabica coffee populations in Ethiopia: Growth, water relations and hydraulic characteristics along a climatic gradient. In: Denich M, Martius C, Rodgers C (eds.). Ecology and Development Series, Cuvillier Verlag, 46 :1-305.
- Davis AP, Chester M, Maurin O, Fay MF (2006) Searching for the relatives of Coffea (Rubiaceae, Ixoroideae). The circumscriptions and phylogeny of Coffea based on plasmid sequence data and morphology. Am J Bot 94: 313-329.
- Bayetta B (2001) Arabica coffee breeding for yield and resistance to coffee berry disease (Colletotrichum kahawae sp.). A PhD Thesis, University of London, pp: 201.
- Anthony F, Combes MC, Astorga C, Bertrand B, Graziosi G, et al. (2002) The origin of cultivated Coffea arabica L. varieties revealed by AFLP and SSR markers. Theor Appl Genet 104: 894-900.
- Central Statistical Authority (2013/14) The Federal Democratic Republic of Ethiopia Central Statistical Agency Agricultural Sample Survey. Addis Ababa, Ethiopia, pp: 121.
- Simayehu T, Sinidu A, Simachew C (2008) Coffee production and marketing in the southern nations, nationalities’ and peoples regional state. Pp: 390-398. In: Girma A, Bayetta B, Tesfaye S, Endale T, Taye, K (eds.). Coffee Diversity and Knowledge. Proceedings of a National Workshop Four Decades of Coffee Research and Development in Ethiopia, Addis Ababa, Ethiopia.
- Assefa M (2013) Coffee marketing trend in the world. The 2nd International Ethiopian Coffee conference. Addis Ababa, Ethiopia.
- Taye Kufa (2010) Environmental sustainability and coffee diversity in Africa. ICO World Coffee Conference, Guatemala City, Central America.
- The Ethiopian Intellectual Property Office (2011) Agriculture and Rural Development.
- Bayetta B, Labouisse JP (2006) Arabica coffee (Coffea arabica L.) local landrace development strategy in its center of origin and diversity. In: 21th International Conference on Coffee Science, Montpellier, France, pp: 926-930.
- Taye K (2013) Status of Arabica Coffee Germplasm in Ethiopia. The 3rdAfrican Coffee Sustainability Forum. AFCA Pre-Conference Event, Munyono, Uganda.
- Mesfin K, Bayetta B (2008) Phenotypic diversity in the Harerge coffee (Coffee arabica L.) germplasm for quantitative traits. East African Journal of Sciences 2: 13-18.
- Sharma J (2006) Statistical and biometrical techniques in plant breeding. 2nd edn. New age international, New Delhi, India. pp: 429.
- IPGRI (1996) Descriptions of coffea spp. and Psilanthus spp. International Plant Genetics Resource Institute, Rome.
- Abdi A (2009) Agro-morphological characterization of coffee (Coffea arabica L.) landrace collected from Mesela, West Harerge, Ethiopia. MSc Thesis, Hawassa University, Hawassa, Ethiopia, pp: 88.
- Getachew W (2012) Morphological and organoleptic characterization of some coffee (Coffea arabica L.) germplasm accessions from Goma Woreda, Southwest Ethiopia. MSc Thesis, Jimma University, Jimma, Ethiopia, pp: 98.
- Olika K, Sentayehu A, Taye K, Weyessa G (2011) Variability of quantitative Traits in Limmu Coffee (Coffea arabica L.) in Ethiopia. Int J Agric Res 6: 482-493.
- Ermias H (2005) Evaluation of Wellega coffee germplasm for yield, yield components and resistance to coffee berry disease at early bearing stage. MSc Thesis, Alemaya University, Alemaya, Ethiopia. pp: 69.
- Johnson HW, Robinson HF, Comstock RE (1955) Estimates of genetic and environmental variability in soybeans. Agronomy Journal 47: 314-318.
Citation: Atinafu G, Mohammed H (2017) Association and Path Coefficient Analysis of Yield and Yield Attributes of Coffee (Coffea arabica L.) Under Sidama Specialty Coffee Growing Area, Awada, Southern Ethiopia. Adv Crop Sci Tech 5: 307. DOI: 10.4172/2329-8863.1000307
Copyright: © 2017 Atinafu G, et al. This is an open-access article distributed under the terms of the Creative Commons Attribution License, which permits unrestricted use, distribution, and reproduction in any medium, provided the original author and source are credited.
Select your language of interest to view the total content in your interested language
Share This Article
Recommended Journals
Open Access Journals
Article Tools
Article Usage
- Total views: 6583
- [From(publication date): 0-2017 - Nov 17, 2025]
- Breakdown by view type
- HTML page views: 5522
- PDF downloads: 1061