Research Article Open Access
Assignment of functional groups in Gram-positive bacteria
Boguslaw Buszewski1,2,*, Ewelina Dziubakiewicz1,2, Pawel Pomastowski1,2, Katarzyna Hrynkiewicz3, Justyna Ploszaj-Pyrek4,5, Ewa Talik4, Markus Kramer5 and Klaus Albert5
1Department of Environmental Chemistry and Bioanalytics, Faculty of Chemistry, Nicolaus Copernicus University, Gagarina 7, 87-100 Torun, Poland
2Interdisciplinary Centre of Modern Technologies, Nicolaus Copernicus University, Wilenska 4, 87-100 Torun, Poland
3Department of Microbiology, Institute of General and Molecular Biology, Nicolaus Copernicus University, Gagarina 9, 87-100 Torun, Poland
4August Chelkowski Institute of Physics, University of Silesia, Uniwersytecka 4, 40-007 Katowice, Poland
5Department of Biology and Environmental Protection, University of Silesia, Jagiellonska 26/28, 40-032 Katowice, Poland
- *Corresponding Author:
- Boguslaw Buszewski
Chair of Environmental Chemistry
and Bioanalytics, Faculty of Chemistry
Gagarin 7 87-100 Torun, Poland
Tel: (48) (56)6114308
E-mail: bbusz@chem.uni.torun.pl
Received Date:January 27, 2015; Accepted Date February 17, 2015; Published Date February 25, 2015
Citation: Buszewski B, Dziubakiewicz E, Pomastowski P, Hrynkiewicz K, Ploszaj- Pyrek J, et al. (2015) Analytical Method Development and Validation: A Concise Review. JAnal Bioanal Tech 6:232. doi: 10.4172/2155-9872.1000232
Copyright: © 2015 Buszewski B, et al. This is an open-access article distributed under the terms of the Creative Commons Attribution License, which permits unrestricted use, distribution, and reproduction in any medium, provided the original author and source are credited.
Visit for more related articles at Journal of Analytical & Bioanalytical Techniques
Abstract
The chemical composition, molecular structure and physicochemical properties of five Gram-positive bacterial strain: Bacillus cereus, Bacillus subtilis, Sarcina lutea, Staphylococcus aureus, Micococcus luteus were investigated by Fourier transform infrared (FTIR), X-ray photoelectron spectroscopy (XPS), NMR spectroscopy and intact cell matrix-assisted laser desorption/ionization time-of-flight mass spectrometry (IC MALDI TOF MS). An analysis of FTIR spectra as a function of pH revealed the three major types of cell wall functional groups – carboxyl group, amino group and phosphate group. An analysis of XPS spectra was determinate the major surface components of bacterial cell. 13C NMR and IC MALDI TOF MS spectra of six bacterial species were registered. Our findings indicate that chemical and structural differences in the cell composition of Gram-positive bacteria can be detected. The obtained results also demonstrate that the combination of FTIR, XPS and NMR spectroscopy with IC MALDI TOF MS technique yields useful information and complements other biochemical and physical methods of microbial cells characteristics.
Keywords
Characteristics of bacteria; Spectroscopy investigation; Spectrometric technique; Charge distribution; Proteomics
Introduction
The cytoplasmic membrane of bacteria is surrounded and supported by a cell wall which provides it with strength, rigidity and shape. The bacterial cell wall is a heterogeneous structure which contains numerous macromolecules such as proteins, lipid molecules, teichoic acid and lipopolysaccharides [1-3].
Bacteria may be divided into two major groups based on the Gram-staining reaction. Peptidoglycan is a significant component of the cell wall is which found in both bacterial groups. The cell wall of Gram-positive bacteria is composed of a rigid and relatively thick peptidoglycan layer with adjacent teichoic and teichuronic acids [4,5].
Macromolecules that are present in the cell wall and bacterial membranes produce unique biochemical fingerprints and contribute to the surface charge of bacterial cells through the ionization of protonactive functional groups, such as carboxyl, phosphate, amino, and hydroxyl groups [6,7]. According to electrokinetic theory, the discussed active center (functional groups) of macromolecules play a crucial role in electroseparation process during capillary zone electrophoresis and capillary isoelectric focusing of bacterial cells [8- 10].
Several techniques have been proposed for determining the cell wall composition of Gram-positive bacteria, including Fourier Transform Infrared (FTIR), X-ray Photoelectron (XPS), NMR spectroscopy and intact cell matrix-assisted laser desorption/ionization time-of-flight mass spectrometry (IC MALDI TOF MS). FTIR is a physicochemical method which measures the vibration and rotation of molecules influenced by infrared radiation in the wavelength range. The FTIR spectra of bacterial cell are used to analyze their total composition and to determine the presence of functional groups, their protonation or changes in coordination states [11-13]. XPS provides information about the elemental composition and the composition of functional groups on the outermost cell surface (3 to 5 nm thick) [14-16]. XPS is used to estimate the concentrations of the basic cell surface components: proteins, polysaccharides and hydrocarbon-like compounds with the use of a constituent model [17-20]. NMR supports the determination of functional groups in bacterial cells. The NMR spectrum represents all functional groups in a sample, and functional groups on the surface of the particle are not identified separately. Spectrometric analysis of a bacteria strain provides comprehensive information about molecular composition of cells. This approach based on analysis of the unique cell components mainly protein profile of a microorganism, known as molecular fingerprint (MF) [21].
The purpose of this study was to determine the FTIR, XPS, 13C NMR and IC MALDI TOF MS spectra of five Gramm-positive bacteria and to identify the impact of functional groups on their properties.
Materials and Methods
Preparation of bacterial suspensions
Bacillus cereus (PCM 2003), B. subtilis (PCM 2021), Sarcina lutea, Staphylococcus aureus (1) (EU490368 - Acc. No in NCBI) and Micrococcus luteus (PCM 1944) bacterial strains were obtained from the American Type Culture Collection - ATCC, Polish Collection of Microorganisms - PCM (WFCC registration number: 106 and collection of the Department of Microbiology (Nicolaus Copernicus University, Poland). Escherichia coli (ATCC 8739) was used like negative-probe. Bacterial cells were cultivated in 3 mL of Tryptic Soy Broth (TSB, Difco) with 0.5% yeast extract for 24 h at 32°C. After this period, 3 ml of bacterial cultures were transferred to 1 L flasks containing the same liquid medium, and they were cultivated by shaking for another 24 h at 32°C. Bacterial cells were separated from the medium by centrifugation (14 000 rpm, 10 min). The pellet with bacterial cells was immediately washed with 0.005 M NaNO3 electrolyte to remove the growth medium from bacterial surfaces for future analysis. The washing procedure was repeated twice. The final pellet of washed bacterial cells was suspended in 5 ml of 0.005 M NaNO3 at different pH (pH 2.5-10.5) and used in FTIR analysis. The optical density (OD) of final bacterial suspensions varied between 0.724 to 0.894 (measured spectrophotometrically at 590 nm). 13C CP/MAS NMR and XPS spectra were recorded for freeze-dried bacterial cells. The final pellet of washed bacterial cells was freeze-dried in the CentriVap Concentrator (Labconco). The temperature of the freeze-dryer shelf was set at -50°C for 3 h, it was raised to -4°C for 6 h, and was finally increased to 20°C. In case of IC MALDI TOF MS analysis, the analyzed bacterial strains were cultivated at 37°C for 17 h on R2A Agar (R2A), Mueller Hinton (MH2) and Schaedler Broth (SB)) from bioMérieux (Warsaw, Poland).
FTIR spectroscopy
Firstly, were suspended in 1 mL of NaNO3 at pH 7, then transferred onto CaF2 plate (Sigma Aldrich, Poland) and were left at room temperature to obtain thin layer. The infrared spectrum of bacteria strain was measured in MIR range (FTIR Genesis II, Mattson, USA); as background was used CaF2 plate. Afterwards, bacterial suspensions at different pH (pH 2.6-10.5) were monitored in FTIR Genesis II spectrophotometer with adapter for measuring liquid samples, equipped with WINFIRST software. A total of 400 scans with 1 cm-1 resolution and wavenumber range of 2000 to 800 cm-1 were obtained for each sample. The spectrum of 0.005 M NaNO3 was used as the background.
XPS spectroscopy
XPS spectra were obtained in the PHI 5700/660 Physical Electronics Photoelectron Spectrometer with monochromatized Al Kα X–ray radiation (1486.6 eV). A hemi–spherical mirror analyzer measured the energy of electrons with energy resolution of around 0.3 eV. The emission of photoelectrons from an area of 800 μm x 2000 μm was recorded. All measurements were performed under UHV of 10–8 Pa. A neutralizer was used in all measurements due to the charging effects of non-conducting samples. Binding energy was determined relative to the C 1s component set at 285 eV. Each peak of the recorded spectrum is characteristic of a given level of electron energy of the measured elements. The measured binding energies are not absolutely constant, and they are determined by the chemical environment where functional groups are located due to changes in the distribution of valence electrons. The differences in electron binding energies relative to pure elements are referred to as chemical shifts. The angle between the X–ray source and the sample surface was 45°C.
The relative concentrations of various constituents have to be determined in XPS. The Multipak Physical Electronics program supports the quantification of XPS spectra based on peak area and the peak height sensitivity factor. Standard atomic concentration is calculated as a ratio of each component to all analyzed elements. Only elements which produce a clear line in the spectrum are taken into account. The chemical composition of model constituents and proportions of carbon associated with each molecular constituent were calculated with the use of equations (1)-(3). Carbon concentrations for each component were converted into weight fractions.
 (1)
(1)
 (2)
(2)
 (3)
(3)
where PE: peptides, PS: polysaccharides, HC: hydrocarbon-like compounds.
The background which is individually selected in a region limited to a specific line is subtracted, and the peak area is integrated in Multipak Software Version 6 (Physical Electronics, Minnesota, 1998.). The Gaussian–Lorentzian functions were used to fit the XPS core level spectra.
NMR spectroscopy
The CP/MAS 13C NMR measurement were performed on a Bruker DSX-200 operating at 200.13 MHz (4.7 T) for 1H equipped with a double air-bearing probehead. Samples were prepared in a ZrO rotor and the MAS rate was 10 kHz. The standard CP pulse sequence was used with a 1 ms contact pulse and a relaxation delay of 1s. The total number of scans was between 50 k and 100 k. Glycine was used for the Hartmann–Hahn matching procedure and as an external standard.
Spectrometric analysis of bacteria
One bacterial colony was smeared on a MALDI target (Ground steel, Bruker Daltonics, Germany) as a thin layer and overlaid with 1.0 μl of matrix solution: DHB (50 mg/mL), HCCA (10 mg/mL) in a solvent mixture EtOH/ACN/H2O 1:1:1 (v/v/v) with 2.5% v/v. In case of bacterial samples cultivated in liquid media, samples firstly were certificated (10000 rmp, 4°C, 5 min), flushed twice deionized water and to the above-mentioned solvent mixture so that the final bacterial suspension ranged between 109 and 1012 cells per mL. Intact cell mass spectrometric analysis was conducted with the use of ultrafleXtreme MALDI-TOF/TOF mass spectrometer (Bruker Daltonik, Bremen, Germany) equipped with a modified Nd:YAG laser (smartbeam II™) operating at the wavelength of 355 nm and the frequency of 2 kHz. IC MALDI TOF MS spectra of were recorded manually in linear positive mode within m/z range of 300-30,000 and applying the acceleration voltage of 25 kV. All mass spectra were acquired and processed with the dedicated software: flexControl and flexAnalysis, respectively (both from Bruker)
Results
FTIR spectroscopy
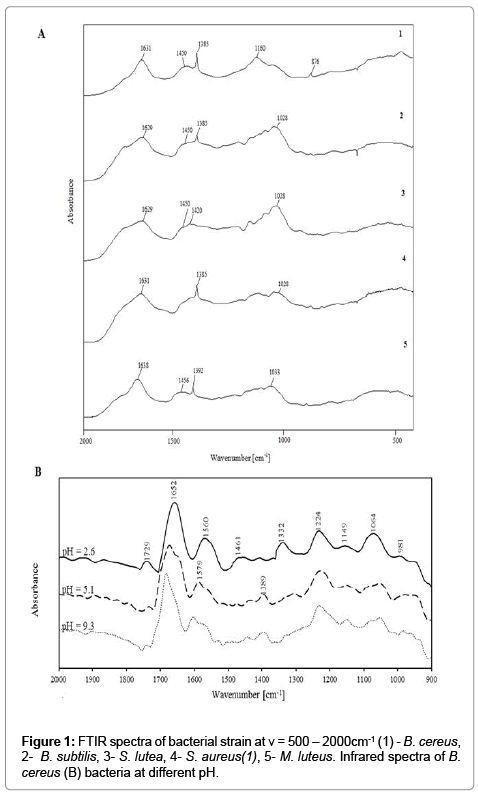
In the analyzed bacterial strains, spectra were examined in the range of ν=400-4000 cm-1 onto CaF2 plate (thin layer method; Figure 1A1 and 1A2) and at ν=900-2000 cm-1 at different pH (suspension methods; Figure 1B and 1C) to determine vibrations characteristic for the protonation or deprotonation of various functional groups. Absorption bands characteristic of amides, carboxyl, phosphate and carbohydrates groups were identified in all spectra. It was observed their differences in absorption bands between analyzed bacterial strain (Figure 1).
The FTIR spectra of analyzed bacterial strain and obtained spectra for suspension of E. coli and B. subtilis at different pH are shown in Figure 1B and 1C. It has been observed different value of absorption bands for infrared spectra determined by thin layer methods and register spectra for suspensions. It results from solvatation and (de) protonation processes onto bacterial surface [7]. Intensive absorption bend of carboxyl and amides groups prove formation controlled bacterial aggregates with divalent ions during electrofocusing [6]. Moreover, obtained results appear dominant contribution of carboxyl and amino groups in solvatation processes, charge distribution, biocolloids dispersion and in consequences stability of system [6,7].
XPS spectroscopy
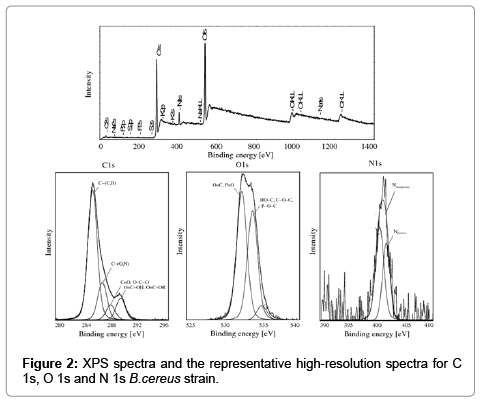
X-ray Photoelectron Spectroscopy supported the analysis of the surface composition of the examined bacterial cells. XPS spectra revealed the predominance of carbon and oxygen on bacterial surfaces, whereas N was less frequently observed. XPS peaks corresponding to P, S and K were occasionally found, but they were too weak to support concentration measurements. The XPS spectra with the representative high-resolution spectra for C 1s, O 1s and N 1s of E. coli and B. subtilis bacteria are presented in Figure 2.
The carbon peak (C1s) for the examined bacterial cells was decomposed into four components: carbon forming a bond with carbon or hydrogen C−(C,H) in amino acids and lipids (285.0 eV), carbon forming a bond with oxygen or nitrogen C−(O,N) in esters, alcohols, amines and amides (286.5 eV), carbon forming a double bond with oxygen C=O or two single bonds O−C−O attributed to carbonyl, carboxyl groups, amide, acetyl, hemiacetal (287.8 eV), carbon forming one double bond and one single bond with oxygen C=O−O, including the carboxyl group, and C=O−OR, including esters (289.0 eV).
The oxygen peak (O 1s) was decomposed into two components attributed mainly to: oxygen forming a double bond with carbon O=C, oxygen forming a double bond with phosphate P=O or oxygen forming a single bond with phosphate P−O− in the carboxyl or carbonyl group, carboxylic acids, esters, amides and phosphate group (531.3 eV), and oxygen forming a single bond with hydrogen (HO−C), including the hydroxyl group, or carbon (C−O−C), including acetals and hemiacetals (533.5 eV).
The nitrogen peak (N 1s) was decomposed into two components attributed mainly to: nonprotonated nitrogen (400 eV), including amine and amide, and to protonated nitrogen (401.7 eV). The phosphorus peak at 133.5 eV was attributed to phosphate groups. The potassium peak was observed at 294.9 eV. The S peak (294.9 eV) was indicative of organic sulfide.
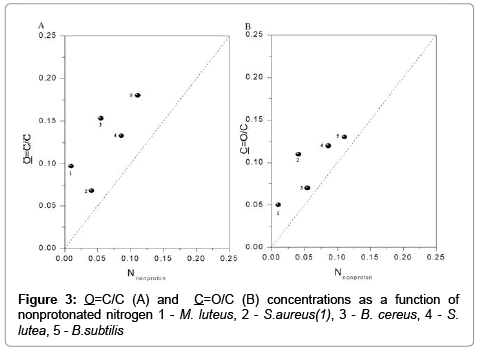
The data shown in Figure 3 point to a high degree of consistency between the concentrations of O=C/C, C=O/C and of nitrogen. The dotted line represents the expected 1:1:1 ratio for amides (O=C−N) in peptidoglycan, peptides and proteins.
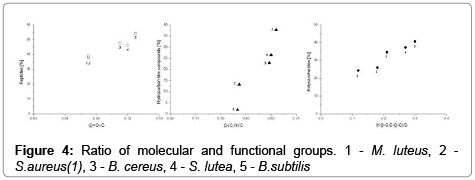
The molecular composition (weight percentage) of compounds on the surface of E. coli, B. cereus, B. subtilis, S. lutea, S. aureus(1) and M. luteus bacteria is presented in Figure 4. The concentrations of the three major surface compounds were highly correlated with (HO−C, C−O−C)/C, C=O/C, C−(C,H), C−(O,N)/C and C=O (Figure 5), which indicates that those groups participate in the structure of polysaccharides, peptides and hydrocarbon-like compounds, respectively. Its proves dominant contribution of carboxyl and amino groups in protonationdeprotonation process taking place at the interface of bacterial surface. This information is helpful in optimization of electroseparation process of bacterial cells [6]. (Figures 4 and 5)
NMR spectroscopy
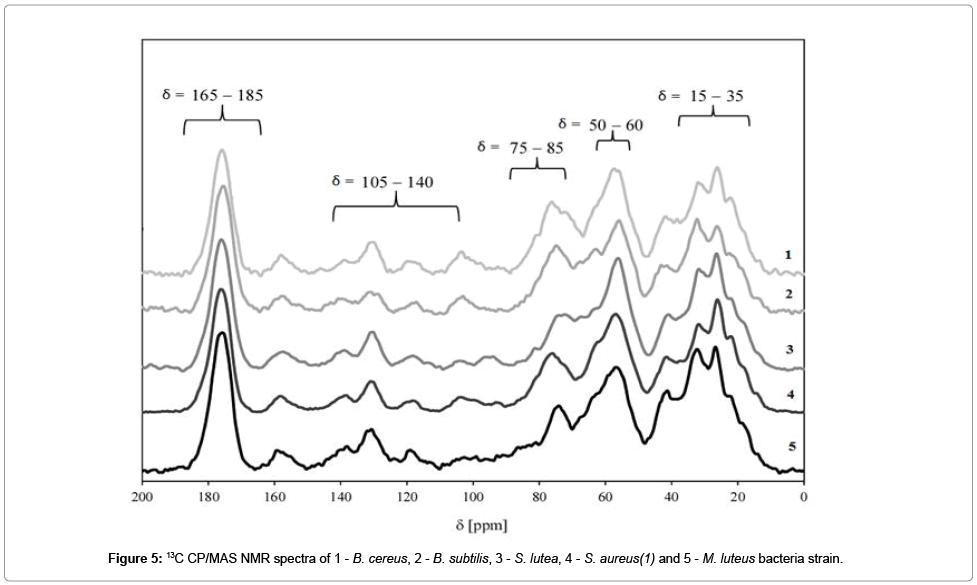
A series of 13C NMR spectra for E. coli, B. cereus, B. subtilis, S. lutea, S. aureus(1) and M. luteus bacteria are compared in Figure 6.
The signal with the chemical shift range of σ=165−180 ppm belongs to carbonyl groups C=O which are present in lipid and fatty acid esters. Signals in the range of σ=105−140 ppm may be attributed to aromatic rings and carbons with double bonds C=C. In bacterial cells, the discussed functionalities may be found in amino acids such as tryptophan, phenylalanine and tyrosine. One of the most important signals in 13C NMR bacterial spectra is observed at σ=75-85 ppm. It corresponds to a carbon atom bonded with a hydroxyl group. Those atoms are present in saccharides. Signals in the range of σ=50−60 ppm may be attributed to a carbon-nitrogen bond C−N. A number of signals can be observed in the chemical shift range of σ=15 to 35 ppm, and they correspond mostly to alkyl carbons in fatty acids, phospholipids and alkyl groups of amino acids.
Our results indicate that 13C NMR spectroscopy is a useful tool for analyzing the structural properties of bacterial cells.
Spectrometric analysis of bacteria
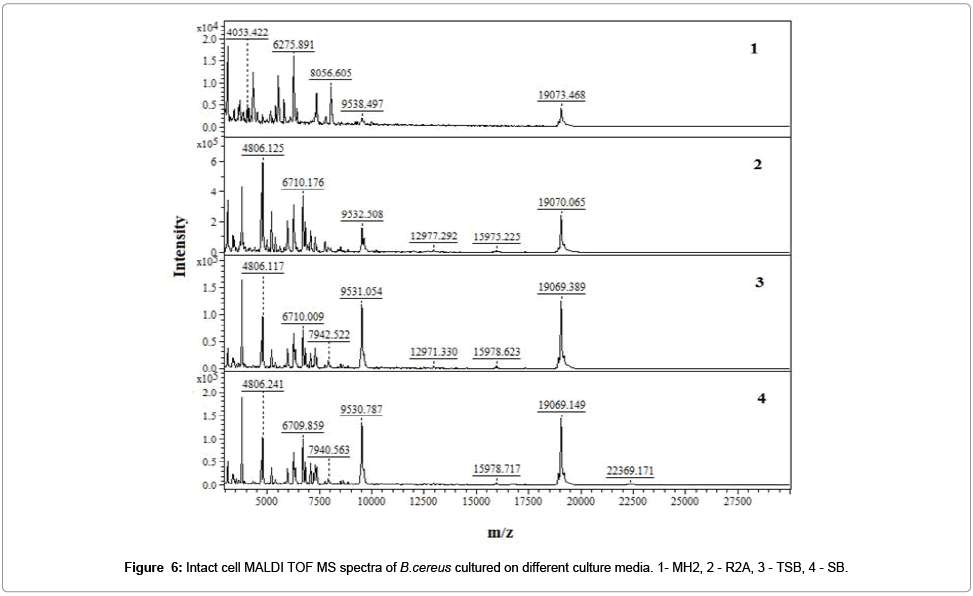
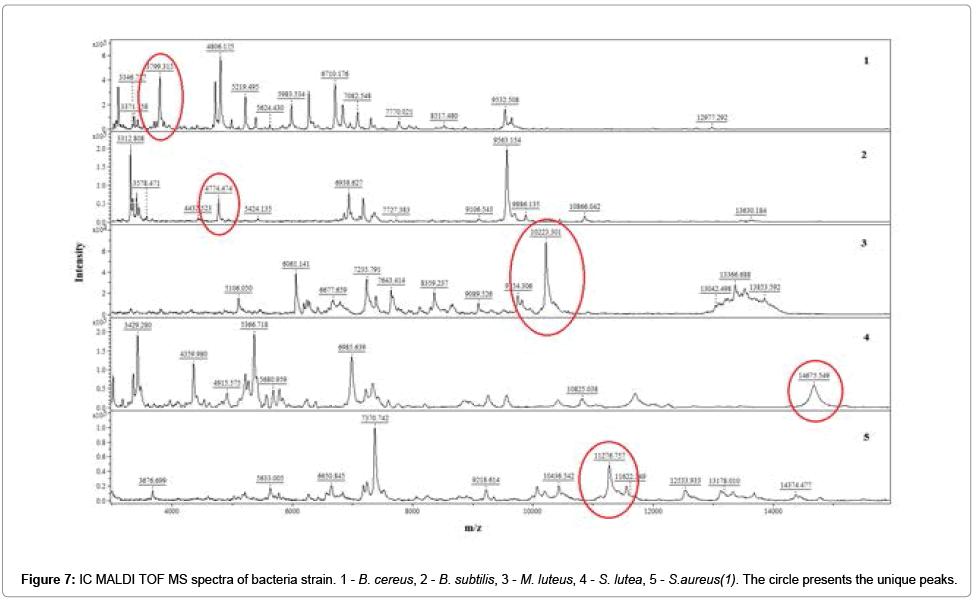
It has been registered the IC MALDI TOF MS spectra of examined bacterial strain (Figure 7).
The optimal OD value of all analyzed bacterial suspensions was in the range of 0.80 - 0.04. These values represent 105 - 109 cells per spot. Too small amount of microbial cells (less than 104) was insufficient to generate a spectrum, while in the case of excessive amount of cells (greater than 1010), it is impossible to reach desorption and ionization of bacterial components, and hence to register a spectrum.
The unique peaks (‘markers’) was indicated using non-parametric U-Mann-Whitney test (UMW). The experimental data did not meet the assumptions of the Student’s t test and therefore parametric test could not be applied. Obtained ‘markers were identified via independent comparison within a group. Table 1 summarizes the values of m/z which met the criteria of UMW test (Table 1).
| Bacteria strain | Unique peak [m/z] | ±SD |
|---|---|---|
| B.cereus | 3799 | 3 |
| B.subtilis | 4774 | 2 |
| M.luteus | 10223 | 4 |
| S.lutea | 14675 | 3 |
| S.aureus | 11276 | 2 |
Table 1: Unique peak of five bacterial strains calculated via UMW test. Number of repetitions: 10.
Application of HCCA and DHB matrix gave reproducible spectra with high resolution and stable ionization. Spectra recorded using DHB as a matrix were richer in signals in the case of analysis of Grampositive bacteria. It was possible register different molecular fingerprint for recognition of examined bacterial strain. Qualitative changes in the composition of cells translates directly into the nature of the registered spectrum. Obtained results suggest use of MALDI TOF MS like selective detector in electroseparation process of bacterial cells using capillary zone electrophoresis approach [6,10]. Application of HCCA and DHB matrix gave reproducible spectra with high resolution and stable ionization. Spectra recorded using DHB as a matrix were richer in signals in the case of analysis of Gram-positive bacteria. It was possible register different molecular fingerprint for recognition of examined bacterial strain. Qualitative changes in the composition of cells translates directly into the nature of the registered spectrum. Obtained results suggest use of MALDI TOF MS like selective detector in electroseparation process of bacterial cells using capillary zone electrophoresis approach [6,10].
Discussion
FTIR spectroscopy
Infrared spectroscopy is widely used for identifying surface functional groups of microorganisms derived from proteins, glycopeptides, lipids, teichoic acid, polysaccharides and polyphosphates.
The aim of the spectroscopic study was to localize active chemical groups (centers) of analyzed bacteria. Figure 1A1 demonstrates the absorption bands around ν=3600 cm−1 results from vibration of hydroxyl and amino groups of bacterial components (e.g proteins, sugars). On the other hand, this region is characteristic for vibration of hydroxyl groups coming from water. Therefore, for evaluation obtained spectra is important range of ν=1200-1800 cm−1 (Figure 1A2) [18]. In particular, the bands at (**) ν=1450 cm−1 and (***) ν=1370 cm−1 may be attributed to deprotonated carboxyl groups (COO−) of bacterial peptides (mostly asparagine and glutamine residues). Intensity of these bands oscillate in case of different Gram-positive bacterial strain, but it has not been observed significant shift bands in comparison with E. coli strain. The absorption band at ν=1640 cm−1(*) resulted from the amide I vibrations, which originated mainly from carbonyl groups (C=O) stretching, while the band localized at ν=1450 cm−1(**) could result from the presence of aliphatic groups of the amide II . Intensity of band at ν=1450 cm−1 (**) for examined Gram-positive bacteria strain is on similar range in comparison in E. coli. Moreover, in case of FTIR spectra of E. coli, it has been observed the splitting band at range (***): ν=1640 cm−1 and ν=1620 cm−1. It results probably from influence of carbonyl groups of lipopolysaccharides on amide I vibrations of proteins [12].
Figure 1B and 1C demonstrate absorbance bands at ν=1720 cm−1 which are assigned to stretching vibrations C=O (νC=O) and correspond to carboxyl groups in lipids and fatty acids. An increase in pH led to a decrease in band intensity, and new bands corresponding to asymmetric and symmetric stretching vibrations COO− were observed at ν=1590 cm−1 and ν=1400 cm−1, respectively. The reported spectral changes point to the deprotonation of the carboxyl group [6]. Similar correlations were observed by Ojeda in Aquabacteriumcommune and by Leonea in Bacillus subtilis [18,22].
The amide groups in proteins exhibited intense bands at approximately ν=1651 cm−1 and 1546 cm−1, which corresponded to amide I and amide II bands, respectively. The first band originates from stretching vibrations C=O (νC=O) in amide I, and the second band – from bending vibrations N−H (νN−H) and stretching vibrations C=N (νC=N) in amide II. Both bands may also correspond to bending vibrations N−H (νN−H) and N−H2 (νN−H2) from amines. The decrease in the intensity of the second band and its minor shift following an increase in pH could be attributed to the appearance of a new band in this region (ν=1590 cm-1 COO−) or changes in protein conformation.
Changes ascribed to symmetric (ν=1100 cm−1) and asymmetric (ν=1220 cm−1) stretching vibrations P=O (νP=O) of phosphate groups were also observed in the region of ν=1100-1220 cm−1. An increase in pH decreased the intensity of the ν=1100 cm−1 band, and new signals corresponding to asymmetric and symmetric stretching vibrations of the deprotonated phosphate group (νPO3, νPO2) appeared. The above indicates that phosphate groups contribute to the acid-base properties of the examined bacterial cell surfaces.
The region between ν=950-1200 cm−1 was dominated by C−OH, C−C and C−O−C vibrations of polysaccharides and a signal (ν=1450 cm-1) from bending vibrations of the bonds in groups CH2 (δCH2) and CH3 (δCH3) present in teichoic acids, peptidoglycan, LPS and phospholipids.
The obtained FTIR spectra revealed changes as a function of pH. Those changes can probably be attributed to the composition of cell walls which contained mainly peptidoglycan.
Jiang et al. observed no differences in the region corresponding to phosphate groups in isolated cell walls of Gram-positive [12]. The above could result from similarities in the local coordination environment of phosphate groups in the phospholipids and in teichoic acids of Grampositive bacteria.
Significant changes were observed in the FTIR spectra of bacterial cells in the pH range of 2.6-5.6. No changes were noted at higher pH. It confirms the complete deprotonation of bacterial surface groups [6].
The analysis of FTIR spectra as a function of pH validate that carboxyl, amino and phosphate groups were the main contributors to the acid-base properties of bacterial cells [6].
XPS spectroscopy
The information about concentration active center of bacteria is useful information for optimization elecroseparation of microbial cells, controlled aggreagaes [6,10]. Excessive concentrations of O=OC/C and C=O/C were observed in comparison with N/C. The above could be attributed to the fact that the presence of carboxyl groups is not restricted to amides, as demonstrated by FTIR spectra. Our results are consistent with the findings of other authors [19,23]
An analysis of XPS spectra based on the model proposed by Dufrêne et al. supported the determination of the concentrations of the three major surface components of bacterial cells: peptides, polysaccharides and hydrocarbon-like compounds [15].
The content of major compounds of bacterial cell walls was determined by their composition: peptides and polysaccharides were derived mainly from peptidoglycan. Polysaccharides were also present in teichoic acids and lipopolysaccharides, whereas hydrocarbon-like compounds corresponded to lipid compounds (phospholipids, (lipo) teichoic acids).
Polysaccharide and peptide concentrations are rich in Grampositive bacteria due to the presence of a thick peptidoglycan layer [24,25].
According to obtained results, peptidoglycan thickness increased in the following order: E. coli<S. aureus <B. subtilis. The outer membrane of E. coli bacteria consisted of a phospholipid layer, and the highest concentrations of hydrocarbon-like compounds (37.8%). A similar molecular composition was reported by Leone et al. on the surface of B. subtilis – 61.5% (peptides), 30.2% (polysaccharides) and 8.4% (hydrocarbon-like compounds) [22].
According to Mozes et al., the concentration ratio of (HO−C, C− O−C)/C,C−(H,C) and C−(O,N)/C is a crucial determinant of surface hydrophobicity in bacteria [26]. According to the above authors, an hydrophobicity increases with an increase in the concentrations of group C−(H,C) which is associated with hydrocarbon-like compounds in a cell. Hydrophobicity decreases with an increase in the concentrations of groups HO−C, C−O−C)/C and C−(O,N)/C in polysaccharides. Hydrophobicity of bacterial cell is correlated with their order migration in electrophoretic separation during capillary zone electrophoresis [6,9].
The total content of polysaccharides and proteins was relatively higher than the concentrations of non-polar hydrocarbon-like compounds, which suggests that all the examined bacteria had hydrophilic character of surfaces.
NMR spectroscopy
The analyzed NMR spectra are highly similar, and they confirm structural similarities in bacterial cells which were composed mostly of peptidoglycan. The location of NMR signals indicates that the 13C chemical shift is determined mainly by the local carbon environment inside the peptide chain rather than the presence of adjacent chains. Our findings are largely consistent with the results reported by Kern et al. for isolated bacterial walls [25]. It was observed that peptidoglycan thickness of in bacterial cells has no significant influence on the 13C chemical shift [25]. The analyzed spectra differed most significantly in the intensity of the signal in the σ=75−85 ppm range which corresponds to polysaccharides.
Spectrometric analysis of bacteria
The purpose of spectrometric study was determination of protein influence onto Gram-positive bacteria recognition. In this method, a pure culture of a microorganism is applied as a thin layer on a MALDI target. Then, solution of a matrix is deposited, mainly HCCA (α-cyano-4-hydroxycinnamic acid), DHB (dihydroxybenzoic acid) dissolved in an organic solvent. The matrix serves as a medium for extraction and crystallization of proteins (and other components such as lipopolysaccharides), mainly bacterial ribosomal proteins, which are present in the largest amount in microorganism cells [27]. During evaporation of the solvent the extracted bacterial proteins undergo co-crystallization with the matrix and thus formed crystals are subsequently subjected to pulsed laser beam irradiation.
Spectra of Gram-positive bacteria registered for HCCA matrix were characterized by a smaller number of signals in comparison with spectra registered for DHB matrix. Peptidoglycan is the main component of cell walls of these bacteria. Probably disruption of cell walls during the laser ablation and ionization process was hindered by the multi-layer nature of peptidoglycan. Therefore, it was impossible to ionize a sufficient number of proteins. DHB matrix has been reported to facilitate cell wall disruption and protein extraction. The different nature of crystallization process results in different extraction mechanism of bacterial components. The signals obtained for IC MALDI TOF MS measurement were mostly of ribosomal-protein origin [27]. Circa 50% of the peaks of all bacteria unambiguously represented basic ribosomal proteins. The rest are cold-shock proteins, DNA-binding proteins and outer-membrane lipoproteins. Therefore, DHB will be the most favorable matrix for the analysis of lipoproteins, whereas in the case of intact cell measurements of DNA-binding proteins the use of HCCA will result in a higher number of signals [21]. Therefore, analysis of IC MALDI TOF MS of native bacteria strains with microorganisms culturing in stress condition (e.g. high pH, high concentration of metals) is powerful device in interpretation of physicochemical phenomena taking place at the interface.
Conclusion
The chemical composition and the functionalities of Gram-positive bacteria (B. cereus, B. subtilis, S. lutea, S. aureus(1) and M. luteus) were analyzed. The following conclusions can be formulated based on our findings:
1) FTIR spectra revealed the presence of three major functional groups (carboxyl, amino and phosphate groups) on the surface of bacterial cells, thus confirming a relationship between the acid-base properties of microorganisms and their chemical composition.
2) The obtained spectra supported the determination of the three major surface components of bacterial cells: peptides, polysaccharides and hydrocarbon-like compounds.
3) The 13C NMR spectra of six bacterial species were registered. The applied methodology supports the identification of carbon atoms in different functional groups: carbonyl, aromatic, alkyl groups or a carbon atom bonded with hydroxyl groups. Our results show that chemical and structural differences in the cell wall composition of Gram-positive bacteria can be detected.
4) IC MALDI TOF MS provided molecular recognition of examined bacteria strains and can be a complement approach to determine the effect of the mostly protein on cell metabolism.
5) Our findings indicate that FTIR, XPS and NMR spectroscopy with IC MALDI TOF MS are valuable tools for investigating the composition of bacteria in relation to their behavior at nanoscale interfaces, such as bacterial aggregation, adhesion to solid surfaces and electroseparation processes.
Acknowledgements
This study was supported by Symfonia I grant No. 2013/08/W/N28/00701 and Preludium grant No. 2013/11/N/ST4/01835 from the National Science Centre in Warsaw, Poland, as well as by grants from the European Social Found, the Polish National Budget and the budget of the Kujawsko-Pomorskie Region as a part of the “Krok w przyszlosc V” (Step into the Future V) Sectoral Operational Program - Human Resources, 2013-2014.
References
- Poortinga AT, Bos R, Norde W, Busscher HJ (2002) Electric double layer interactions in bacterial adhesion to surfaces. Surf Sci Rep 47: 1-32.
- Camesano TA, Abu-Lail NI (2002) Heterogeneity in bacterial surface polysaccharides, probed on a single-molecule basis. Biomacromolecules 3: 661-667.
- Makin SA, Beveridge TJ (1996) The influence of A-band and B-band lipopolysaccharide on the surface characteristics and adhesion of Pseudomonas aeruginosa to surfaces. Microbiology 142 : 299-307.
- Doyle RJ, Matthews TH, Streips UN (1980) Chemical basis for selectivity of metal ions by the Bacillus subtilis cell wall. J Bacteriol 143: 471-480.
- Van der Wal A, Norde W, Zehnder AJB, Lyklema J (1997) Determination of the total charge in the cell walls of Gram-positive bacteria.Colloids Surf B 9: 81-100.
- Dziubakiewicz E, Hrynkiewicz K, Walczyk M, Buszewski B (2013) Study of charge distribution on the surface of biocolloids. Colloids Surf B Biointerfaces 104: 122-127.
- Klodzinska E, Szumski M, Dziubakiewicz E, Hrynkiewicz K, Skwarek E, et al. (2010) Effect of zeta potential value on bacterial behavior during electrophoretic separation. Electrophoresis 31: 1590-1596.
- Armstrong DW, Schulte G, Schneiderheinze JM, Westenberg D (1999) High efficiency separation of microbial aggregates using capillary electrophoresis. Anal Chem 71: 5465-5469.
- Klodzinska E, Buszewski B (2009) Electrokinetic detection and characterization of intact microorganisms. Anal Chem 81: 8-15.
- Horká M, Karasek P, Ržika F, Dvorackova M, Sittova M, et al. (2014) Separation of methicillin-resistant from methicillin-susceptible staphylococcus aureus by electrophoretic methods in fused silica capillaries etched with supercritical water. Anal Chem 86: 9701-9708.
- Al-Holy MA, Lin M, Cavinato AG, Rasco BA (2006) The use of Fourier transform infrared spectroscopy to differentiate Escherichia coli O157:H7 from other bacteria inoculated into apple juice. Food Microbiol 23: 162-168.
- Jiang W, Saxena A, Song B, Ward BB, Beveridge TJ, et al. (2004) Elucidation of functional groups on gram-positive and gram-negative bacterial surfaces using infrared spectroscopy. Langmuir 20: 11433-11442.
- Dittrich M, Sibler S (2005) Cell surface groups of two picocyanobacteria strains studied by zeta potential investigations, potentiometric titration, and infrared spectroscopy. J Colloid Interface Sci 286: 487-495.
- Eboigbodin KE, Newton JR, Routh AF, Biggs CA (2006) Bacterial quorum sensing and cell surface electrokinetic properties. ApplMicrobiolBiotechnol 73: 669-675.
- Dufrêne YF, van der Wal A, Norde W, Rouxhet PG (1997) X-ray photoelectron spectroscopy analysis of whole cells and isolated cell walls of gram-positive bacteria: comparison with biochemical analysis. J Bacteriol 179: 1023-1028.
- Tsuneda S, Aikawa H, Hayashi H, Hirata A (2004) Significance of cell electrokinetic properties determined by soft-particle analysis in bacterial adhesion onto a solid surface. J Colloid Interface Sci 279: 410-417.
- Hamadi F, Latrache H, Zahir H, Elghmari A, Timinouni M, et al. (2008) The relation between Escherichia coli surface functional groups' composition and their physicochemical properties. Braz J Microbiol 39: 10-15.
- Ojeda JJ, Romero-Gonzalez ME, Bachmann RT, Edyvean RG, Banwart SA (2008) Characterization of the cell surface and cell wall chemistry of drinking water bacteria by combining XPS, FTIR spectroscopy, modeling, and potentiometric titrations. Langmuir 24: 4032-4040.
- Leone L, Loring J, Sjöberg S, Persson P, Shchukarev A (2006) Surface characterization of the Gram-positive bacteria Bacillus subtilis - an XPS study. Surf Interface Anal 38: 202-205.
- Boonaert CJ, Rouxhet PG (2000) Surface of lactic acid bacteria: relationships between chemical composition and physicochemical properties. Appl Environ Microbiol 66: 2548-2554.
- Krásny L, Hyneka R, Hochel I(2013) Identification of bacteria using mass spectrometry techniques. IJMS 353: 67-79
- Leone L, Ferri D, Manfredi C, Persson P, Shchukarev A, et al. (2007) Modeling the acid-base properties of bacterial surfaces: A combined spectroscopic and potentiometric study of the gram-positive bacterium Bacillus subtilis. Environ SciTechnol 41: 6465-6471.
- Ahimou F , Boonaert CJ, Adriaensen Y, Jacques P, Thonart P, et al. (2007) XPS analysis of chemical functions at the surface of Bacillus subtilis. J Colloid Interface Sci 309: 49-55.
- Cuperus PL, Van der Mei HC, Reid G, Bruce AW, et al. (1993) Physicochemical surfaces characteristics of urogenital and poultry lactobacilli.J Colloid InterfSci 156: 319-324.
- Kern T, Giffard M, Hediger S, Amoroso A, Giustini C, et al. (2010) Dynamics characterization of fully hydrated bacterial cell walls by solid-state NMR: evidence for cooperative binding of metal ions. J Am ChemSoc 132: 10911-10919.
- Mozes N, Léonard AJ, Rouxhet PG (1988) On the relations between the elemental surface composition of yeasts and bacteria and their charge and hydrophobicity. BiochimBiophysActa 945: 324-334.
- Khot PD, Couturier MR, Wilson A, Croft A, Fisher MA (2012) Optimization of matrix-assisted laser desorption ionization-time of flight mass spectrometry analysis for bacterial identification. J ClinMicrobiol 50: 3845-3852.
Relevant Topics
Recommended Journals
Article Tools
Article Usage
- Total views: 19827
- [From(publication date):
February-2015 - Jul 06, 2025] - Breakdown by view type
- HTML page views : 14910
- PDF downloads : 4917

