Assessments of Food Waste Practices for the Reductions of Greenhouse Gas Emissions in Selected Cities of Ethiopia
Received: 15-May-2023 / Manuscript No. EPCC-23-98807 / Editor assigned: 18-May-2023 / PreQC No. EPCC-23-98807 (PQ) / Reviewed: 02-Jun-2023 / QC No. EPCC-23-98807 / Revised: 01-Mar-2024 / Manuscript No. EPCC-23-98807 (R) / Published Date: 08-Mar-2024
Abstract
By the year 2050, the global food system must feed nine billion people, out of which around 8 billion would be in developing countries. And also the global community should change the food system to achieve sustainable development goal which is to end hunger, achieve food security and improved nutrition and promote sustainable agriculture by 2030. Most importantly, in the year 2017, the tragic landslide at the waste collection site at the place known as kosher in the capital of Ethiopia killed 116 people. This landfill was 30% arise from food waste. Nevertheless, it is estimated that at least 21% of all food produced in Sub Saharan African countries is wasted. Food systems account for 24% of global greenhouse gas emissions. As a result, the study of assessments of food waste practices for the reduction of greenhouse gas emissions in the selected cities of Ethiopia was undertaken with the main focus on food waste prevention, As is seen from the data (n=50), 48% of our respondents were holders of MSc degree, 24% Ph.D. degree, 22% primary education level respondents and the remaining 6% BSc degree holders. On the other hand, 78% of our respondents were fully employed, 50% were in the age range of 30 to 40, and 28%. Moreover, 58% have an income of ≥ 10,000 local currency and pay for food 40% of their income per month. For the correlation between the city of the living and the money spend on food, P-value was 0.15 indicating there was no correlation between respondents’ area of living and the amount of money spent on food purchases. The amount of money they usually pay for food per their family members per week is ≥ 1000 which means they spend approximately 40% of their income per month which is a significant amount. Moreover, correlation analysis between income range and the money spent on food purchases per week shows that the P-value of 0.2 indicates there was no correlation between income and food expenditures. Incredibly 84% said they don’t consume all that they purchased indicating they are no plan for food purchasing, producing avoidable food waste, and 92% replied that they never record their meal and snack including when, why and how much they usually consume, which is another indicator of bad food habits which also leads to eating disorders.
Keywords
Food waste; Eating disorder; Hunger-reduction; Climate change
Introduction
By the year 2050, the global food system must feed nine billion people, out of which around eight billion would be in developing countries. This implies the need for a major transformation in food systems particularly in developing countries. And also the global community should change the food system to achieve sustainable development goal which is to end hunger, achieve food security and improved nutrition and promote sustainable agriculture by 2030 [1].
Furthermore, the UN sustainable development goal 12.3 aims to halve food waste at the retail and consumer level and to reduce food loss across supply chains. However measuring food loss and waste on a national, regional and global scale is not easy, but methodologies and tools are being developed to allow us to measure progress [2]. Nevertheless, roughly 1/3 of the food produced in the world for human consumption is lost or wasted [3]. For sustainability issues, food waste alone generates about 10% of global greenhouse gas emissions. Shockingly if food waste were a country, it would be the third largest emitting country in the world. In a more clear explanation: Food waste emits more greenhouse gases than all single countries in the world except China and the US.
Moreover, within a sustainability framing, the task of building and strengthening the capacity of food systems to respond to risks arising from urban sprawl is arguably urgent for developing countries. As a result, developing countries need to adopt holistic and integrated approaches that consider all the elements and activities of the food chain relating both to supply and demand sides including the production, processing, distribution, preparation, and consumption of food and the output of these activities. In addition to this, food waste presents one of the demand side components of the food system that received little attention by both research and policy in addressing issues related to urbanization, food systems, food security and sustainable development. Incredibly it is estimated that at least 21% of all food produced in Sub-Saharan African countries is wasted. Even so, preventing, reducing, and managing food waste along the food value chains in these countries can lessen pressures on fragile food systems, reduce greenhouse gas emissions, and enhance food security and nutrition.
To this end, the selection of Ethiopia for our research network and as a case study for the exploratory study is justified by the fact that urbanization, food loss and waste, food insecurity and under nutrition are ubiquitous and one of the biggest challenges that the country facing today. Moreover, urbanization is accelerating rapidly and it is projected that the urban population will triple to 42.3 million by 2040, growing at 3.8% a year. However, food security remains a critical issue in the country, which has one of the highest levels of chronic under nutrition in the world. But shockingly, significant proportions of food get lost or wasted at various stages of the food chain from production to consumption. Altogether these characteristics make Ethiopia a good case for studying the interplay between urbanization, food waste and loss, food security and the reductions of greenhouse gases that are emitted from this tremble food waste and losses.
To this end to tackle food waste, understanding the problem is key to finding good solutions. A first step is to measure the amount of food that goes to waste and to understand where along the supply chain the waste is happening. As a result, depending on where it happens along the supply chain, we use the terms food loss or food waste.
Food loss refers to any food that is discarded, incinerated, or otherwise disposed of along the food supply chain from harvest/ slaughter/catch up to, but excluding the retail level, and is not used for any other productive use, such as animal feed or seed purposes. Food waste refers to food that is discarded at the level of retailers, food service providers, and consumers. Shockingly food is wasted in many ways, for example, fresh produce that deviates from what is considered optimal (e.g. size, shape, or color) and is removed during sorting actions, foods that are discarded by retailers or consumers when they are close to or beyond the best before date, unused or leftover food that is thrown out from households or restaurants and also in so many other ways.
For instance, is anybody go into a supermarket, buy three shopping bags of food, and then immediately throw one away? Surprisingly, statistically speaking that’s what’s happening to our food today. Moreover, one third of all the food that is produced for human consumption is wasted. But when we waste food, we waste all the resources that go into producing and transporting the food, such as land, water and fuel use, without gaining any of the benefits of feeding people. Furthermore, when food ends up in landfills it also contributes to greenhouse gas emissions. However food waste remains a problem even in Europe and around the world today.
As the latest estimates suggest around 931 million tons of food waste were generated in 2019, out of which: 61% came from households, 26% from food service and 13% from retail. However, previous estimates of consumer food waste significantly underestimated its scale: Despite data uncertainties, food waste at the consumer level (household and food service) appears to be more than twice the amount that was estimated by the FAO in 2011. Regarding the data from the EU, around 88 million tonnes of food waste are generated annually. Shockingly this is equal to 174 kg per person or 143 billion euros or 170 000 000 tonnes of CO2. Concerning this estimates show that up to 10% of the 88 million tonnes of food waste that is generated in the EU every year are linked to 53% of consumers don’t know the meaning of “best before” labeling and 60% of consumers don’t know the meaning of “use by” labeling [4].
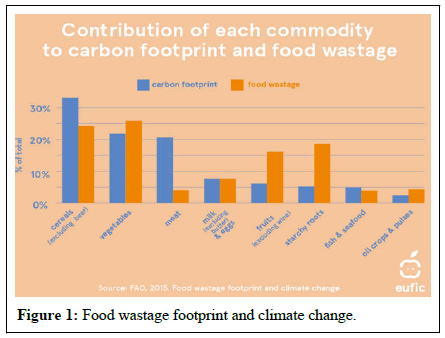
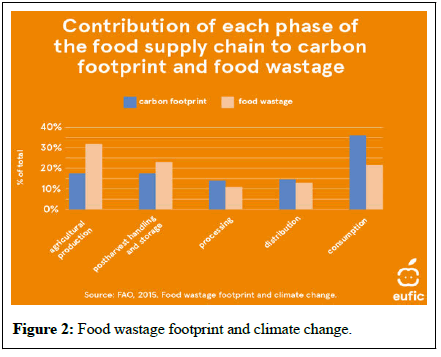
Surprisingly levels of food waste are similar in high, upper middle and lower middle income countries in Europe. But as a good solution, The EU’s farm to fork strategy has set the reduction of food loss and waste as an important part of the strategy and proposes to set legally binding targets to reduce food waste across the EU by 2023. However the further along the supply chain the food loss occurs, the more carbon intensive the loss and waste. This happens as a result of more resources have gone into producing for example tomato sauce (processing, transport, retail, and packaging, in addition to land and water use and farming) that can be bought in the supermarket than has gone into a tomato picked directly from the field (Figure 1).
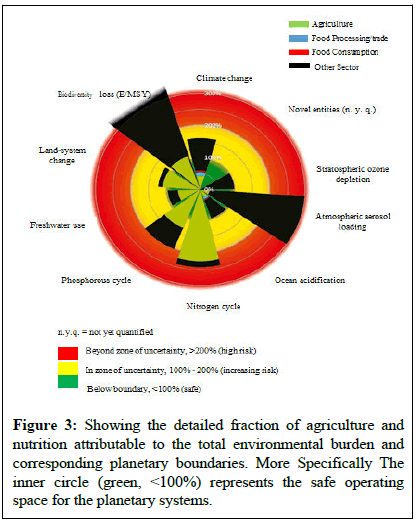
Due to their nutrient contents, different foods have different environmental impacts. As an example, the volume of meat that is wasted and lost is not very high compared to foods such as cereals and vegetables [5]. Nevertheless, meat requires much more resources to produce, so wasting meat still has a significant impact on climate change (estimated to contribute to 20% of the carbon footprint of total food waste and loss). So consumers can have a direct impact on the food waste problem by paying attention to our behavior (Figures 2 and 3).
On the other hand, the middle circle (yellow, 100%-200%) means the zone of uncertainty (increasing risk), whereas the outer circle (red, >200%) represents the zone with high environmental damage (high risk).
The global food systems have radically changed over the last 50 years. To this end, food production has more than doubled, diets have become more varied (and often more energy-intense), satisfying people’s preferences in terms of form, taste, and quality and numerous local, national and multi-national food related enterprises have emerged providing livelihoods for millions. However, over 800 million people are still hungry (70% of whom live in rural areas of developing countries), about two billion suffer from poor nutrition, and over two billion are overweight or obese [6]. In more general terms, of all economic activities, the food sector has by far the largest impact on natural resource use and the environment. This incredible influence is also supported by the following facts and figures as following. It is estimated that 60% of global terrestrial biodiversity loss is related to food production; food systems account for around 24% of the global greenhouse gas emissions and an estimated 33% of soils are moderate to highly degrade due to erosion, nutrient depletion, acidification, salinization, compaction and even more dangerous chemical pollution.
The global food systems working group of the international resource panel has prepared a comprehensive scientific assessment of the current status and dynamics of natural resource use in food systems and their respective environmental impacts. To this end, the IRP identifies opportunities for resource smart food systems to respond to policy relevant questions like what do sustainable food systems look like from a natural resource perspective. How can resource efficiency improvements are made to enhance food security. How to steer t transition toward sustainable food systems? [7].
The report also further looks at food as a crucial connection point (a ‘node’) where various societal issues coincide, such as human dependence on natural resources, the environment, health and wellbeing. However, rather than looking separately at resources such as land, water and minerals, the IRP has chosen a systems approach. The also looks at all the resources needed for the primary production of food, as well as for other food system activities (e.g., processing, distribution) considering not only the set of activities but also the range of actors engaged in them and the outcomes in terms of food security, livelihoods and human health.
On the other hand, when it comes to our health, the food we put in our body can have a significant effect, especially when it comes to our heart. Especially on the aspects of weight gain, physical inactivity, stress, high blood pressure, high cholesterol and obesity can greatly increase the risks of heart disease and various cancers [8]. This also depends on what types of food we are eating can cause our heart to pump harder and exert more energy. This could eventually lead to heart failure and a heart attack. Shockingly dietary choices are a leading global cause of mortality and environmental degradation and threaten the attainability of the UN’s sustainable development goals and the Paris climate agreement. Most importantly, in the year 2017, the tragic landslide at the waste collection site at the place known as kosher in the capital of Ethiopia killed 116 people. This landfill was 30% arise from food waste.
As a result of serious problems the study of assessments of food waste practices for the reductions of greenhouse gas emissions in the selected cities of Ethiopia with the main focus on food waste prevention, is done to understand the current behavior of the community regarding food waste, how they plan their food purchases, what they usually do with food waste, the exact amounts food that is wasted and estimating the possible reductions of the greenhouse gases that are emitted from this category of wastes [9]. The method that was used was: Questionnaire was dispatched to the relevant stakeholders of (n=50), the results were analyzed and useful know how and appreciative recommendations were drawn.
Health and environmental impacts of food practices
The dietary choices humans make today are a leading global cause of mortality and environmental degradation and threaten the attainability of the UN’s sustainable development goals and the Paris climate agreement. Moreover, the food choices are shifting globally in ways that are negatively affecting both human health and the environment. According to a study by Michael AC, et al., consuming an additional serving per day of each of 15 foods is associated with 5 health outcomes in adults and 5 aspects of agriculturally driven environmental degradation.
As a result of food consumption and production human health and environmental degradation are occurring from its direct impacts. The reduced air quality resulting from food production which is responsible for∼20% of deaths from air pollution is among the most significant ones [10]. Similarly, food production is the largest stress to biodiversity through habitat destruction and nutrient pollution, with food production threatening >70% of birds and mammals that are listed as threatened with extinction by the International Union for Conservation of Nature (IUCN). These also accompanied by the global diets have been shifting toward greater consumption of foods associated with increased disease risk or higher environmental impacts and are projected to lead to rapid increases in diet related diseases and environmental degradation.
To this end, bad food practices such as unplanned eating, overeating, and eating too much food like salt, sugar and saturated fat supported by physical inactivity will lead to being overweight or obese, tooth decay and high blood pressure. High cholesterol, heart disease, stroke, type 2 diabetes, osteoporosis, some cancers, depression, and eating disorders.
Problem statement
Surprisingly today, an estimated one third of all the food produced in the world which would have been used goes to waste. To put this in a more detailed manner that’s equal to about 1.3 billion tons of fruits, vegetables, meat, dairy, seafood and grains that either never leave the farm, get lost or spoiled during distribution or are thrown away in hotels, grocery stores, restaurants, schools, or home kitchens. However, it could be enough calories to feed every undernourished person on the planet.
On the other hand, wasted food isn't just a social or humanitarian concern it's a serious environmental issue. Whenever the food was wasted, it is also the waste of all the energy and water it takes to grow, harvest, transport and package it. On the other hand, if food goes to the landfill and rots, it produces methane a greenhouse gas even more dangerous than carbon dioxide. About 10% of all human caused greenhouse gas emissions could be reduced if we stop wasting food. Shockingly, In the US alone, the production of lost or wasted food generates the equivalent of 32.6 million cars worth of greenhouse gas emissions.
As Ethiopia’s population continues to grow, the challenge should not be how to grow more food to feed more people, but it should be wasting less of what is already produced. However, the true scale of food waste and its impacts have not been well understood until now. As such, the opportunities provided by food waste reduction have remained largely untapped and under exploited. Most importantly, in the year 2017, the tragic landslide at the waste collection site at the place known as kosher in the capital of Ethiopia killed 116 people. This landfill was 30% arise from food waste. About this, there are plenty of actions we can take at the consumer level to make a significant difference. Gently starting from delivering leftovers to those in need to freezing food, shopping smarter or planning, composting to keep inedible scraps out of landfills, or using any other wise methods, we can all take small steps to curb our emissions.
Objectives
The general objective of this study is to evaluate the practices of food waste to reduce greenhouse gas emissions in Addis/Ethiopia.
The specific objectives of this study are:
• To Evaluate the exact amount of food that is wasted in this city’s.
• To investigate the communities’ practices regarding how they plan
their food and the waste generated from it.
• To conduct an exploratory study to investigate the inter linkages
between food waste and food security in urban and peri-urban areas
of Addis Ababa in Ethiopia.
• To create awareness for good food management practices including
the generation and processing of food waste.
• To create some appropriate way to process and deliver to the needy.
• To establish some framework for food waste reduction and hence
reduce the greenhouse gas emissions from this sector.
Materials and Methods
Study site
The study was undertaken to assess the food practices of the community living in the selected cities of Ethiopia (Finfine, Sebeta, Adama, Bishoftu, Burrayu, Sululta and Sendafa). The criteria to select these cities are based on their closeness to the capital of the country, their development status and internet accessibility for the respondents to fill out Google generated questionnaire. The other selection criteria were also the education level of the respondents which is important to understand the exact aim of our research. The cities and respondents were randomly and also to some extent systematically selected to make sure all required information was gathered.
The collected information of the respondents includes age categories, employment status, family number and income range. The other questions asked the respondents were: The amount of money they pay for food per family per week, the person responsible for the purchase of the food, whether they plan their food whenever they want to buy their food, how often they plan, whether they eat all the food they purchased, how often they go for food purchases provided that some foods are still available at their refrigerator, respondents categories concerning if they are (muscle builders, pregnant women, long-distance athlete or other). The respondents were also asked about their feeling whenever they eat food (uncomfortable and bloated after eating; lack of control over what and how much you consume; eating until you’re uncomfortably full and consuming large portions when you’re not hungry), whether they record their meals and snacks including when, why and how much you eat, what they normally do with their food wastes whether they do the following activities (processing and using as food again; throwing away as waste and Processing and giving to needy). The respondents were also asked whether they think there is food wastage in their household and if there is, how they think how could be optimized for the reduction of food waste in their opinion (Figure 4).
Results and Discussion
Food composition and its greenhouse gas emission potentials
The results show in Table 1.
| Number | Food | Greenhouse gas emissions per kilogram kgCO₂eq per kilogram | Food consumption per adult per year for Ethiopia |
|---|---|---|---|
| 1 | Bananas | 0.86 kg | 5.1 kg |
| 2 | Barley | 1.18 kg | 44 kg |
| 3 | Beef (beef herd) | 99.48 kg | 8.4 kg |
| 4 | Cane sugar | 3.20 kg | 9.49 kg |
| 5 | Cheese | 23.88 kg | 0.8 kg |
| 6 | Coffee | 28.53 kg | 2.6 kg |
| 7 | Eggs | 4.67 kg | 0.475 kg |
| 8 | Fish (farmed) | 13.63 kg | 0.400 kg |
| 9 | Maize | 1.70 kg | 66.7 kg |
| 10 | Milk | 24. 5 kg | 16.6 kg |
| 11 | Fresh fruit | 1.05 kg | 7 kg |
| 12 | Potatoes | 0.46 kg | 7.07 kg |
| 13 | Poultry meat | 9.87 kg | 0.690 kg |
| 14 | Rice | 4.45 kg | 6.5 kg |
| 15 | Tomatoes | 2.09 kg | 26 kg |
| 16 | Wheat and rye | 1.57 kg | 77 kg |
Table 1: Common food type with GHG emissions potential.
GHG emission reduction through consumers
As we can see from the above Table 1 the greenhouse gas emissions per kilogram kgCO₂eq per person for this 16-food type is approximately around 1764.92 kilogram kgCO₂eq of CO2 emissions. However, for the population of Ethiopia, kilogram kgCO₂eq of emission is approximately around 211.80 billion kgCO₂eq of emissions. Nevertheless, if good food practices such as food purchase planning, food waste reduction, food waste processing and reuse including offering to the needy and avoiding eating disorder habits such as eating in an out of control way, eating without feeling hungry, and reducing the size of food to be eaten and similar food behavioral change is implemented, this CO2 emission will be halved, which means for the whole population the kgCO₂eq is around 105.9 billion and 882.46 kgCO₂eq per person per year. This indicates that this action will drastically reduce GHG emissions significantly.
This idea was also supported by other studies in the area as follows. Today and in the future, dietary change can deliver environmental benefits on a scale not achievable by producers. Concerning this, moving from current diets to a diet that excludes animal products has transformative potential, reducing food’s land use by 3.1 (2.8 to 3.3) billion ha (a 76% reduction), including a 19% reduction in arable land; food’s GHG emissions by 6.6 (5.5 to 7.4) billion metric tons of CO2eq (a 49% reduction); acidification by 50% (45 to 54%); eutrophication by 49% (37% to 56%); and scarcity weighted freshwater withdrawals by 19% (−5% to 32%) for a 2010 reference year. These ambitions will only achieve by changing food practices that include using vegetable proteins with impacts between the 10th and 90th percentile impacts of existing production. In addition to the reduction in food’s annual GHG emissions, the land no longer required for food production could remove ~8.1 billion metric tons of CO2 from the atmosphere each year over 100 years. As a result, food habits and dietary changes have the potential for a far greater effect on food’s different emissions, reducing them by 61% to 73%.
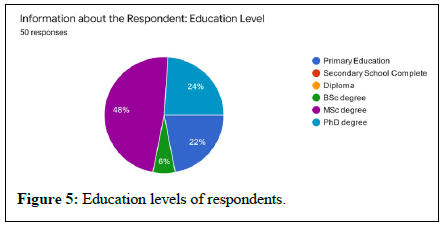
Moreover, reducing the consumption of food like (oils, sugar, alcohol and stimulants) by 20% by avoiding production with the highest land use reduces the land use of these products by 39% on average. For emissions, the reductions are 31% to 46% and for scarcity weighted freshwater withdrawals 87% (Figure 5).
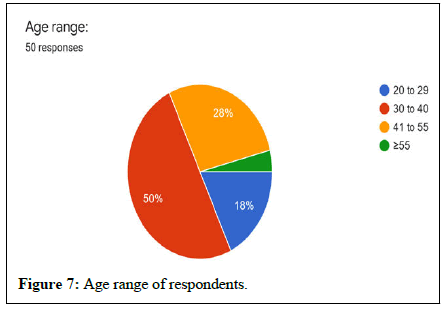
As it is seen from the data (n=50), 48% of our respondents were holders of MSc degrees, 24% Ph.D. degrees, 22% were primary education level respondents and the remaining 6% were BSc degree holders. This shows how our sampling was representative which interns very important to figure out how important food practice changes are (Figures 6 and 7).
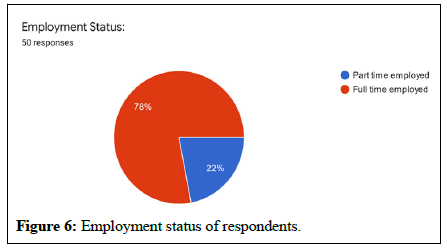
Figure 8 shows that more than 78% of our respondents were fully employed. For figure 6, 50% of our respondents were in the age range of 30 to 40, 28% were in the range of 41 to 55 and the remaining were in the category of 20 to 29 age ranges. As a result, full time employment is one of the important aspects which determine the permanent income of the community which is also important since it enables them to purchase the type and size of the food they need and is not necessary to them.
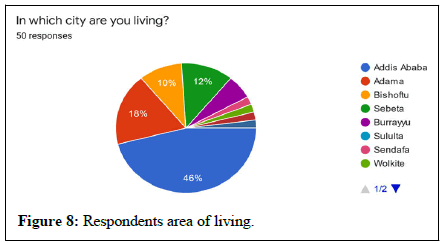
According to our statistical analysis of the correlation between the community’s city of living and the amount of money they spend per weak on food purchases, its P-value was 0.15 which is greater than the P-value of 0.05, indicating there was no correlation between respondents’ area of living and the amount of money spent on food purchases. This also indicates how awareness creation of good food habits is important to the whole community in the perspective of economic and environmental aspects of food expenditures and food waste (Figures 9 and 10).
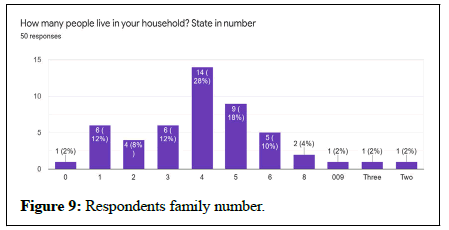
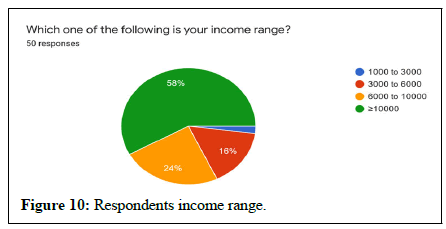
From Figure 9, the thing we noticed is that the most common number of family members of our respondents is 4 with an approximate value of 28% and 5% with an approximate value of 18%. The number of family members is important to determine the amount of food required and hence the respective waste to be generated. For Figure 10, which shows the income range of the respondents, more than 58% of them replayed with the value ≥ 10,000 local currency which is per the country categorized as high income which in turn important in budgeting for food consumption and respective waste generations (Figure 11).
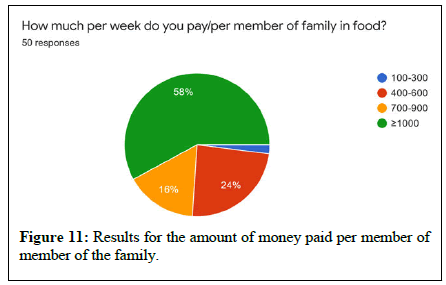
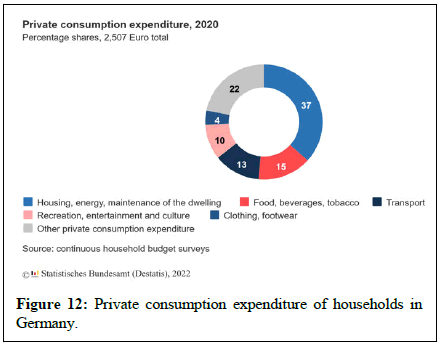
As far as the results of Figure 11 are concerned, the respondent’s amount of money they usually pay for food per their family members per weak is ≥ 1000 which means they spend approximately 40% of their income per month which is a significant amount. But private consumption expenditure of households in the time comparison Germany’s food, beverages and tobacco account for 15% of expenditures which shows how the problem is serious in this country. On the other hand, according to our statistical analysis to determine the correlation between income range and the money spent on food purchases per week, it shows that the P-value of 0.2 is far greater than the significant p-value of 0.05 indicating there was no correlation between income and food expenditures. It also indicates that those with low income spend an almost equal amount of money on food with those having a double or triple amount of income which also shows a lack of bad food expenditure habits. Furthermore, if their other monthly expenses such as house rental, school fees, clothing, and health care fee are added to this amount, it means they are saving almost negligible amounts of money for future life and emergency case scenarios (Figures 12 and 13).
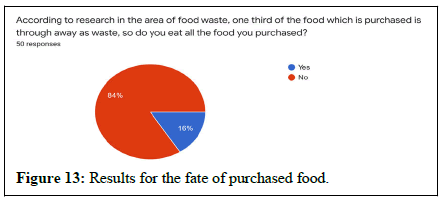
According to the research in the area of food waste, one-third of the food purchased is a waste, as a result the respondents whether they eat all food that they purchased. Incredibly 84% of our respondents replied they don’t consume all that they purchased indicating they are purchasing. Without a plan and generating avoidable food wastes (Figure 14).
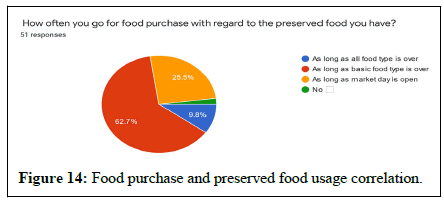
According to Figure 15, 62.7% of the respondents said that they go for food purchasing even though they have preserved food as long as the basic food type is over which indicates how they are not planning their food purchase and make use of the preserved food they have. On the other hand, almost 26% of the respondents said that they go for food purchases as long as market days are open even if they have preserved food which also indicates they are not planning their food and also do not make use of the preserved food they have.
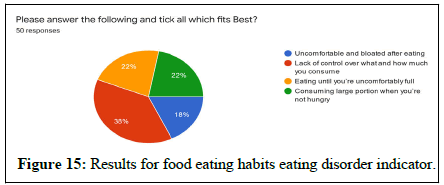
In Figure 16, the result are about this selected communities food eating habits including (whether they feel uncomfortable and bloated after eating; if they have a lack control over what and how much they consume during their meal; if they eat until they are uncomfortably full and also if they consume large portion when they are not hungry). Shockingly the result shows that 38% of our respondents said that they have a lack of control over what and how much they consume, whereas 22% of them replayed that they used to eat until they were uncomfortably fully. On the other hand, approximately 22% of them said they usually consume large portions of food even though they are not feeling hungry which is incredibly the most concerning sign of an eating disorder which exposes them to different health issues and is detrimental to the environment since they are not just wasting the food but also the land required to produce this food, the energy required, water required and different chemicals that were used throughout the production and transportation stages.
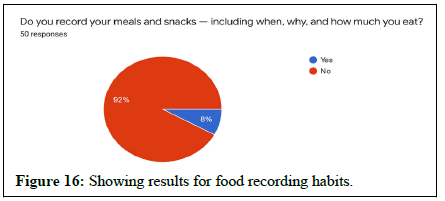
As far as the result displayed in Figure 17 are concerned, it is about this communities food recording habits specifically their meals and snack regarding when, why and how much they usually consume. Incredibly, 92% of our respondents replied that they never record their meals and snack including when, why and how much they usually consume, which is another indicator of bad food habits which also leads to eating disorders.
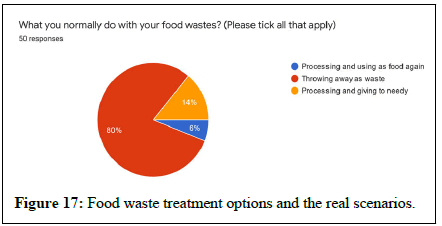
According to scientific data, from 4 bags bought from the supermarket, one bag of food is through away as waste. As a result, to determine if this case is true we asked our respondents what actually they do with their food waste including (whether they process and use it as food again; maybe if they through always as waste and also if they are merciful enough to process and giving this food to the needy which are suffering from hunger including 15 million facing hunger today (FAO report), however, 80% our respondents replied that they throwing away their food waste which is incredibly shocking figure bearing in mind the current world scenarios.
The last but not least question we asked our respondents was ‘’if they think there was food wastage in their household? If yes, how do they think we could optimize the reduction of food waste in their opinion? Surprisingly almost all of our respondents replied yes to our questions and given as the following recommendations about how we can address our food waste:
• We need to plan what to eat, what to buy, and record daily
consumption. We also need to advise our housemaid.
• Reuse, especially Enjira. I have tried it and processed Fifer.
Sometimes, some fruit and vegetables become spoiled.
• Instructing the housemaid and managing what to buy and eat is
important.
• Processing and giving to the needy.
• Planning food purchases; processing and using food waste;
processing and giving to the needy.
• Rarely, are cooking and eating must be balanced.
• Preservation and sharing.
• By processing and using again in a different form.
• Formal and informal training at the individual as well as at societal
levels.
• Use the refrigerator to reduce food waste and it is recommended to
use food remains for plant garden areas.
Conclusion
In conclusion, for (n=50), 48% of our respondents were holders of an MSc degree, 24% Ph.D. degree, 22% were primary education level respondents, and the remaining 6% were BSc degree holders. To this end, 78% of our respondents were fully employed and 50% of them were in the age range of 30 to 40, 28% were in the range of 41 to 55 and the remaining were in the category of 20 to 29 age ranges. For the correlation between the city of living and the money they spend on food, P-value was 0.15 which is greater than the P-value of 0.05, indicating there was no correlation between respondents’ area of living and the amount of money spent on food purchases.
In the income range, more than 58% have ≥ 10,000 local currency which is per the country it is high income which in turn is important in budgeting for food consumption and respective waste generations.
The amount of money they usually pay for food per their family members per weak is ≥ 1000 which means they spend approximately 40% of their income per month which is a significant amount. Moreover, analysis to determine the correlation between income range and the money spent on food purchases per weak shows that the P value of 0.2 was far greater than the p value of 0.05 indicating there was no correlation between income and food expenditures. Incredibly 84% of our respondents replied they don’t consume all that they purchased indicating they are purchasing. Without a plan and generating avoidable food wastes.
62.7% of the respondents said that they go for food purchasing even though they have preserved food as long as basic food type is over and 26% of the respondents said that they go for food purchase as long as market day are open even if they have preserved food which also indicates they are not planning their food and also not make use of the preserved food they have. In communities’ food eating habits 38% said that they lack control over what and how much they consume, whereas 22% of them replayed that they used to eat until they were uncomfortably full. They also recommended mainly the need to plan what to eat, what to buy, and record daily consumption.
Recommendations
Based on our assessment results and also the guidelines from organizations including WHO and UNEP, many sustainable development goals and targets mainly related to the area of food, food waste, health and climate change, we would like to give the following recommendations:
• First and for most, let’s plan our food purchase to reduce the amount
of waste generated from it and hence reduce its environmental
impacts.
• Second of all as long as we have preserved food in our refrigerator,
let’s use it by taking into account all necessary measures.
• Third of all whenever we prepare our food make sure that we are
preparing as small amount as we can which intern influence us to
eat too much.
• Fourth of all whenever we eat food let’s aim for its nutritional
contents rather than its size.
• Fifth of all based on health safety guidelines process your food
waste to reuse it or maybe for giving it to the needy last but not
least, corporate physical activity for our full health and well-being.
• If all these recommendations will be implemented, it is just our
health and our economy which dramatically improve, but also, we
can drastically reduce our ecological footprint and other negative
impacts on our environment.
Data Availability Statement (DAS)
The datasets generated during and/or analyzed during the current study are available from the corresponding author upon reasonable request.
Acknowledgments
I am very grateful to God to make these remarkable journeys possible. I am especially grateful to CIPSEM and TUD (Technological University of Dresden) to the staff for their exceptional hospitality. My gratitude is spatial to my supervisor Dr. Serena Caucci for her extremely useful advice throughout the work and assistant Supervisor Zeynep Ezkul for her advice; it is remarkable for me I learned a lot from it. I also want to thank Dr. Dietmar Lohmann for their noble advice and support which is extremely important for me to do my work as I should have to.
References
- Hatab AA, Cavinato ME, Lindemer A, Lagerkvist CJ (2019) Urban sprawl, food security and agricultural systems in developing countries: A systematic review of the literature. Cities 94: 129-142.
- Badreldin N, Abu Hatab A, Lagerkvist CJ (2019) Spatiotemporal dynamics of urbanization and cropland in the Nile Delta of Egypt using machine learning and satellite big data: Implications for sustainable development. Environ Monit Assess 191: 1-23.
- Leinfelder RR, Hamann A, Kirstein J, Schleunitz M (2017) Science meets comics: Proceedings of the symposium on communicating and designing the future of food in the antropocene. Ch. A. Bachmann Verlag.
- Hajer MA, Westhoek H, Ingram J, Van Berkum S, Ozay L (2016) Food systems and natural resources. United Nations Environmental Programme, Nairobi, Kenya, 162.
- Clark MA, Springmann M, Hill J, Tilman D (2019) Multiple health and environmental impacts of foods. Proc Natl Acad Sci USA 116: 23357-23362.
[Crossref] [Google Scholar] [PubMed]
- Poore J, Nemecek T (2018) Reducing food’s environmental impacts through producers and consumers. Science 360: 987-992.
- Yoshida H, Gable JJ, Park JK (2012) Evaluation of organic waste diversion alternatives for greenhouse gas reduction. Resour Conserv Recycl 60: 1-9.
- Shams S, Sahu JN, Rahman SS, Ahsan A (2017) Sustainable waste management policy in Bangladesh for reduction of greenhouse gases. Sustain Cities Soc 33: 18-26.
- Mahmudul HM, Akbar D, Rasul MG, Narayanan R, Mofijur M (2022) Estimation of the sustainable production of gaseous biofuels, generation of electricity and reduction of greenhouse gas emissions using food waste in anaerobic digesters. Fuel 310: 122346.
- Chen TC, Lin CF (2008) Greenhouse gases emissions from waste management practices using life cycle Inventory model. J Hazard Mater 155: 23-31.
[Crossref] [Google Scholar] [PubMed]
Citation: Ahmed A, Caucci S, Lohmann D, Ezkul Z (2024) Assessments of Food Waste Practices for the Reductions of Greenhouse Gas Emissions in Selected Cities of Ethiopia. Environ Pollut Climate Change 8: 377.
Copyright: © 2024 Ahmed A, et al. This is an open-access article distributed under the terms of the Creative Commons Attribution License, which permits unrestricted use, distribution and reproduction in any medium, provided the original author and source are credited.
Select your language of interest to view the total content in your interested language
Share This Article
Recommended Journals
Open Access Journals
Article Usage
- Total views: 1950
- [From(publication date): 0-2024 - Oct 31, 2025]
- Breakdown by view type
- HTML page views: 1647
- PDF downloads: 303

