Research Article Open Access
Assessment of Water Quality Index (WQI) of Groundwater in Rajkot District, Gujarat, India
| Gopal Krishan*, Surjeet Singh, Kumar CP, Suman Gurjar and Ghosh NC | |
| National Institute of Hydrology, Roorkee, Uttarakhand, India | |
| *Corresponding Author : | Gopal Krishan National Institute of Hydrology Roorkee, Uttarakhand, India Tel no: +919634254939 E-mail: drgopal.krishan@gmail.com |
| Received February 26, 2016; Accepted March 18, 2016; Published March 22, 2016 | |
| Citation:Krishan G, Singh S, Kumar CP, Gurjar S, Ghosh NC (2016) Assessment of Water Quality Index (WQI) of Groundwater in Rajkot District, Gujarat, India. J Earth Sci Clim Change. 7: 341. doi:10.4172/2157-7617.1000341 | |
| Copyright: © 2016 Krishan G, et al. This is an open-access article distributed under the terms of the Creative Commons Attribution License, which permits unrestricted use, distribution, and reproduction in any medium, provided the original author and source are credited. | |
Visit for more related articles at Journal of Earth Science & Climatic Change
Abstract
Water quality index (WQI) of groundwater based on the data of 27 samples collected from Rajkot district, Gujarat was assessed using seven parameters viz. pH, Total Dissolved Solids, Total Hardness, Fluoride, Chloride, Sulphate and Nitrate. The WQI value 98 is maximum and the value 27 is minimum in the study area. The computed WQI shows that 51.8% of water sample fall in the ‘good’ to ‘excellent’ water category. On the other hand, 48.2% of water samples fall in the ‘fair’ to ‘poor’ category indicating that the water is not suitable for direct consumption and require treatment. After treatment, the water can be used for drinking purpose.
| Keywords |
| Water quality index; Groundwater; Rajkot; Gujarat |
| Introduction |
| Water, one of the most vital resources, is essential to sustain life. Based on the fundamental quality, water is used in different sectors viz. domestic, agriculture, power and industry. Therefore, one should have some basic information on quantity and quality of water resources for its proper usage and management. Continuous increase in water demands due to increasing population and developmental activities has resulted in more use of groundwater than the surface water resource which has led to groundwater depletion. Besides this, the groundwater quality is deteriorating due to disposal of massive industrial effluents and mining activities, as reported by various researchers in different parts of India [1-26]. For surface water the contamination transport and modeling has been reported by Parsai and Hagiabi [27,28]. Hence, groundwater quality monitoring has become imperative for maintaining its reliability for future use. |
| Water quality index is one of the most effective, simple and easily understandable tools to assess water quality for its suitability for various purposes [29]. In an attempt of developing water quality indices of groundwater in different areas, these indices have already been developed for Haridwar district in Uttarakhand [30] and Muzaffarnagar and Shamli districts of Uttar Pradesh [31]. Here, a further attempt has been made to develop the WQI of groundwater of Rajkot district in Gujarat, India. |
| It has been reported by Kumar and Parita that groundwater in Rajkot is not potable and the water related health problems are due to microbial and chemical contamination. Keeping in view the above finding, WQI of groundwater of Rajkot district, Gujarat has been computed in this study to test its suitability for drinking purpose. |
| Study Area |
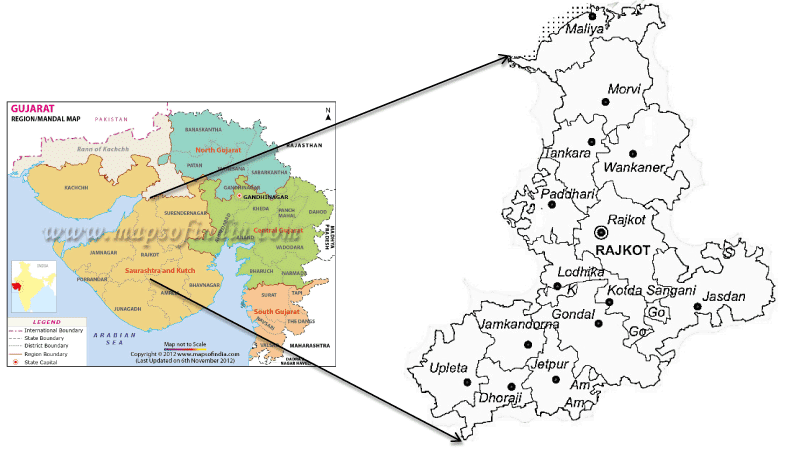
| Rajkot district falls in Saurashtra with a geographical area of 11203 km2 and lies between latitude 20°30’ and 23°12’ North and longitude 70°00’ and 71°45’ East [32]. Rajkot district comprises of 14 blocks, i.e., Rajkot, Kotada Sangani, Gondal, Jetpur, Dhoraji, Upleta, Jamkandorna, Lodhika, Paddhari, Morvi, Maliya, Wankaner, Jasdan and Tankara (Figure 1). The district has a semi-arid climate with normal rainfall of 550 mm. The major rivers flowing through the Rajkot district are Bhadar, Aji, Machhu, Demai and their tributaries. Some other small streams are Phulki, Jhinjhora and Ghodadroi. All these rivers, except the Bhadar, have very small catchments and are ephemeral in nature [32]. |
| The soils found in the district are mostly of Inceptisol and Entisol order and of Othids, Ochrepts, Orthents, Fluvents, Psamments and Aquepts suborder. Depth to groundwater level ranges from 0.78-22.45 m during pre-monsoon season and during post-monsoon, it ranges from 1.68-21.97 m. |
| Methodology |
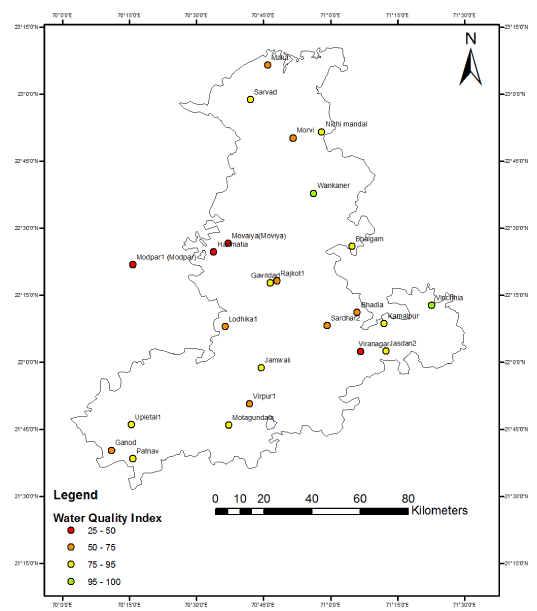
| AQUACHEM software was used to determine the geochemical evolution by evaluating all major cation and anion values. For computing the water quality index (WQI), the methods reported by Singh [5] have been employed in this work and the data of 27 samples (Figure 2) was taken from Dhiman [33] based on the data of CGWB, 2008 (http://gis2.nic.in/cgwb/Gemsdata.aspx) for the year 2008. In the present study, seven water quality parameters have been considered to compute WQI. These parameters include pH, Total Dissolved Solids, Total Hardness, Fluoride, Chloride, Sulphate and Nitrate. The water quality index was calculated using quality rating scale and accordingly assigning weight values to the selected parameters. The standards of the water quality parameter are governed as per BIS: 10500-2012 and central pollution control board (CPCB) standards and their respective weight used in the present work are highlighted in Table 1. |
| Overall WQI (OWQI) has been developed for surface water by Singh et al. [5] which can also be used for groundwater also [34]. |
| As reported by Singh et al. [5] and Krishan et al. [30,31] to gauge the influence of each individual parameter on a common single scale, the score generated by each parameter was averaged out. The following weighted average aggregation function has been employed for this purpose. |
| Where wi = weight of the ith water quality parameter and Yi = subindex value of the ith parameter (As reported by Singh et al. [5] subindices functions are basically the governing equations that transform the concentration ranges into the index score through mathematical equations. These scores are then further converted to a common scale based on their relative importance to impact the quality of water. These sub-indices function are developed based on the water quality standards and their concentrations to meet in particular range. For this purpose, mathematical expressions were fitted for each parameter to obtain the sub-index equations). |
| Based on the status of water quality data, the index value ranges from 0 to 100 and is classified into five categories: heavily polluted (0-24), poor (25-49), fair (50-74), good (75-94) and excellent (95- 100). The status of water corresponding to different WQI values is presented in Table 2. If the index is low, then it indicates that some of the water quality parameters are beyond permissible ranges due to some particular reason and suitable measures are needed to improve the quality of water. Thus this index may be used as a guiding rule in management of quality of water resources. Various sub-indices functions and descriptive details are given by Singh et al. [5] and Krishan et al. [30,31] and have not elaborated here. |
| Results and Discussion |
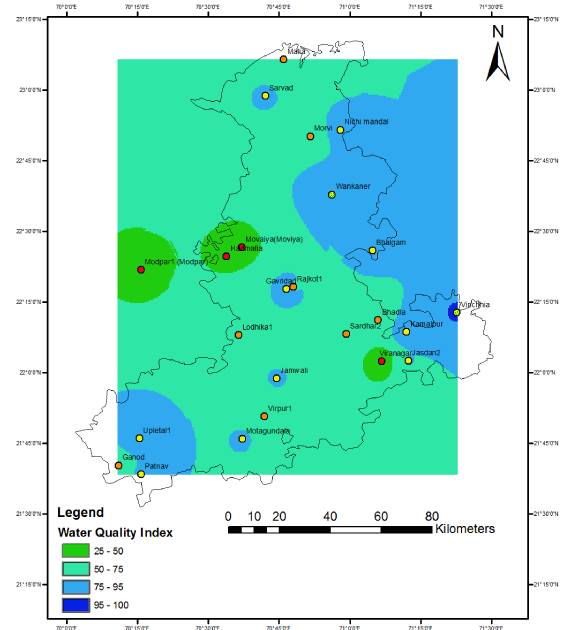
| The average value of physico-chemical parameters and WQI along with water type of 27 samples are given in Tables 3 and 4, respectively. The spatial distribution of water quality index is shown in Figure 3. |
| The groundwater samples were found to have Ca-Na-HCO3-Cl (2 nos.), Na-Mg-HCO3-Cl (2nos.), Na-Mg-Cl-HCO3 (2 nos.), Na-SO4- HCO3, Na-Ca-Mg-HCO3-Cl-SO4, Ca-Na-Mg-Cl-HCO3, Mg-Ca-Na-Cl- HCO3-SO4, Mg-Na-Ca-Cl, Mg-Ca-Na-HCO3-Cl, Na-Mg-Ca-HCO3-Cl, Na-HCO3-Cl, Na-Ca-Cl, Na-Ca-Mg-HCO3, Ca-Na-Mg-HCO3-Cl-SO4, Ca-Na-Cl-HCO3-SO4, Ca-Na-Cl-HCO3-SO4, Ca-Mg-Na-HCO3-Cl, Na-Ca-Mg-Cl, Na-Ca-Mg-HCO3-Cl, Ca-Mg-Na-Cl, Mg-Na-Ca-Cl- HCO3, Na-HCO3-Cl-SO4, Na-Cl-HCO3-SO4, Na-HCO3-Cl-SO4, Na- Mg-Cl types of hydro-chemical species. Majority of the groundwater samples exhibit that the alkalies significantly exceed the alkaline earths and weak acids exceed the strong acids. |
| The pH values ranged between 7.38-8.27 indicating samples was neutral to slightly alkaline. The TDS varied from 309-4858 mg/l. Very high TDS compared to standard limit of 600 mg/l may be due to high concentrations of chloride and nitrates. Fluoride concentration ranged from nil to 6.80 mg/l and the maximum concentration is very high as compared to standard limit 1.5 mg/l. Chloride concentration ranged from 57-2237 mg/l and the maximum concentration is very high as compared to standard limit 250 mg/l. Sulphate concentration ranged between 3-120 mg/l which were below the permissible limit of 200 mg/l. Nitrate concentration in groundwater samples ranged between 1-876 mg/l. High concentration of nitrate may be due to leaching from nitrogenous fertilizers, manures and may also be due to other anthropogenic origin. Total hardness ranged from 127 to 1582.40 mg/l and some samples have crossed the standard limit of 300 mg/l. |
| It is observed from the results that the maximum and minimum value of WQI has been found to be 98 and 27 delineated as per the Table 2 which fall under the ‘Excellent’ and ‘Poor’ category, respectively. In the present study it is observed that majority of the groundwater samples (44.4%) qualify in the ‘Good’ category and are acceptable for domestic use and 7.4% samples qualify in the ‘Excellent’ category which are of pristine quality; 33.4% samples qualify in the ‘Fair’ category which needs ‘Filtration and disinfection’ treatment and 14.8% samples qualify in the ‘Poor’ category which needs ‘Special treatment’. It may also be reflected that parameters particularly chloride, sulphate, nitrate and hardness are found to be higher compared to the permissible level resulting TDS value at higher order owing to anthropogenic contribution viz. agricultural and industrial activities in the Rajkot district. |
| It is evident from the Figure 3 that the water quality is good in northern and eastern parts of the study area, while the water quality needs treatment in the southern, south western and central part of the study area. |
| Conclusion |
| WQI has been computed based on seven different quality parameters to assess the suitability of groundwater for drinking purposes in Rajkot district, Gujarat. The computed WQI shows that 51.8% of water sample falls in the ‘good’ to ‘excellent’ water category. On the other hand 48.2% of water samples fall in the ‘fair’ to ‘poor’ category which indicates that the water is not suitable for direct consumption and requires treatment. After treatment, this water can be used for drinking purpose. Chloride, sulphate, nitrate and hardness are found to be higher compared to the permissible level resulting TDS value at higher order owing to anthropogenic contribution which might occur due to the agricultural and industrial activities in the Rajkot district. The continuous monitoring of groundwater is required in the district to protect water in future from any possible contamination due to growing industrialization and agricultural practices. |
| Acknowledgement |
| Authors thank Director, National Institute of Hydrology for all the support and encouragement. |
References
|
Tables and Figures at a glance
| Table 1 | Table 2 | Table 3 | Table 4 |
Figures at a glance
 |
 |
 |
| Figure 1 | Figure 2 | Figure 3 |
Relevant Topics
- Atmosphere
- Atmospheric Chemistry
- Atmospheric inversions
- Biosphere
- Chemical Oceanography
- Climate Modeling
- Crystallography
- Disaster Science
- Earth Science
- Ecology
- Environmental Degradation
- Gemology
- Geochemistry
- Geochronology
- Geomicrobiology
- Geomorphology
- Geosciences
- Geostatistics
- Glaciology
- Microplastic Pollution
- Mineralogy
- Soil Erosion and Land Degradation
Recommended Journals
Article Tools
Article Usage
- Total views: 20891
- [From(publication date):
March-2016 - Jul 13, 2025] - Breakdown by view type
- HTML page views : 18397
- PDF downloads : 2494
