Assessment of Reservoir Performance of a Well in South-Eastern Part of Bangladesh Using Type Curve Analysis
Received: 10-Nov-2018 / Accepted Date: 28-Dec-2018 / Published Date: 04-Jan-2019 DOI: 10.4172/2472-0518.1000159
Abstract
Natural gas is one of the most significant asset for a nation. It is very noteworthy for a country to analyze the characteristics and other parameters of a gas reservoir for the better maintenance. There are different types of methods to carry out these tasks and typecurve analysis is one of them. This is an essential method for sustaining controlled production, properties characterization and finding most capable production procedure. Expected ultimate recovery (EUR), permeability, skin factor, drainage area, volume, original gas in place based on production rate and pressure can be evaluated by different types of analysis such as Fetkovich analysis, Blasigimme analysis, AgarwalGardner Type curve analysis, flowing Material Balance and NPI type curve. Here an investigation has been directed to estimate gas initial in place (GIIP) and more specified parameters of the wells of a gas field in Bangladesh locating at the south-eastern part of the country. This field is contributed through five (5) wells. In this study, we gathered pressure and production rate information for Well #04 that were acknowledged throughout periodic Shut-in. typecurve analysis has been calculated to understand different reservoir characteristics and forecast for future production. The result that was instigated through this research is considered among the greatest satisfactory than any other reserve estimation method because the data is imperiled to real field.
Keywords: Expected ultimate recovery; Permeability; Skin; Rate transient analysis
Introduction
The study on production performance evaluation of oil and gas wells are one of the most important tasks in reservoir engineering. However, at present production data investigation usually improves an proper analysis mathematical model built on the oil and gas transient flow theory, and it is used to recapitulate performance of well production data, including perdurability, bottom flow pressure, production and cumulative production, to calculate the reservoir properties and forecast future performance [1]. Various methods have been established for calculating the estimation of reserves as well as other parameters. These methods have a variety from the material balance methods to decline-type curve analysis. They are based on analytical and graphical solutions with varying limitations, known as type curves. For instances, Fetkovich type curve, Agarwal Gardner type curve, NPI type curve etc. [2]. Throughout the last 30 years typecurve analysis methods have become widespread to analyse pressure transient test. Rate transient test is one of the most progressive and broadly recognized system of assessing EUR, permeability, skin etc. with only using the production and flow data. The most key benefit of using these methods is that it uses the data that we already have and most importantly we can do the analysis with low cost.
Gas Field Overview
Bangladesh has engaged the significant part of the Bengal basin that included west Bengal in the west Tripura in the east which is the consequence of crashing between the Indian plate and the Asian plate. The geosynclinals Basin in the southeast of Bangladesh include the territory of Comilla and Brahmanbaria. The gas field is situated in the latitude and longitude of 23.7114909N and 90.9840167E respectively, located in the eastern part of Bangladesh. Here, we have utilized information from 5th October, 2006 to 30th January, 2018 for #Well 05 that are equipped with Emergency Shutdown System.
Materials and Methods
Data collection and treatment
Production data, PVT properties, bottom hole and flowing pressure data were collected and sorted. FEKETE “RTA” software has been used for this analysis. Production data inputted into FEKETE “RTA” and appeared to be much dispersed. Then the data was filtered to diminish fault and to find a good match of type curves. After filtering, some of the points have vanished and the trend of the early time data is less scattered. Finally all the necessary data were entered into FEKETE “RTA” to perform the analysis
Analysis methods
Blasingame, Agarwal-Gardner, Fetkovich analysis, flowing material balance and normalized pressure integral (NPI) typecurve analysis have been carried out for this study.
Methodology
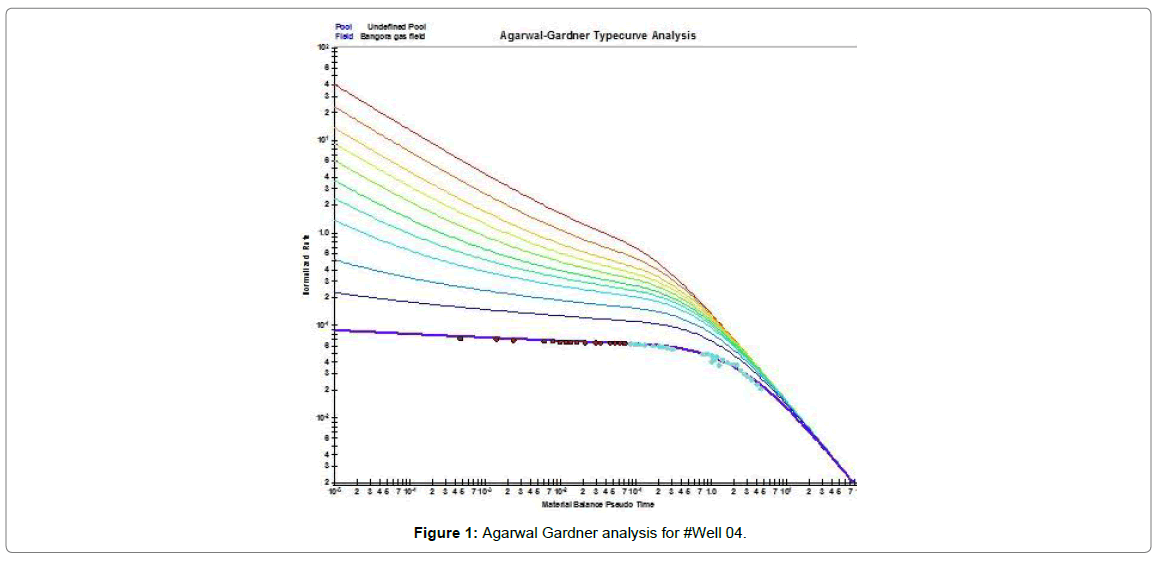
Fetkovich documented that decline curve analysis that only applicable through the reduction period, when production reaches in boundary-dominated flow. Fetkovich established the typecurves that extended the Arps type curves into the transient flow region [3,4]. Agarwal and Gardner have compiled and presented decline type curves for analysing production data with dimensionless variables based on the conventional welltest definitions. They also include primary and semi-log pressure derivative plots [2]. The expansion by Blasingame et al. was to comprise changing the wellbore flowing pressures by defining a superposition time function. Blasingame, McCray, and Palacio developed type curves which show the analytical transient . here, normalized rate, rate integral, and rate integral derivative are plotted vs. material balance time [5]. In order to obtain a traditional material balance plot, the well should be shut-in at several points to gain the average reservoir pressure. However, this is not always possible and that’s why the flowing material balance uses the concept of boundary-dominated flow or pseudo-steady state flow, as well as flowing pressures and rates to calculate original hydrocarbons-inplace [6,7]. In Normalized Pressure Integral(NPI) analysis normalized pressure, pressure integral, and pressure integral derivative are plotted vs. material-balance time. All are plotted on a log-log scale that called as the “data plot” (Table 1). While the axes of the two plots were kept parallel, the data plot could be moved over the type curve plot, until a good match was obtained [6,8]. Then best fits the data, is selected. The other properties can be directly calculated from the analysis (Figure 1).
Discussion
Agarwal gardner analysis
The study results the EUR 258.16 Bscf and OGIP 320.08 Bscf. More than half of the points are in blue which indicates the well has almost reached its boundary condition (Figure 2).
Blasingamme analysis
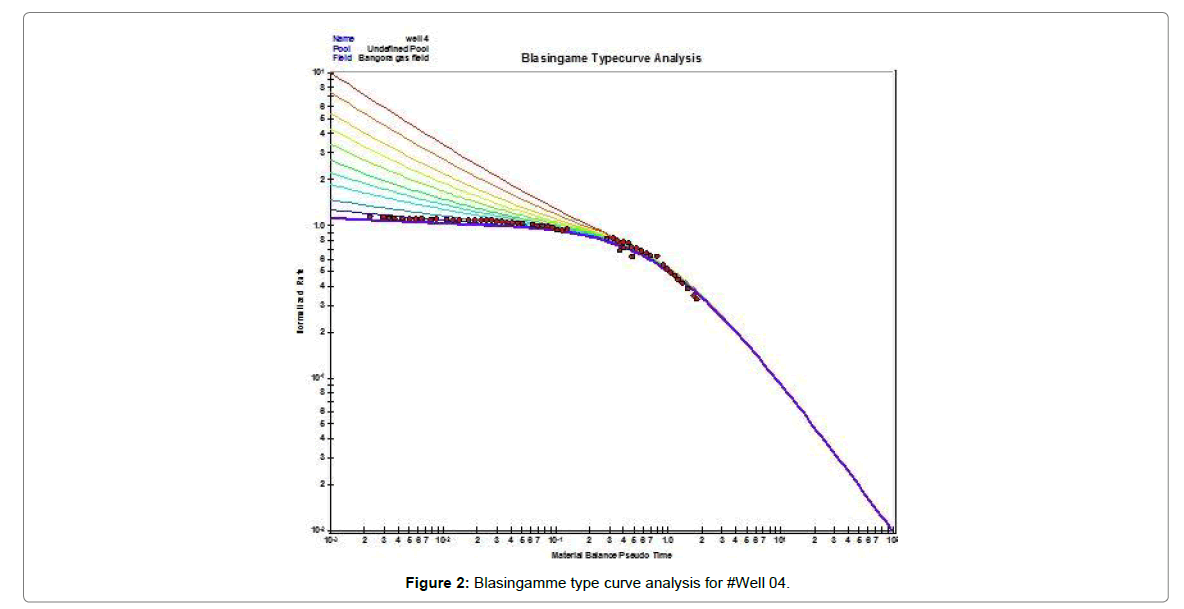
We find EUR 299.42 Bscf, OGIP 374.33 Bscf, Permeability 3.1 md. The calculated points have good overlap with the reference type curve and many of data points are located in boundary region.
Fetkovich analysis
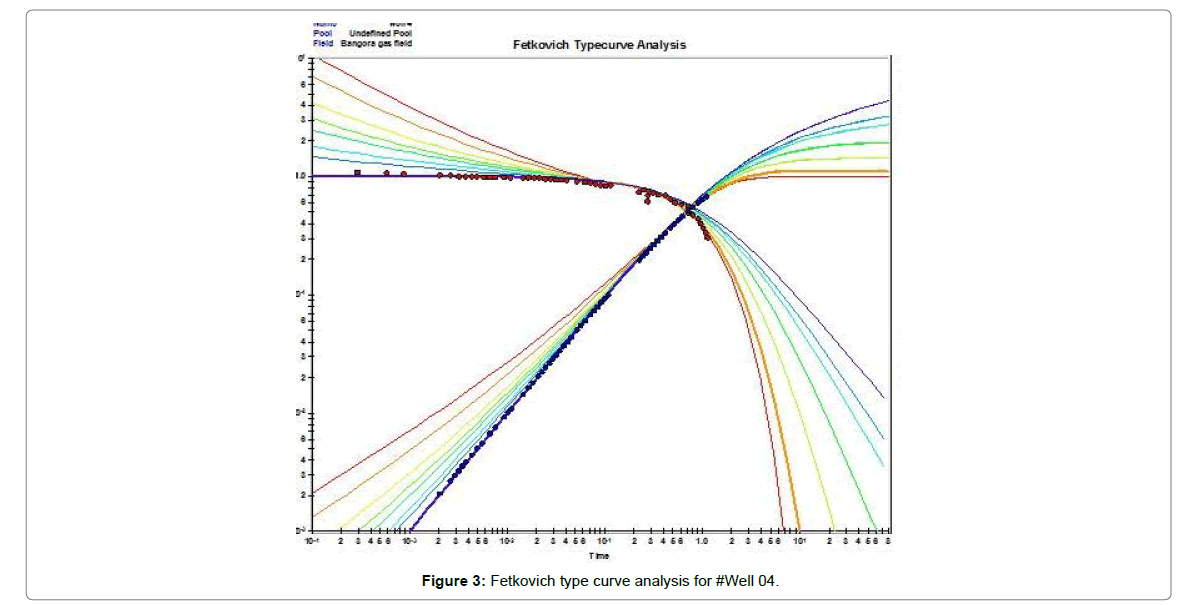
The expected ultimate recovery is 258.16 Bscf and the permeability is 3.1 md. The data points are very close its boundary region (Figure 3).
Flowing material balance
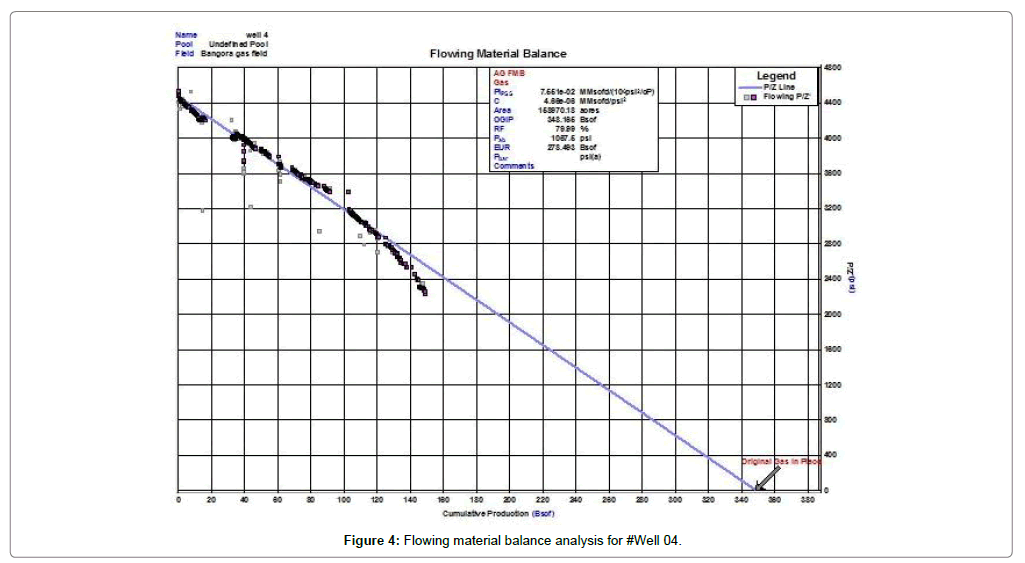
This gives us 278.49 EUR Bscf, OGIP 348.17 Bscf. This analysis is more reliable because the calculated data points are in linear plot (Figure 4).
NPI type curve analysis
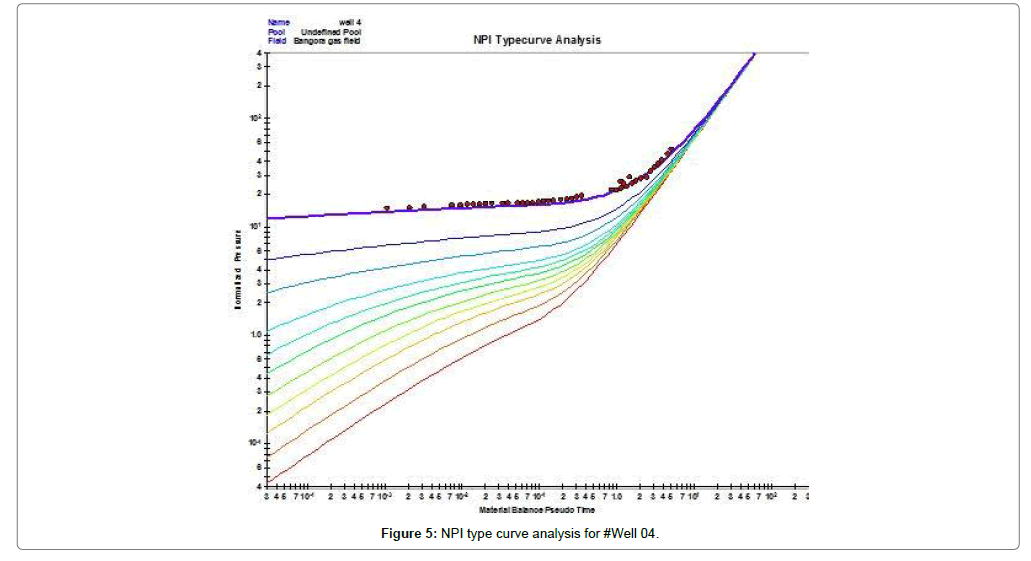
This method gives EUR 279.59 Bscf, OGIP 349.54 Bscf and the permeability is 3.6 md. The calculated points has almost matched with the corresponding curve and many of the data points are close to boundary region.
The skin is positive that indicates flow development is not available in near wellbore area. Moreover, the reservoir may be fractured. These did not reach their decline condition precisely. For this reason, it did not reach their boundary condition and the calculated points may not match correctly with the reference type curve (Figure 5).
Conclusion
Reservoir performance evaluation is exceptionally pivotal for a reservoir to decide anything. Calculation and evaluation gives the certainty about practical possibility to deliver from a reserve; regardless of whether it is economically viable or not. In this paper a couple of type curve methods are talked about. Other strategies like relationship, reservoir simulation are additionally used to evaluate the reservoir. It ought to be noticed that the aggregate of reserves may fluctuate concerning time due to gathering or movement of gas. So reservoir evaluation ought to be done in a customary premise to have clear thought on current situation.
References
- Wang X, Hu Y, Yiping D (2010) A model of production data analysis for horizontal wells. Petrol Explor Dev 37: 99-103.
- Agarwal RG et al. (1998) Analyzing well production data using combined type curve and decline curve analysis concepts. SPE Annual Technical Conference and Exhibition. Soc Petrol Eng.
- Fetkovich MJ (1980) Decline curve analysis using type curves. J Petrol Technol 32: 1-65.
- Fetkovich MJ, Fetkovich EJ, Fetkovich MD (1996) Useful concepts for decline curve forecasting, reserve estimation, and analysis. SPE Reservoir Eng 11: 13-22.
- Blasingame TA, McCray TL, Lee WJ (1991) Decline curve analysis for variable pressure drop/variable flowrate systems. SPE Gas Technology Symposium. Soc Petrol Eng.
- Hussain I, ATM Muzemder SH, Mahmud H (2016) Dynamic Material Balance Study of Gas Reservoir Using Production Data: A Case Study of New Gas Sand of Kailashtila Gas Field. Inter J Oil, Gas and Coal Eng.
- Khan MI, Hossain MS (2014) Reserve Estimation of Rashidpur Gas Field Using Typecurve Analysis. International J Innov Appl Stu 7: 1650-1658.
Citation: Bhowmick D, Islam T, Jogesh KS (2019) Assessment of Reservoir Performance of a Well in South-Eastern Part of Bangladesh Using Type Curve Analysis. Oil Gas Res 4: 159. DOI: 10.4172/2472-0518.1000159
Copyright: © 2019 Bhowmick D, et al. This is an open-access article distributed under the terms of the Creative Commons Attribution License, which permits unrestricted use, distribution, and reproduction in any medium, provided the original author and source are credited.
Share This Article
Recommended Journals
Open Access Journals
Article Tools
Article Usage
- Total views: 4466
- [From(publication date): 0-2018 - Feb 21, 2025]
- Breakdown by view type
- HTML page views: 3581
- PDF downloads: 885

