Assessment of Post-Harvest Fish Losses in Lake Ziway, Ethiopia
Received: 29-Oct-2021 / Accepted Date: 18-Nov-2021 / Published Date: 25-Nov-2021
Abstract
Fish is an extremely perishable food product which requires proper handling soon after harvest. This study was conducted from June 2020 to December 2020 to determine the kinds, extent of fish Post-Harvest Losses (PHL) and to propose the intervention required to prevent fish post-harvest losses in Lake Ziway. To this end, Informal Fish Loss Assessment Method (IFLAM), Load Tracking (LT) and the Questionnaire Loss Assessment Method (QLAM) were used to assess the causes and to estimate the extent of Post-harvest fish losses. Simple random sampling was used to select 201 fishermen, 43 fish processors, 28 fish sellers and 15 hotel owners while questionnaires were administered. Post-harvest fish loss from 2010 to 2020 was estimated to be 643 tones from the total 20,273 tons produced. The types of losses that were identified in the study area included quality losses (57% or 366.51 tones), physical losses (35% or 225.05 tones), and market force losses (8% or 51.44 tones). The leading causes of postharvest fish losses in the study area included harvesting immature fish (36.24%), high environmental temperatures (29.97%), infrastructures problems (18.12%), absence (delayed) marketing (9.756%) and increasing number of boats (5.923%). The loss of resources regarding money was found to be 160,750,000 Ethiopian Birr (ETB) which is equivalent to 4,230,263 United States Dollar (USD) on this study area. From this study result, giving extension services, capacity building, maintaining fish as cold as possible, giving training, allowing recommended fishing net, controlling illegal fishing and fish trading are recommended to decrease the problem of post-harvest fish losses in Lake Ziway according to the information obtained from participants of the research.
Keywords
Lake Ziway; Market force loss; Physical loss; Post-harvest fish loss; Quality loss
Introduction
Fish is one of the most important food staples on the planet. Its flesh is a source of top quality protein, and for many in the less developed parts of the world it represents a significant proportion of the animal protein in their diet, either as fresh fish or cured in a variety of ways, such as smoking, salting and drying. Unfortunately, however, fish is one of the most perishable of all staple commodities, and in the tropical climates of most developing countries it will become unfit for human consumption within about one day of capture, unless it is subjected to some form of processing. Even after the fish has been processed, particularly if traditional methods have been used, the fish is still subject to many forms of loss and spoilage [1].
Post-harvest fish lose is the discard of fish after harvest and causes the loss of potential income. It is because of poor processing techniques, animal predation and insect infestation, inadequate packaging and storage and discarding of the fish at Lake. Many factors affect this loss. Among these factors are: long transport, lack of preservation, high ambient temperature, species of fish, lack of market and long storage time. These factors determine the occurrence of many types of Postharvest fish loses. These lose are classified as; lose in nutritional value, physical loss, quality loses, market force lose, lose due to traditional processing, lose during distribution and storage, and lose due to insect infestation [2].
Post-harvest fish losses can be defined as nutrient or economic losses render the commodity unavailable or nutritionally deficient for human utilization [2]. Post-harvest losses of fish are of various types. The most obvious are the losses of material, or physical losses, caused by, for example, poor handling and processing, or the discarding of bycatch. There are also economic losses which occur when spoilage of wet fish causes a reduction in its value or when there is a need to reprocess cured fish, increasing the cost to the processor [1].
Post-harvest fish losses can be defined as nutrient or economic losses render the commodity unavailable or nutritionally deficient for human utilization [2]. Post-harvest losses of fish are of various types. The most obvious are the losses of material, or physical losses, caused by, for example, poor handling and processing, or the discarding of bycatch. There are also economic losses which occur when spoilage of wet fish causes a reduction in its value or when there is a need to reprocess cured fish, increasing the cost to the processor [1]. Cheke and Ward 1998 [3] explained a more pragmatic classification of fish loss into four common categories: physical loss, quality loss, nutritional loss and market force loss. As one of the most limiting constraints of the fisheries sector, PHL indicates a fish that is either discarded or sold at a lower price due to many factors. PHL require a great concern because it is a loss of an essential animal protein that should be consumed or sold in a fair price. It causes a massive economic loss to fishermen and traders globally [4]. The most frequent types of PHL are physical loss, quality loss, nutritional and market force loss [5, 4]. Among many reasons, high environmental temperature, extended storage without preservatives, predators, insect infestation, increased production and lack of market are the main causes of PHL [6].
The main causes of post-harvest fish losses are collecting centers are far from the fishing grounds, shortage in ice, high temperature, the use of illegal fishing gear and nets, lack suitable infrastructure in both fishing grounds and at the landing sites for immediate processing operations, lack satisfactory processing methods, lack transportation due to insufficient maintenance of lorries, lack good road network systems to be able to deliver catches in good time to the markets, absence of modern packaging materials and very often, inadequate storage facilities at landing sites [7]. Fish is one of the most quality protein sources of animal origin. The high moisture contents of fish render it extremely perishable, it has been estimated that in the ambient temperature of the tropics, fish spoils within 12-20 hours of being caught depending on species and size.
Post-harvest fish losses are of great concern because it is a loss of valuable animal protein and lost income for fishers, processors, traders and for a country as a whole. In addition to money being wasted, discarded fish has a negative impact on our environment as it contributes problems in different perspectives. Reducing fish losses is therefore an important development goal in the fisheries sector. Very little is known about fish losses in Ziway lake fishery distribution chain by Policy-makers, Fishers, Traders and vending community. The aim of this study was to assess the kinds and level of post-harvest fish losses of Lake Ziway and to estimate monetary value of fish post-harvest fish loss.
Materials and Methods
Description of the study area
Lake Ziway (also known as Zway, Zwai, Zeway and Zuai in the literature; belongs to the Central Ethiopian Rift. It is the third largest lake in the Ethiopian part of the Rift Valley and fourth in the country in terms of surface area. It lies in a shallow down-faulted basin [8] flanked in the east by a large basalt field with sandy or rocky shores [9]. The Lake is bordered and hence controlled by two administrative zones of Oromia regional state i.e, the western part belongs to East Showa zone while the Eastern part belongs to Arsi zone. At the western shore two districts are bordering the lake, Dugda districts with Meki as capital and Adami-Tullu-Jiddo-Konbolcha Distict, Ziway/Batu as capital. The Eastern shore belongs to Ziway Dugda District, Habura (Ogolcho) as the capital. Lake Ziway is the most economically and socially utilized lake for fishery, recreation, irrigation, tourism and for livestock drinking. Lake Ziway is the most northerly rift valley lakes of Ethiopia. It is located to 7°52’ to 8°8’ N latitude and 38°40’ to 38°56’ E longitude. The lake is located at about 160 km due South of Addis Ababa, on the left side of Addis-Awassa Highway. The altitude of Lake Ziway is 1636 meter above sea level. It is the shallowest of the rift valley lakes with maximum and mean depth of 8.95 m and 2.5 m respectively. The lake has an open water area of 434 km2 and shore line length of 137 km. It has a maximum length of 32 km and maximum width of 20 km (LFDP, 1997). The lake contains five main islands (Tullu-Guddo (4.8 km2), Tsedecha (2.1 km2), Debresina (0.3 km2), Funduro (0.4 km2) and Gelila (0.2 km2). The lake is fed by two major rivers i.e. Meki from north-west and Katar from east, and has one outflow in the south, the Bulbula River which flows into lake Abiyata. There are seven indigenous fish species in the lake comprising Barbuspaludinosus, Garradembecha, G. makiensis, Labeobarbusethiopicus, L. intermedius, L. microterolepis and Oreochromis niloticus [10]. Of these, L. ethiopicus, G. makiensis and L. microterolepis were reported as endemic to the lake [10]. The lake also harbors five exotic fish species (Tilapia zillii, Cyprinus carpio, Carassius Carassius and Carassius auratus) which were introduced to enhance its production, and Clariasgariepinus that slipped into the lake accidentally [10] (Figure 1).

Figure 1: Map of lake ziway.
Sampling techniques and sample size
A simple random sampling approach was implemented from June 2020 to December 2020 to select 201 fishermen, 43 fish processors, 28 fish sellers and 15 hotel owners. The sample size for the post-harvest loss interview process was estimated.
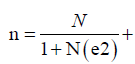
where, n is number of respondents drawn from total population; N is the target population size and e is the level of precision. For selection of informants from each stakeholder, a proportional allocation formula was used and calculated as: sample size = total population 1+ total population (0.05)2 = 1021 1 + 102 (0.05)2 = 287 Based on the above formula, 287 sample size was used for responding questioner, interview and other required information of all fish post-harvest losses of the lake.
Data collection method
Post-harvest loss assessment was carried out using qualitative and quantitative field assessment methods. Informal Fish Loss Assessment Method (IFLAM), Load Tracking (LT) and the Questionnaire Loss Assessment Method (QLAM) are methods adapted from FAO were used to assess the causes and to estimate the amount of PHL of fish [4].
Data analysis
The collected data were analyzed using the Statistical Package for Social Sciences (SPSS) Computer software program and Post-harvest loss assessment methods. The questionnaire was coded and run to SPSS20. Chi-square test was used to see whether there is a significant association of the knowledge of respondents about the problem of postharvest fish losses. The significance was determined at p-value less than 0.05. Descriptive statistic such as percentages, frequency, tables, figures and graphs were applied to organize, analyze and interpret the study.
Results and Discussions
Demographic characteristics of participants selected for the interview
The educational status of participants were illiterate (6%), primary education attended (65%), secondary school (26%) and diploma completed (3%). The educational careers of fishermen were limited to only primary education due to low income earned from fishing activities. This scenario has resulted in low technical knowledge of the fishers in post-harvest handling, managing, processing and storing of fishes which in turn caused post-harvest losses. The maximum annual income from fishing activities per individual is 75,000 ETB whereas the minimum annual income per individual is 7,000 ETB (Table 1).
| Variables | Mean ± Std dev | Minimum | Maximum |
|---|---|---|---|
| Age | 29.9 ± 5.9 | 20 | 50 |
| Fishing experience | 13.6 ± 6.032 | 3 | 32 |
| Family size | 5.5 ± 2.234 | 2 | 11 |
| Annual income from fisheries | 16153 ± 7956 | 7,000 | 75,000 |
Table 1: Demographic characteristics of participants in Lake Ziway fish postharvest loss study (Mean ± Std dev.).
Findings of this study show that causes of PHL were harvesting immature fish (36.24%), high environmental temperatures (29.97%), infrastructures problems (18.12%), absence (delayed) marketing (9.756%) and increasing number of boats (5.923%) as fishers and other stakeholders shown from their information gained from them by questionnaire and interview, but according to [6] causes of PHL (high environmental temperature, harvesting immature fish, the presence of predators, loss of fish in the Lake with the net, high flooding, and delay before marketing), from this what can be understood is even though there is a relation of some causes of fish losses but there is degree of impact difference on fish losses and the others for example the presence of predators, high flooding are not considered as a great problem in Ziway lake. The main reason for discarding immature fish is that there was no market for small size fish. In particular, tilapia and carp, which weigh less than 150 g and 250 g, respectively, were thrown away in the landing site for dogs or fish-eating birds (Table 2).
| No. | Variables | Mean ± Std dev | Minimum | Maximum |
|---|---|---|---|---|
| 1 | Distance to market (km) | 2 ± 1.8 | 1 | 19 |
| 2 | Number of gill nets owned | 6 ± 3.3 | 0 | 20 |
| 3 | Number of longlines owned | 35 ± 7 | 0 | 1000 |
| 4 | Number of beach seines owned | 1.47 ± 1.31 | 0 | 6 |
| 5 | wait time spent before marketing | 3.4 ± 1.2 | 1 | 6 |
| 6 | Fishing days in a week | 5.8 ± 0.8 | 3 | 7 |
| 7 | Maximum catch/person/day | 34 ± 19 | 5 | 105 |
| 8 | Minimum catch/person/day | 5 ± 2 | 1 | 9 |
| 9 | Daily loss incurred in kg | 2.47 ± 2 | 1 | 6 |
Table 2: Fishing activity variables of fishers generated by questionnaire.
Study conducted on qualitative and quantitative fisheries value chain and assessment of the economic impacts of post-harvest fisheries losses in four Malawian lakes: Malawi, Malombe, Chilwa and Chiuta have indicated similar factors cause for post-harvest losses. As similar to other most other developing countries, PHFL is caused by poor handling practices (e.g. washing fish in unclean water), processing methods that expose fish to contaminants and for long periods (e.g. sundrying), exposure to high temperatures, lack of storage facilities, poor transportation, and vermin. These practices produce bacterial spoilage, which in turn creates toxins that can cause food poisoning. Spoiled fish also lose nutritional value. For example, a study from Ethiopia, found that post-harvest fish processing practices created microbial growth, which in turn contributed to reducing protein content from 86.32% to 63.25% [11] (Figure 2).

Figure 2: Fish post-harvest loss in terms of seasons.
Studies conducted in Hashengie lake indicated that, there is higher post harvest fish losses were measured between March and May for both species. The main reasons for post harvest losses include inadequate handling, poor processing and storing facilities, delay between catch, collection and distribution, lack of proper market channel and lack of appropriate fish handling and preserving techniques [12].
Causes and extent of Post-harvest loss associated with fisheries
The causes of physical and quality fish loss happen during fishing, processing, transportation, storage, and marketing. During fishing, fish rot in boat keel without ice and over long periods of fishing, Fish exposed to high ambient temperatures in the boat for many hours without ice squashing, Fish stored in the boat are invariably squashed due to lack of proper storage containers and handling on board. During processing, poor processing methods and facilities contributed to massive fish loss. During transportation, fish over packed and/or poorly packed in bags and cartons, Unreliable transportation resulting in delays and quality losses and Poor road infrastructure leads to delays in transportation of fish products to markets in wet seasons. During marketing, poor market infrastructure and multiple handling contributes to fish loss.
On landing sites the fish are gutted and processed on the ground without any shelter or protection. At no stage in this chain of processing the fish is protected from direct sun, dust and wind. There is no proper fish handling and preserving facilities both on boat and landing sites. Long fishing hours, as well as, extended period between capture and arrival at landing sites causes spoilage of fish in Lake Ziway. Fishers usually got to fishing grounds in the morning to set their gears and return the next day or the following morning to collect their catch (24 up to 48 hours fishing time).
Fishermen of the area believed that harvesting immature fish (36.24%), high environmental temperatures (29.97%), infrastructures problems (18.12%), absence (delayed) marketing (9.756%) , and increasing number of boats (5.923%) are the main reasons of postharvest fish losses in Ziway lake as shown on the below and also Lake’s 80% of fishermen agreed harvested fish delay in store (lack of market) especially this year due to COVID-19 and problem of security in the region, 76% Infrastructure problems, 65% Increasing number of boats, 64% Long hours of setting gear before hauling and 54% Fishers from distant fishing grounds land large quantities of spoiled fish causing high post-harvest losses in this lake (Table 3). This is due to lack of services for ensuring fish quality, such as hygienic landing centers, electric power supply, potable water, roads, ice, ice plants, cold rooms, refrigerated transport and appropriate processing and storage facilities. This shortcoming, especially when associated with rift valley temperatures, can result in high post-harvest losses, as fish can spoil in the boat, at landing, during storage or processing, on the way to market and while waiting sale in this area (Table 4).
| Name of fish species | Initial weight (kg) | Final weight (kg) | Loss (kg) |
|---|---|---|---|
| Tilapia (Oreochromis niloticus) | 141 | 101.24 | 39.76 |
| Common carp (Cyprinus carpio) | 96 | 71.9 | 24.1 |
| Catfish (Clarias gariepinus) | 155 | 62 | 93 |
| Crucian carp (Carassius auratus) | 137 | 102.75 | 34.25 |
| Total | 529 | 337.89 | 191.11 |
Table 4: Post-harvest loss estimation by load tracking.
The initial weight has been taken from fishers at landing sites and the final weight was taken from their processing area either at the processing shades of the cooperatives or at their fish retailing shades of some privates of different fishers, processors and traders of the participants. From this load tracking PHFL estimation based on initial weight of 529 kg collected in the morning time repeatedly before filleting fishes with a good support of participants and also final weight was collected after filleting which was 337.89 kg so, by subtracting final weight from initial weight 191.11 kg was obtained. This tells us PHFL by load tracking estimation is a big loss because, 36% of a collected fish is a reject parts of fish (fins, heads, bones and guts) which is by most of fishers or processors or traders it is lost completely, but some of them using very recently for consumption in soup form for their family or for selling in the hotels or restaurants and also, in other words using in-consumable part of fish for feed as a fish meal is not common in this area (Figure 3).
| Variables | SA | A | NAND | D | SD |
|---|---|---|---|---|---|
| Long hours of setting gear before hauling causes high post-harvest quality loss | 11.5 | 64.1 | 13.9 | 10.5 | 0 |
| Fishers from distant fishing grounds land large quantities of spoiled fish | 22.6 | 54.4 | 16.7 | 5.2 | 1 |
| High post-harvest fish loss occurs during the rainy season | 3.5 | 46.3 | 28.6 | 21.6 | 0 |
| High post-harvest fish loss occurs due to Infrastructure problems | 20.6 | 76.3 | 2.4 | 0.7 | 0 |
| Harvested fish delay in store (lack of market) is the main reason for post-harvest fish loss | 20.9 | 77.7 | 0.7 | 0.7 | 0 |
| Increasing number of boats causing high post-harvest loss from time to time | 5.2 | 64.8 | 20.6 | 9.4 | 0 |
| SA-Strongly Agree, A-Agree, NAND-Neither Agree nor Disagree, D-Disagree, SD-Strongly Disagree | |||||
Table 3: Causes of post-harvest loss based on likert scale in percentage.

Figure 3: Types and extent of post-harvest fish loss.
The main causes for post-harvest fish losses of Lake Ziway were harvesting immature fish, high environmental temperatures, infrastructures problems, absence (delayed) marketing and increasing number of boats. The detail explanation of these causes can be of inadequate handling, processing and storing facilities, delay between catch, collection and distribution, lack of proper fish market channels, absence of regulations governing quality and standards of fish to be sold for human consumption, poor extension services and lack of knowledge on proper fish preservation techniques and generally from this study the result of analysis told us from the three categories of PHFL were physical loss 57%, quality loss 35% and market force loss shown us 8%. From total loss per fisherman in this particular Lake was found to be 6300 ETB per year (equivalent to 166 USD/year/individual) and from secondary data collected 160,750,000 ETB which is equivalent to 4,230,263 USD was estimated from fish lost in the past ten years after production from this lake and also by load tracking estimation from 529 kg of initial weight of fishes about 191.7 kg PHFL was obtained from different fish processors of the area and other stakeholders.
Fish physical losses
Physical losses in this area are considered as a reason of great loss (57%) because of many factors such as harvesting immature fish, poor handling and packaging, eaten by insects, birds and animal predators and theft according to information obtained through questionnaires and interview from participants. Assessment of post-harvest losses studies revealed that fish losses of about 10 to 12 million tonnes per year are caused by spoilage while estimate shows that 20 million tonnes of fish are discarded at sea yearly [7,13]. Studies showed that preservative methods like sun-drying, salting, and smoking are known to reduce PHL in developing countries [14], but these methods are not used or common in this area due to this PHL is observed is high. Regarding species, mostly harvested as claimed by fishermen, they may incur a higher loss in tilapia (Oreochromis niloticus) and Labeobarbus spp than other species. The reason for higher loss in Tilapia (Oreochromis niloticus) can be its abundance in the Lake than any other species which may increase the amount of loss relatively than other scarce species, therefore the amount of PHL was found to be higher in this area. The high environmental temperature was noticed in Ziway during the study period. As the temperature reaches more than 35°C (midday), many of the fishers reach the landing site from sites where they set nets. By that time, their product could have been lost due to mid-day high temperature and the distance traveled to reach the landing site (market). With this problem many of the fishers and a fishery association do not possess a required refrigerator or they have two or fewer refrigerators and also many of them do not behave with practicing fish preservation methods such as drying or salting or others, therefore high temperature affects fish products most of the time at this area, due to this there was high loss of post-harvest fish losses observed in this area. According to study conducted in 2004 and 2005 on postharvest fish losses assessment at lake Zeway, the total tilapia losses constitutes 15.17% of which 71.2% discarded due to size preference and 28.8% discarded due to spoilage [15]. The difference in 38 result may be due to the differences in methodologies used and the time gap between the studies e, i with the current study in Ziway lake. But the study conducted in the past 15 years shows that there was discarding of harvested fishes due to immature fish high that was of total loss of tilapia 71% was due size preference which support the current result obtained by this study.
Quality loss
Quality of fish and safety is the major concern of consumers which can be achieved through adequate hygienic practices among fishermen and fish processors. Also, Olusegun and Matthew (2016) revealed that reduction of fishing time to a minimum of 12 hours will help the fish caught to remain in good condition. In addition, good handling practices of fish on board by washing, gutting and storing in clean containers will help to reduce quality loss. Quality losses on this study area caused by load damage, lack of preservation, due to poor transportation and lack of inadequate market information. Fish quality losses began at fishing time because a fish caught spends in the net beyond required, and also at the landing site all fish species collected together and stored till separation and during transportation there is no any cooling box used up to distribution all these problems were seen during field observation. Therefore, fish quality loss was the other causes of PHFL on this lake which was resulted from analysis around 35%. The present study is less than the finding from lake Hashengie in both of the fish species which are; total tilapia catch in 2009/2010 8.34% was the post-harvest fish losses of which 19% was 40 discriminated due to size preferences and 81% was discarded due to spoilage while from the total carp species catch the post-harvest losses constitutes 15.4% of which 39% was discarded due to size discrimination and 61% was discriminated for spoilage [15]. The low result fish spoilage may be due to improvement in electricity and other facilities of the area the lake Ziway when compared to current conditions the area in terms of infrastructure. The high fish loss at the landing sites can be attributed bad handling by the fishermen as there was no gutting, washing and clean storage either on board or at landing. Fish being taken out from fishing gears are sometimes badly handled and most of the times left in the open at the canoe bottoms under the dominant high temperatures. Quick spoilage especially through bacterial decomposition under the warm conditions sets in. Also, some of the fish having spent many hours in the net before hauling could be dead in the water and have begun to spoil.
Market force losses
Market force losses are caused due to imbalance between demand and supply which leads to fish price changes. Absence (delayed) marketing was the other cause of post-harvest fish losses which was about 10% resulted from analysis, especially market force loss works with individual fishermen and fishery association of study area than traders and processors. Due to occurrence of Corona Virus Diseases-19 in 2020, consumers afraid to buy raw fish as a result of multiple handling of fish. Hence, fish price declined, which caused a fish produced to be lost with a massive amount which was about 117 Quintal or 11.7 tons were lost within a short period of time due to lack of electricity and lack fish consumers. Therefore, many of fishery associations, privates and restaurants were affected a lot at that time and forced to discard caught and stored fish in study area.
Monitory value of PHF losses
The other studied parameter on PHL was the monetary value of fish lost by fishermen. It was calculated from the amount of fish loss incurred by fishermen on a daily basis. Interview from participants generated the amount of loss of fish in kilograms. As indicated in Table 2, at Lake Ziway, a fisherman works for three days in a week on average and incur 2.47 kg loss of fish per day. Legal fishing season (a legal fishing season is a time when fishers are allowed to fish in which the fish may not breed (from October to April) (7 months)). Even-though breeding season of fishing is prohibited by law in the lake but fishers are using the lake for fishing illegally. Therefore, these productive months used for calculation of monetary value. In Ziway, one kilogram of fish is sold for 30 ETB. Therefore, based on the information obtained using simple multiplication, (2.5 kg fish loss/day/individual × 30 ETB × 7 months × 12 days/ month) the estimated total loss per fisherman in that particular Lake is found to be 6300 ETB per year (equivalent to 166 USD/year/individual). The amount of loss in terms of money was estimated with a simple calculation. One kilogram of fish has been sold 30 ETB in the area which is (average fish price of the four commercially important fishes produced in the area with the year of the research). This calculation (from the interview) was somehow in line with calculations from secondary data obtained from the three neighboring District offices of the lake. The loss estimated from the interview indicated that there is still a huge loss in terms of money from the study area. This calculation is an annual loss incurred by a single legally registered fisherman. As the number of fishermen may not be figured out clearly because there are illegal fishermen as well, who sell their product in secret, estimating the exact annual loss may not be possible. The number of illegal fishermen fluctuates from time to time depending on the security level implemented by local militia. However, this result is a clear indication that there is a significant amount of resource being lost in this area yearly. Therefore, based on this, 643 tons × 1000 × 25ETB/kg × 10 years is 160,750,000 ETB which is equivalent to 4,230,263 USD which is the monetary value of fish lost in the past ten years after production from this lake. One kilogram of fish has been sold 25 ETB in the area which is (average fish price of the four commercially important fishes produced in the area and average prices of the past ten years according to the information gained from Livestock and Fisheries Resources Development Offices). In the past ten years according to the above information or result, there was a great loss of fish after production, therefore if it is continued in this way it affects both the lake and its resources so, that to decrease or to stop such type of losses the government and the community should work together.
Conclusions and Recommendation
The fishery cooperatives in the study area experienced serious fish post-harvest losses due to poor post-harvest handling, storage and management problems. Physical loss was the most common loss observed causing high economic loss. Improvement of facilities from the point of production until it reaches the consumer is vital, and fish must be stored and distributed under chilled temperature conditions. The observed types of postharvest fish losses encountered during the current study include physical losses, quality losses and market losses. These losses can be prevented or reduced when the government and stakeholders intervene. It will help to reduce food losses and to avoid food insecurity and its accompanying problems like starvation, malnutrition and disease infections. Based on the quantitative data gathered from participants by questionnaire and interview 57% and 35% and 8% were obtained as physical fish loss, quality loss and market force loss respectively on this lake. This information indicated us highly physical loss was observed to the lake when compared with others. The main causes of post-harvest fish losses in the study area included harvesting immature fish (36.24%), high environmental temperatures (29.97%), infrastructures problems (18.12%), absence (delayed) marketing (9.756%) and increasing number of boats (5.923%). The estimated monetary loss from secondary data was found to be 160,750,000 ETB which is equivalent to 4,230,263 USD for the last 10 years from the lake. And based on the mean daily loss obtained from participants, the estimated total loss per fisherman in that particular Lake is found to be 6,300 ETB per year (equivalent to166 USD/year/individual). The findings of this study can be used as a basis for planning of intervention measures to reduce resource loss in these and other Lakes of the country. Fishermen need developmental interventions by responsible organizations, Provision of preservation items like freezers, generators, and boats, net and on job training about proper fish handling practices may play a tremendous role in decreasing loss in the study Lakes.
Recommendation
• Proper fish post-harvest technologies must be put in place to reduce losses arising from low post-harvest techniques for our artisanal fishermen.
• Government and individual organizations must also provide adequate storage facilities like cold stores to store excess fishes, generators, and fishermen, processors and fish sellers must practice good hygiene during fish handling and processing.
• Maintaining fish as cold as possible using different technologies like using ice made by solar ice making where electric power is not accessible is recommended to minimize post-harvest fish losses caused by spoilage.
References
- Ames GR (1990) The kinds and levels of post-harvest losses in African inland fisheries. Proceedings of the Symposium on Post-Harvest Fish Technology, FAO, Rome, Italy. pp: 1-10.
- Getu A, Misganaw K (2015) Post-harvesting and Major Related Problems of Fish Production. Fish Aquac J 6.
- Cheke RA, Ward AR (1998) A model for evaluating interventions designed to reduce post-harvest fish losses. Fish Res 35: 219-227.
- Diei-Ouadi Y, Mgawe YI (2011) Post-harvest fish loss assessment in small-scale fisheries: A guide for the extension officer. FAO Fisheries and Aquaculture Technical Paper. No. 559. Rome, FAO. pp. 93.
- Ahmed AA (2008) Post-Harvest Losses of Fish in Developing Countries. Nutrition and Health 19: 273-287.
- Tesfay S, Teferi M (2017) Assessment of fish post-harvest losses in Tekeze dam and Lake Hashenge fishery associations: Northern Ethiopia. Agric Food Secur 6.
- FAO (1990) Proceedings of the symposium on post-harvest fish technology.
- Gasse F, Street F (1978) Late quaternary lake-level fluctuations and environments of the northern Rift Vally and Afar Depression (Ethiopia and Dijbouti). Palaelogeography, Palaeoclimatology, Palaeoecology 24: 279-32.
- Schroder R (1984) An attempt to estimate the fish stock and the sustainable yield of Lake Ziway and Lake Abaya, Ethiopian Rift Valley. Arch Hydrobiol 3: 411-441.
- Golubtsov A, Dgebuadze Y, Mina M (2002) Fishes of the Ethiopian rift valley. In: Ethiopian rift valley Lakes. pp. 167-256 (Tudorance C and Taylor WD eds). Backhuys publishers, Leiden.
- Alemu Lema Abelti (2016) Postharvest and nutritional loss assessment of fish at different handling stage from Genale River, Southeastern Oromia. Int J Fish Aquat Sci 4: 263-266.
- Yared T (2014) Kinds and levels of post-harvest losses and the possible ways to reduce the losses in Lake Hashengie. In: proceeding of the sixth national conferences of the Ethiopian Fisheries and Aquatic Sciences Association (EFASA), In press. Mekelle/Ethiopia.
- Johnson K, Ndimele PE (2011) A Review on Post-Harvest Losses in Artisanal Fisheries of Some African Countries. J Fish Aquat Sci 6: 365-378.
- Bengwe L, Kristofersson DM (2012) Reducing post harvest losses of the Artisanal Dagaa fishery in Lake Victoria Tanzania: a cost and benefit analysis. In: IIFET 2012 Tanzania Proceedings, pp. 1-12.
- Yared T, Abera D, Ahmed (2007) Kinds and levels of post-harvest losses and the possible ways to reduce the losses in Lake Ziway. In: proceeding of the 15th national conferences of the Ethiopian Society of Animal Production (ESAP). P 141-146, Addis Abeba/Ethiopia.
Citation: Abelti AL, Hasen K, Mingist M, Michael GG (2021) Assessment of Post- Harvest Fish Losses in Lake Ziway, Ethiopia. J Fisheries Livest Prod 9: 318.
Copyright: © 2021 Abelti AL, et al. This is an open-access article distributed under the terms of the Creative Commons Attribution License, which permits unrestricted use, distribution, and reproduction in any medium, provided the original author and source are credited.
Select your language of interest to view the total content in your interested language
Share This Article
Recommended Journals
Open Access Journals
Article Usage
- Total views: 3384
- [From(publication date): 0-2021 - Nov 29, 2025]
- Breakdown by view type
- HTML page views: 2686
- PDF downloads: 698