Assessment of Hyperspectral Sampling Based Analysis Technique for Copper Grade Estimation at a Concentrator Plant
Received: 25-Oct-2017 / Accepted Date: 05-Nov-2017 / Published Date: 17-Nov-2017 DOI: 10.4172/2168-9806.1000184
Abstract
The success of any mining industry highly relies on the estimated values of ore grade in the mineral deposit. Hence rapid determination of ore grade is very essential task in daily schedule in operational mines. Now days, assay value is determined by chemical analysis or X-Ray Fluorescence (XRF) method. Real time grade estimation and monitoring is not possible by this conventional method due to longer time requirement for sample preparation and processing. Early research in exploration studies by various researchers indicated that hyper spectral technique is a promising technology for mineral identification and mapping. Therefore, determination of ore grade using hyper spectral based radiometric data would be a possible alternative for online quality monitoring. With this aim, the present study has been conducted to find whether there is any correlation exists between copper grade concentrations with the absorption parameters of mineral spectra. The study relates to copper grade estimation of chalcopyrite ore at the concentrator plant of one of the Indian copper mine. Twenty eight samples are collected from the concentrator plant of the mine. The study result indicates that the band depth parameter of absorption spectra of chalcopyrite ore has a significant correlation (R2=0.96) with the copper grade concentration at the concentrator plant. Hence, this study provides an indication that hyper spectral technique could be a possible alternative for rapid grade estimation.
Keywords: Copper grade estimation; Hyper spectral application; Malanjkhand copper mine; Non-destructive analysis; Ore processing
Introduction
Automated sensor based quality monitoring is an established technology with applications in various processing operations. It is, for example, widely used within the food, pharmaceutical and recycling industries. Within the mining industry, however, sensor based ore sorting and quality/grade estimation is still an emerging technology with only a limited number of proven applications [1,2]. Technological developments on available sensors and increasing throughputs of automated grade determination tools have created interest to explore sensor based grade monitoring methodology in mining. Routine monitoring of ore quality is important at every step of mining operations starting from mining faces, blasted ore masses, mill head, blending stockpiles and ore processing. In Indian scenario, manual sampling collection followed by chemical analysis is the most prevalent technique for grade determination. The major drawback for manual assaying, among other, is the amount of time consumed for obtaining the final assay values. For an online grade monitoring and control, information of assay results are obtained at such a delay that no control measure can be adapted to maintaining the ore quality. Therefore, there is an urgent need of rapid and automatic grade determination for such routine monitoring of ore quality for these mining processes. This automatic grade interpretation would reduce the risk of human handling as well as improve speed and reliability of ore grading which ultimately would reduce production costs.
Copper ore in India has significant contribution in Indian economic. Ore mineralization in India is usually related to certain hydrothermal alteration zones. Early research work [3] suggests that an indirect relation exists between Cu grade and the NIR active spectral band. This indirect relation of NIR active mineral assemblages that represent different zones of hydrothermal alteration can be used as a fingerprint for Cu grade determination. Hyper spectral technology is prime and well proven phenomenon’s that characterize the mineral composition and chemical bonding present in the material. Use of hyper spectral technique for mineral identification was an active area of research in mineral exploration [3-6]. When light interacts with a mineral or rock, certain wavelength regions of incident light are absorbed, some are reflected, and some are transmitted depending on the chemistry and crystal structure. Absorption of energy in minerals results from electronic and vibration processes of molecules. The electronic processes include crystal field effects, charge transfers, conduction bands and color centers. The vibrational processes involving stretching, bending and rotation offer information about functional groups. Molecular vibration-related spectral absorption is characteristic of functional groups and is useful in identifying minerals [7]. With the advent of compact and sophisticated spectrometers and spectro-radiometers, laboratory spectroscopy might be used as a possible technology for mineral grade evaluation [8]. If the method is proven successful, it might be an alternative nondestructive less time consuming method of grade monitoring technique.
This study focuses on to investigate whether hyper spectral fingerprint based grade estimation would be an alternative methodology for grade determination. To this end, the present investigation relates to finding the relation between laboratory-based hyper spectral signature and concentrated copper grade.
Study area
The present study has been conducted on Malanjkhand Copper Deposit located in the Balaghat District, Madhya Pradesh, Central India. This deposit is an open pit mine comes under by Hindustan Copper Limited (HCL). It is one of the largest copper mine in Asia [9]. The total reserve is nearly 321 Million Tons (MT) with average grade 1.05% Cu as on 2013, and annual production of copper ore is 2 MT [10].
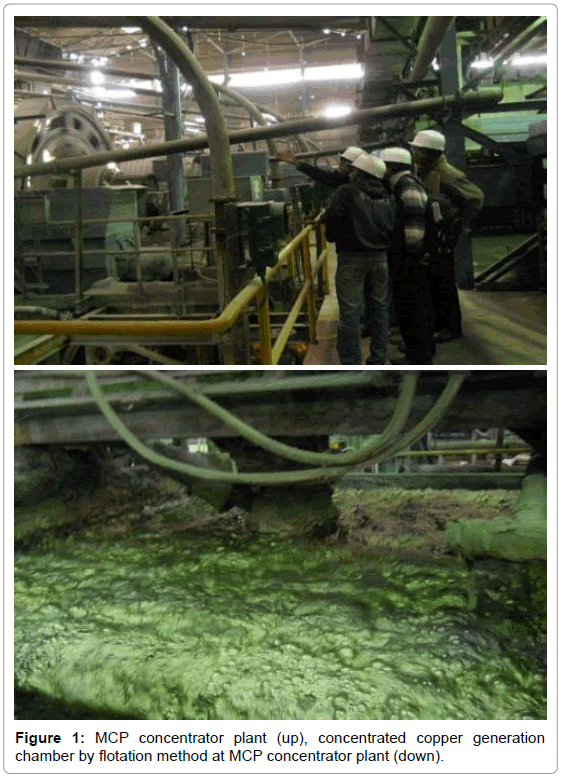
At Malanjkhand, Central India, lode type copper (molybdenum) mineralization occurs within calc-alkaline tonalite-granodiorite plutonic rocks of early Proterozoic age. The bulk of the mineralization occurs in sheeted quartz-sulfide veins, and K-silicate alteration assemblages. The mineralized zone is approximately 2 km in strike length, has a maximum thickness of 200 m and dips 65 m along which low-grade mineralization has been traced up to a depth of about 1 km. Primary ores consist essentially of chalcopyrite and pyrite with minor magnetite and molybdenite [11]. During 1991-1993 HCL produced about 2 million tonnes of ores each year with an average grade varying between 1.3% to 1.33% Cu, and 0.1-0.3% Mo in Cu-concentrates (21- 26% Cu). The pink granitoid is more enriched with Cu-mineralization in comparison to gray granitoid of the rest of the pluton. Chalco-pyrite, pyrite and molybdenite are the primary minerals and the secondary minerals are chalcocite, bornite, and covellite in the Malanjkhand copper deposit. However, the most prominent ore mineral is Chalcopyrite [12]. The ore of Malanjkhand open pit mines have 90% Chalcopyrite (CuFeS2) and 10% other oxide and sulphate ores. The coper mine has large capacity of production; a concentration plant of 2 Million tons capacity is present for processing the ore (Figure 1). The available sulphate ore are of three types, depending on the percentage of Copper present in the ore; 0.95% and above are called high grade ore, 0.45-0.95% are called low grade ore and 0.2-0.44% are called lean ore [13].
Experimental Methodology
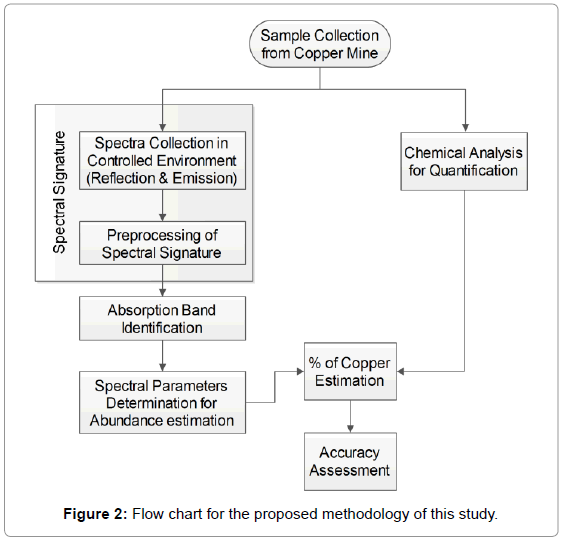
The methodology in this research study involves sample collection and preparation, hyper spectral signature acquisition, preprocessing of laboratory spectra to make it representative, absorption zone identification for mineralogy and abundance estimation, geochemical analyses to determine actual parentage of copper present in the sample and evaluate the accuracy of spectro-radiometer based procedure with the actual value. Flowchart as shown in Figure 2 is describing the methodology of the current study.
Sample collection and preparation
In this research study, twenty eight samples have been collected from Copper Concentrator Plant (Figure 3) at Malanjkhnad Copper Mine. The samples are in powder form of average size -200 mesh. In order to increase the study range of copper concentrated values, the samples have been collected over few days from the concentrator plant. Samples weighing of 500 g are then put into an open hot air furnace for 2 h at 105°C temperature for moisture removal. Finally a sample is prepared for chemical analysis and laboratory spectra acquisition.
Hyper spectral fingerprint acquisition
SVC HR-1024i spectro-radiometer is used for Hyperspectral signature collection for twenty eight concentrated copper samples. This instrument consists of several spectral bands with the nominal bandwidth of 1.5 nm from 350 to 1000 nm range, 3.8 nm bandwidth from 1000 to 1890 nm and 2.5 nm in the range of 1890 to 2500 nm wavelength [14].
While collecting reflection spectra in the laboratory of these samples, 14° FOV of the lens has been set, samples are spread within 5 cm diameter. The distance between the spectral sensors from the sample has been kept at 20 cm. This allows maintaining 14° FOV of the sensor geometry. Two 1250 lumens halogen lamps have been used as the light source and they are kept vertically around 10° angle with the spectro-radiometer sensor. These halogen lamps have been placed in such a way that sample area is illuminated uniformly as far as possible. Before the start of the spectra acquisition, a reference spectra of white plate has been taken for sensor calibration. To make the spectra representative for a sample, four repeated spectra are taken by rotating the sample clock wise at 45° interval. The representative spectra are taken as the averaging of these four repeated spectral signatures.
Preprocessing and filtering of spectra
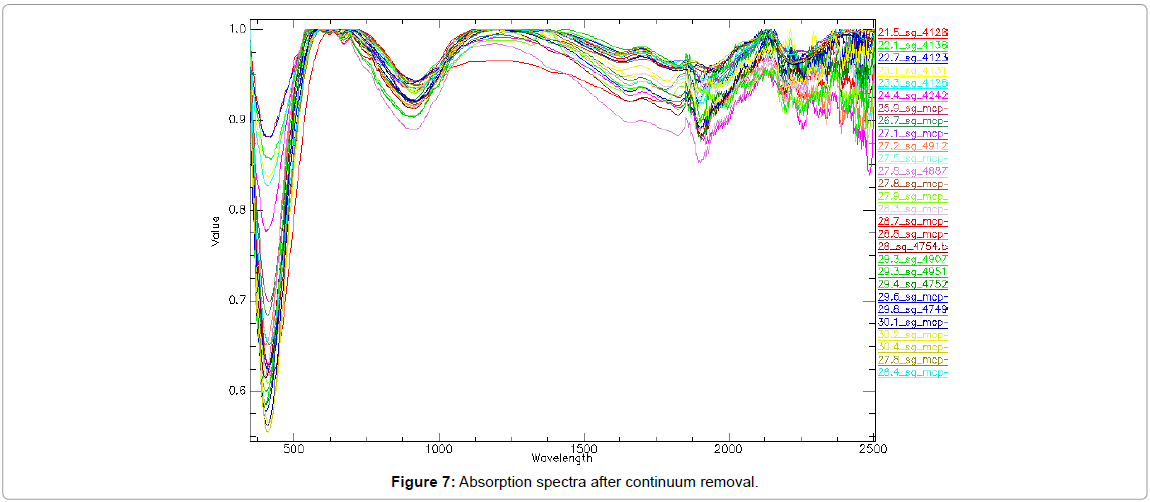
The spectral signature which is captured by the spectro-radiometer depends on different parameters. For comparison of those hyperspectral fingerprints of the samples, certain pre-processing is necessary for the captured spectra. One of the major parameter that contributes on the spectral value is the reflection from the sample surface. This reflection depends on the illumination of the light source. This surface reflection essentially contributes the continuum part of the overall the spectral signature. Hence, mineral identification and abundance estimation from hyperspectral data depends on efficient removal of continuum part from the signature [15]. The continuum removed reflectance R((λ))’ is obtained by dividing the reflectance value Rλ for each waveband in the absorption pit by the reflectance level of the continuum line (convex hull) RCλ [16] at the corresponding wavelength as shown in eqn. (1).
 (1)
(1)
The continuum is a convex hull fitted over the top of a spectrum to connect local spectrum maxima. The first and last spectral data values are on the hull and therefore the first and last values of continuum removed spectrum are equal to 1. So, the output curves have values between 0 and 1, in which the absorption pits are enhanced.
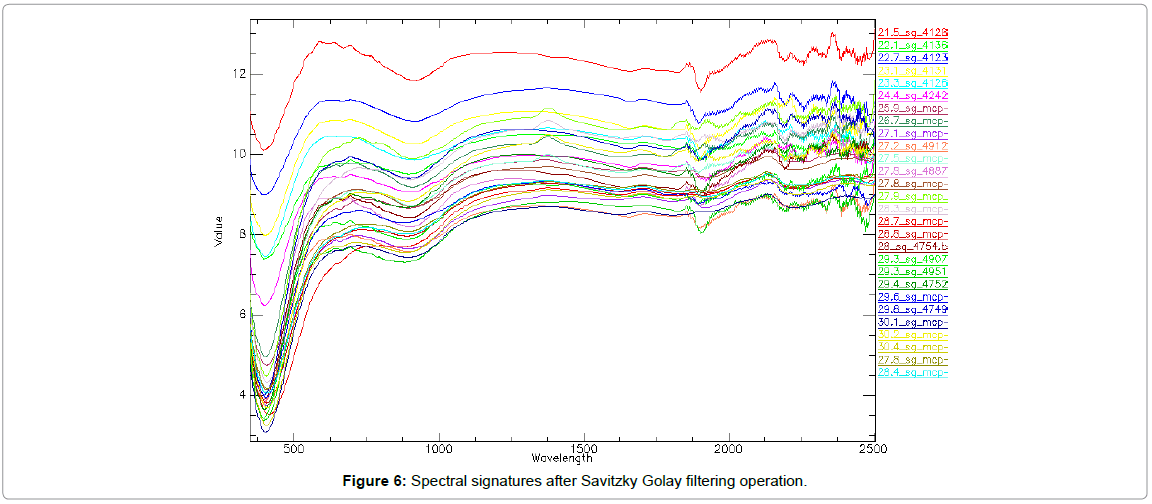
Additionally, an effective filtering technique should be applied to remove the random noises introduced during signature acquisition process. Estimating a signal, degraded by additive random noise is a classical problem in signal processing. In this article the Savitzky-Golay (SG) [17,18] filter have been used for noise reduction.
Absorption band identification
After continuum part of the spectra is removed from the original spectra, the absorption spectra are generated. Each mineral has its unique absorption spectra characterized by few dominant spectral bands. These absorption bands are indicator of specific mineral type. Many research studies reported that the spectral band properties of mineral may change with the relative abundance of a mineral type in the mineral assemblage [4,19,20]. Because of this property, the hyperspectral fingerprint could be used for estimating grade in ore material. Therefore, matching of absorption spectra with a reference spectra of particular mineral is a step forward for identifying mineral type and its abundance estimate.
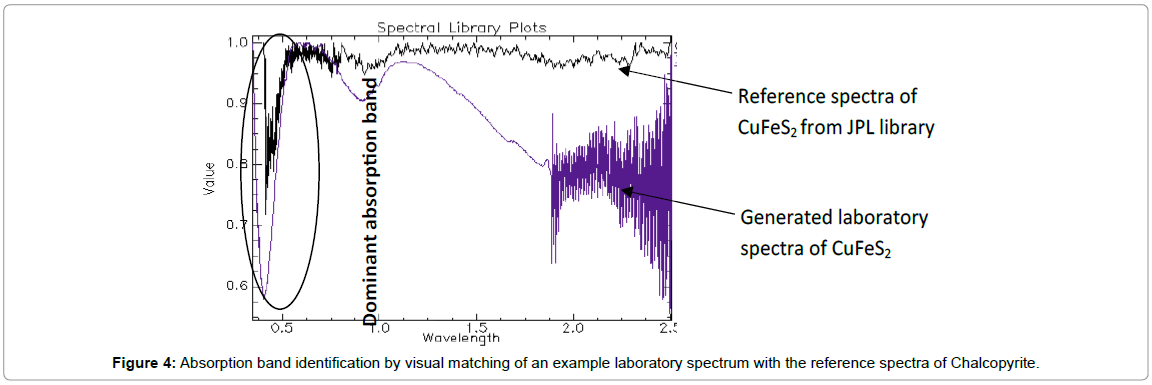
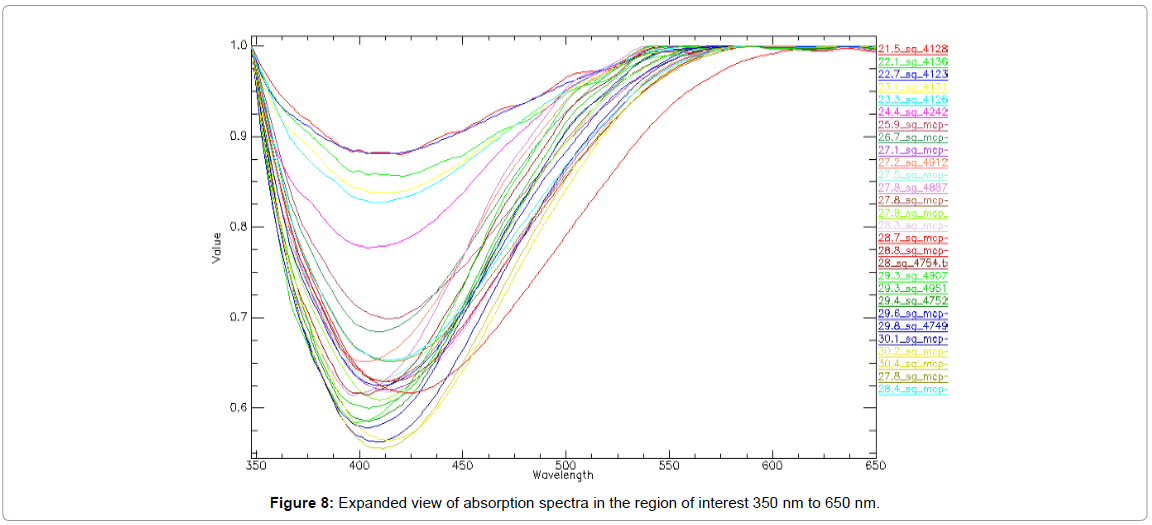
The United States Geological Survey (USGS) has spectral library of different minerals and rocks in the range of ultraviolet (0.35 μm) to SWIR regions (2.5 μm). The Jet Propulsion Laboratory (JPL) has also published spectral library for 160 minerals, in the range of 0.4 to 2.5 μm [7]. As the predominant Copper ore for the case study deposit is the chalcopyrite (CuFeS2), the generated spectra are matched with the standard JPL spectra of this ore forming mineral. It can be noticed from Figure 4 that the Chalcopyrite has a dominant absorption band in around 400 nm spectral range. Absorption band of the generated spectra is compared with the reference spectra of CuFeS2 in this band.
Characterization of absorption band parameter
Once the absorption band is identified one has to characterize this band. An absorption band is characterized by three parameters band center, band depth, full width half maxima (FWHM). According to crystal field theory of electronic transition, the absorption energy (e) is related by a power law (eqn. (2)) of the average bond length (r):
 (2)
(2)
Where, n is a real number. Utilizing this power law equation, many studies attempted to fit a Modified Gaussian distribution Model (MGM) [21-24] to the absorption band. The present study has applied MGM model fitting procedure to characterized absorption band of generated spectra and found out the band parameters.
Result and Discussions
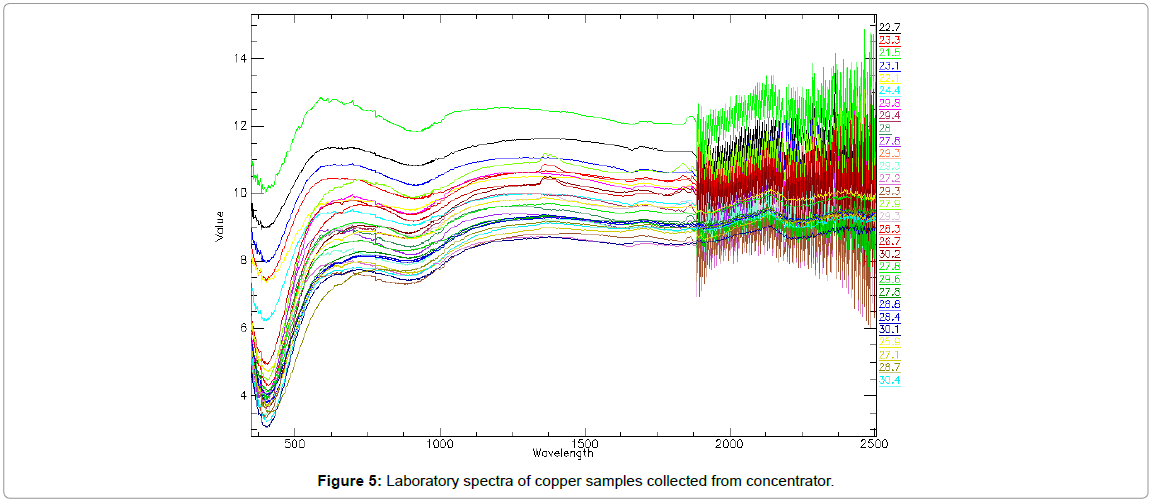
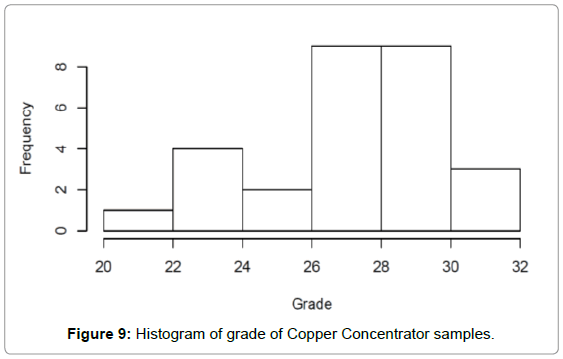
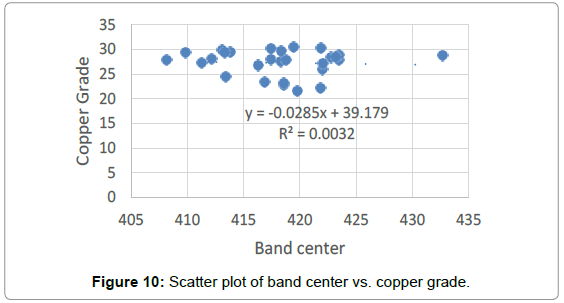
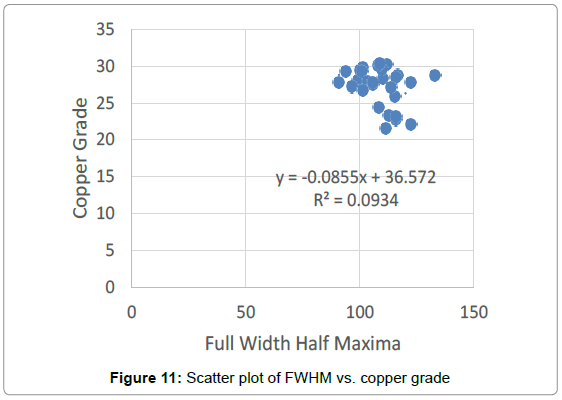
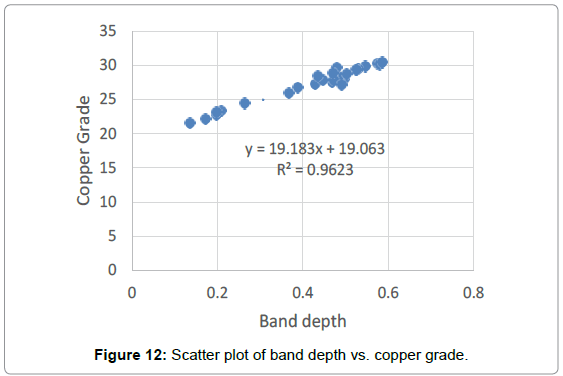
Twenty eight concentrated samples collected from the concentrator plant are analyzed for this study. The laboratory spectra of these twenty eight samples are generated using spectro-radiometer. Figure 5 presents the spectral signature of these samples. It can be seen that certain noise has got introduced into the spectral signature during acquisition process. Filtering of the noise using Savitzky-Golay algorithm resulted smooth signatures as presented in Figure 6. These signatures are decomposed into continuum components and absorption components. For extracting continuum component a convex hull is fitted over the spectra as discussed earlier. Since continuum component is not important as far as identification of mineral type, only absorption components after continuum removal are analyzed. Figure 7 shows the absorption spectra of these samples. It can be seen that four different absorption bands are observed in the spectral range. The band center values of this absorption bands are approximately 400 nm, 930 nm, 1900 nm and 2200 nm respectively. However, the dominant band remains to be at the 400 nm region. The reference spectrum of CuFeS2 also confirms this observation of dominant band at 400 nm. Therefore, this band is used for further analysis for finding the relationship among band parameters with the concentrated Copper grade. The expanded pictorial representation Figure 8 shows the expanded view of this absorption band which presents a visual impression to the readers about the variation of band characteristics with the change of grade values. This absorption band then fitted with MGM for finding three band parameters band center, band depth, full width half maxima (FWHM). In parallel with this experiment, chemical analyses of these samples are also done for finding the Copper grade. Figure 9 shows the histogram plot of the concentrated copper grade of twenty eight samples. A quantitative analysis is then performed to find out inter relationship between band parameters with concentrated copper grade. Figures 10-12 show the scatter plots of Copper grade vs. band center, Copper grade vs. FWHM and Copper grade vs. band depth respectively. It is evident from the figures that there are no significant correlations exist between copper grade with band center, and Copper grade with FWHM. However, there is significant correlation (R2=0.96) observed between copper grade with band depth. Therefore, the band depth parameter could be used as an indicator for Copper grade determination. The subsequent simple regression analysis results the following prediction equation for Copper grade determination.
y=19.18x+19.06.
Where; y=Copper grade in percentage
x=band depth.
Conclusion
The automatic sensor based hyperspectral based grade determination technique for concentrated copper reveals that the band depth of absorption spectra of Chalcopyrite ore has a significant correlation with the copper grade variation with R2 value of 0.96. However, other two absorption parameters, band center and FWHM do not bear any such significant correlation with the copper grade variation. Therefore, band depth parameter could be used as a good predictor for copper grade determination. The technology is simple, automatic and can provide rapid solution for grade monitoring purpose. The associated operation will be processing of captured spectral signatures as adopted in this study. However, the interpretation is based on only a limited number of samples. Thus this study provides an initial basis for further research. Any real life adaptation of this technology would require extensive study to confirm these findings.
Acknowledgements
The author thanks Malanjkhand Copper Mine, HCL for providing all the facilities to conduct this study. The authors also thankful for Regional Remote Sensing Center (RRSC, EAST) Kolkata, ISRO for assisting in spectro-radiometric study.
References
- Salter JD, Wyatt NPG (1991) Sorting in the minerals industry: past, present and future. Minerals Engineering 4: 779-796.
- Sivamohan R, Forssberg E (1991) Electronic sorting and other preconcentration methods. Minerals Engineering 4: 797-814.
- Babu PS (2015) Satellite Based Hyperspectral Imaging Technique for Identification of Iron and Bauxite Ore Minerals (Doctoral dissertation, IIT, Kharagpur).
- Patteti S, Samanta B, Chakravarty D, Dutta D (2015) Mixed spectral study of hyperspectral data for abundance estimation of ores in Gua iron ore mines, India. CIM J 6: 208-226.
- Suman Babu P, Majumdar TJ, Bhattacharya AK (2015) Study of spectral signatures for exploration of Bauxite ore deposits in Panchpatmali, India. Geocarto International 30: 545-559.
- Parashar C (2015) Mapping of Alteration mineral zones by combining techniques of Remote Sensing and Spectroscopy in the parts of SE-Rajasthan (Doctoral dissertation, ISRO).
- Shen SS (1996) Hyperspectral Remote Sensing and Applications. In Hyperspectral Remote Sensing and Applications 2821.
- Gallie EA, McArdle S, Rivard B, Francis H (2002) Estimating sulphide ore grade in broken rock using visible/infrared hyperspectral reflectance spectra. International Journal of Remote Sensing 23: 2229-2246.
- Pandey PK, Sharma R, Roy M, Pandey M (2007) Toxic mine drainage from Asia’s biggest copper mine at Malanjkhand, India. Environmental geochemistry and health 29: 237-248.
- Qaisar SH, Ahmad MA (2014) Production, consumption and future challenges of coal in India. International Journal of Current Engineering and Technology 4: 3437-3440.
- Sarkar SC, Kabiraj S, Bhattacharya S, Pal AB (1996) Nature, origin and evolution of the granitoid-hosted early Proterozoic copper-molybdenum mineralization at Malanjkhand, Central India. Mineralium Deposita 31: 419-431.
- Equeenuddin SM (2015) Occurrence of alpersite at Malanjkhand copper mine, India. Environmental Earth Sciences 73: 3849-3853.
- Singh R (2014) Vacational traning in mineral processing field Hindustan Copper Limited.
- Das SK, Kumar S, Ramachandrarao P (2000) Exploitation of iron ore tailing for the development of ceramic tiles. Waste Management 20: 725-729.
- Ramakrishnan D, Nithya M, Singh KD, Bharti R (2013) A field technique for rapid lithological discrimination and ore mineral identification: Results from Mamandur Polymetal Deposit, India. Journal of earth system science 122: 93-106.
- Mutanga O, Skidmore AK (2003) Continuum-removed absorption features estimate tropical savanna grass quality in situ. In Earsel workshop on imaging spectroscopy 3: 13-16.
- Ruffin C, King RL (1999) The analysis of hyperspectral data using Savitzky-Golay filtering-theoretical basis. 1. In Geoscience and Remote Sensing Symposium, IGARSS'99 Proceedings. IEEE 1999 International 2: 756-758.
- Liu Y, Dang B, Li Y, Lin H, Ma H (2016) Applications of Savitzky-Golay Filter for Seismic Random Noise Reduction. Acta Geophysica 64: 101-124.
- Wang Z, Feng Y (2017) Abundance Estimation of Hyperspectral Data with Low Compressive Sampling Rate. Sensing and Imaging 18: 23.
- Qu Q, Nasrabadi NM, Tran TD (2013) Hyperspectral abundance estimation for the generalized bilinear model with joint sparsity constraint. In Acoustics Speech and Signal Processing (ICASSP) IEEE International Conference, pp: 2129-2133.
- Brown AJ (2006) Spectral curve fitting for automatic hyperspectral data analysis. IEEE Transactions on Geoscience and Remote Sensing 44: 1601-1608.
- Gallie EA, Lyder DA, Rivard B, Cloutis EA (2008) Equivalence of modified Gaussian model (MGM) in wavenumber and Gaussian in wavelength for deconvolution of hyperspectral reflectance spectra. International Journal of Remote Sensing 29: 4089-4096.
- Hong PK, Miyamoto H (2016) An Automatic Deconvolution Method for Modified Gaussian Model using the Exchange Monte Carlo Method: Application to Reflectance Spectra of Synthetic Clinopyroxene, J Geol Geophys 5.
- Sunshine JM, Pieters CM, Pratt SF (1990) Deconvolution of mineral absorption bands: An improved approach. Journal of Geophysical Research: Solid Earth 95: 6955-6966.
Citation: Samanta B, Manna B, Chakravarty D, Dutta D (2017) Assessment of Hyperspectral Sampling Based Analysis Technique for Copper Grade Estimation at a Concentrator Plant. J Powder Metall Min 6: 184. DOI: 10.4172/2168-9806.1000184
Copyright: © 2017 Samanta B, et al. This is an open-access article distributed under the terms of the Creative Commons Attribution License, which permits unrestricted use, distribution, and reproduction in any medium, provided the original author and source are credited.
Share This Article
Recommended Journals
Open Access Journals
Article Tools
Article Usage
- Total views: 6653
- [From(publication date): 0-2017 - Apr 03, 2025]
- Breakdown by view type
- HTML page views: 5676
- PDF downloads: 977
