Assessment of Future Water Availability and Irrigation Water Demand under Climate Change in the Kankai River Basin, Nepal
Received: 27-Aug-2022 / Manuscript No. jescc-22-73253 / Editor assigned: 29-Aug-2022 / PreQC No. jescc-22-73253 (PQ) / Reviewed: 12-Sep-2022 / QC No. jescc-22-73253 / Revised: 16-Sep-2022 / Manuscript No. jescc-22-73253 (R) / Accepted Date: 16-Sep-2022 / Published Date: 23-Sep-2022 DOI: 10.4172/2157-7617.1000639
Abstract
Climate change and its impact on the basin's hydrological processes can progressively assist in addressing the difficulties that water resource managers and planners will face in the future. Estimating Crop Water Requirement (CWR) and irrigation water demand in a changing climate is critical for long-term water resource development and planning. Therefore, this study examines the climate change impact on the water balance of the Kankai river basin, Nepal. The study used the CMIP6 (Coupled Model Inter comparison Project) model output to project future climatic variables from 2015 to 2100, the SWAT (Soil and Water Analysis Tool) model to set up the rainfall-runoff model, SWAT CUP for calibration validation, sensitivity analysis, and future stream flow projection and CROPWAT8.0 (Crop Water and Irrigation Requirements Program) is used to estimate CWR and Irrigation Water Requirement (IWR). Ten general circulation models under two climate change scenarios (middle road approach i.e. ssp245, and high emission scenario i.e. ssp585) were considered to examine the impact of climate change on water balance. Results revealed that the effects of climate change are reflected in future river flow and irrigation water demand in the Kankai river basin. It shows that the maximum temperature rises from 0.72°C to 3.28°C, the minimum temperature rises from 0.91°C to 4.55°C and the precipitation varies from -7.43 % to +14.68 % in the middle road approach and high emission scenarios. According to the findings, the Kankai basin will likely increase rainfall and temperature in the future. The impact of increased rainfall and rise in temperature is reflected in yearly river flow, which is expected to increase by 11.65–36.74% compared to historical data from 1980 to 2014. Despite this rise, predictions show that the Kankai irrigation system will continue to be a water deficit basin in future decades from February to March.
Keywords: Agriculture; Climate change; SWAT; CMIP6; Kankai river basin; Irrigation water requirement; GCM
Introduction
According to studies, the rise in global temperature will have a considerable impact on the global water cycle and precipitation pattern as a result of climate change. According to reports, the disparity in precipitation between wet and dry regions and seasons would wide [1]. Water resources are extremely important to the world's population. Water quality, quantity, and availability may be impacted by climate change. A report from Intergovernmental Panel on Climate Change (IPCC), Assessment Report Five (AR5) contains the literature on the technological, scientific, economic and social aspects of the climate change [2]. According the AR5 [3], the risks associated with freshwater due to climate change may increase as the greenhouse gas concentration in the atmosphere is increasing due to accelerated anthropogenic activities. Climate change is having varied degrees of impact on river basins around the world [4-6]. IPCC has defined a set of SSP/RCP-based scenarios for Phase 6 of Coupled Model Intercomparison Project (CMIP6) for future climate projections [7-8]. Nepal has significant seasonal and temporal fluctuations in important climatic factors. The difference in altitude affects the temperature and precipitation. As a result, Nepal has a wide range of climate conditions, ranging from tropical in the south to alpine in the north. The SWAT model was used to investigate the impact of climate change on Iran's water resources, and it was discovered that in the future, there will be more precipitation in wet areas and less precipitation in dry areas [9]. The impact of climate change on the snow hydrology of the Koshi river basin was investigated by [10]. The influence of climate change on water availability in the Bagmati basin was also calculated by [11]. These studies indicated that there will be considerable changes in hydrology of the local basin in the long run due to climate change under different future scenarios.
When a climate variable (temperature) rises, the air in the atmosphere warms up, speeding up the evaporation of soil moisture. The amount and frequency of irrigation water needed is determined by the type of crop and rainfall precipitation over a given time period. The crop water need estimation is governed by evaporation. A The climate crop water requirement (CCWR) integrated framework has been created to predict irrigation requirements in the Manimuthar river basin in Tamilnadu, India, while taking into account changes in climatic characteristics over time. Based on the existing land use pattern and economic development in the research area, the most likely climatic scenario has been chosen as A1B. According to the findings, the irrigation water requirement is expected to rise by 5% between 2010 and 2020 [12]. The impact of climate change on crop water requirements has been investigated in the Sunei command area (Bhudhabalang Basin) of the Mayurbhanj district of Odisha, India. It demonstrates that crop water requirements rise in both H3A2 and H3B2 scenarios, however crop water requirements decrease in the future for some Rabi season crops as Dalua rice, Groundnut, and Mustard in the H3B2 scenario [13].
Statement of problems
Climate change has an impact on hydrological regimes, which in turn has an impact on water availability in river basins. Significant temporal and spatial variability have been observed across the several basins, according to studies. Nepal has become increasingly vulnerable to the impact of climate change as a result of this fluctuation [14-15].
Furthermore, studies have demonstrated potential future implications on precipitation and temperature regimes under various climate scenarios [16]. The hydrology of the basin is directly affected by variations in temperature and precipitation patterns. Such fluctuation has a severe impact on agricultural water supply, which is critical to rural people's agriculture-based livelihoods. Changes in water supply have a big impact on agricultural productivity [17].
Studies conducted previously are based on CMIP3 or CMIP5 model outputs. CMIP6 is the latest generation of future climate models. This study will project future of precipitation and temperature in Kankai basin and address the study gap in this basin. The projection will be made based on the model outputs of CMIP6.
Kankai river basin is situated in far eastern region of Nepal. The hydrology of the river basin and the expected implications of climate change in the basin have not been well investigated. In this framework, and using the Kankai River basin as an example, this study addressed three main research concerns: How would climatic variability (Temperature and Precipitation) changes in near, mid and far future including the most possible future scenarios? How does resulting change in climatic variability affect the future river flow in the basin? And how does resulting change in climatic variability affect the future water requirement of Kankai irrigation system?.
Study area
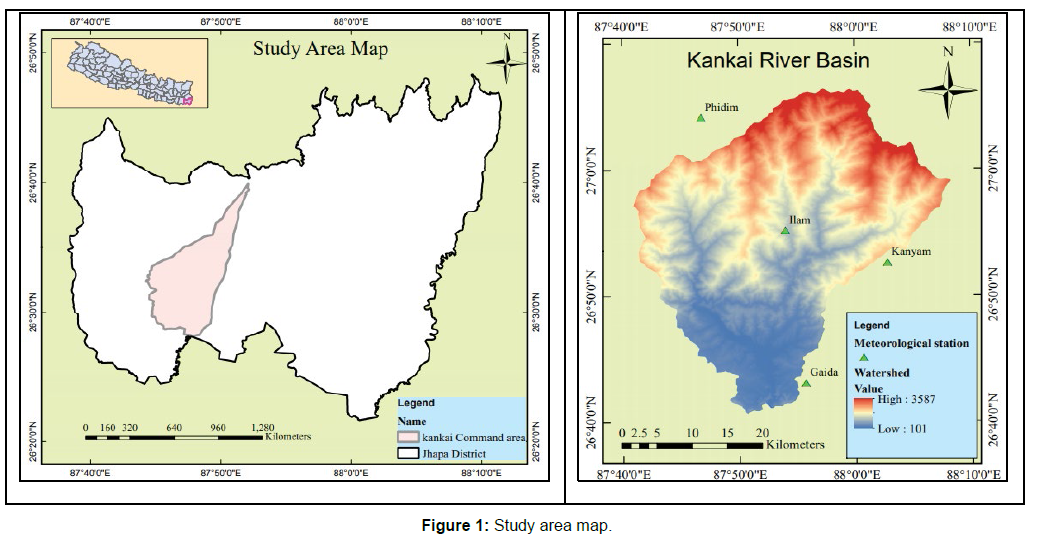
Kankai Basin is located in eastern part of Nepal. The latitude and longitude for the selected study area lies between 26°41' to 27°07' N and 87°44' to 88°09' E respectively. Kankai is the major river in the basin originating from the border of Ilam and Panchthar district. It is rain fed Perennial River. The catchment area of the Kankai basin is 1165 square kilometer (Figure 1). The elevation of the catchment area varies from 130 m to 3535 m above mean sea Level. Presently the Kankai Irrigation System (KIS) commands 7000 hectares of seven VDCs of Jhapa district of Province number 1. The command area is in the flat land of the Terai of Nepal, sloping mildly from north to south. Generally, crops are growing in to monsoon, winter and spring season. Winter season crops are wheat, maize, mustard, vegetable and pulses and monsoon and spring season crops are Rice and spring rice respectively. The water source of KIS is the Kankai River, a perennial river having a catchment area of 1190 square kilometers. The maximum and minimum historical discharges of the Kankai River are 5,200 cumecs and 7.74 cumecs respectively
Data collection
Meteorological data
The daily precipitation, maximum temperature, minimum temperature, wind speed and relative humidity data are collected from Department of Hydrology and Meteorology during 1980-2014 (Table 1).
| S.N. | Station Name | Index No. | District | Latitude | Longitude | Elevation (m) |
|---|---|---|---|---|---|---|
| 1 | GAIDA | 1421 | Jhapa | 26o35’ | 87o54’ | 143 |
| 2 | ILAM | 1407 | Ilam | 26o55’ | 87o54’ | 1300 |
| 3 | KANYAM | 1416 | Ilam | 26o52’ | 88o04’ | 1678 |
| 4 | PHIDIM | 1419 | Panchther | 27o09’ | 87o045’ | 1205 |
Table 1: Meteorological stations of study area.
Hydrological data
Hydrological data used for SWAT model is obtained from DHM. There is only one river gauging station in Kankai river basin (Station number 795, Mainachuli).
DEM data
The DEM is one of the SWAT model's key inputs. A DEM, which defines the elevation of any point in a particular area at a specific spatial resolution, was used to characterize topography. The DEM for this investigation was created using 1-arc second (about 30 m at the equator) resolution from the Advanced Space borne Thermal Emission and Reflection Radiometer (ASTER) Digital Elevation Model. The DEM was used to delineate the boundary of the watershed in SWAT model. The studies and use of the DEM layer are used to determine potential surface flows, basin boundaries, terrain slope calculations, and the effect of meteorological stations. The DEM was also used to calculate slope in this investigation.
Land use land cover data
The land use map of the study area was obtained from the International Centre for Integrated Mountain Development (ICIMOD) for the year 2010. According to this, there are eight types of land cover in the Kankai basin. The forest covers almost half of the total area in basin followed by agricultural uses. This basin also not includes a significant proportion of area under snow coverage.
Soil Data
SWAT model requires soil textural and physio-chemical properties of different layers of each soil type. For this study, soil map was taken from Soil Terrain Database (SOTER) Nepal. Six soil types are present in the basin. As shown in the SOTER map, the dominant soil type in lower part of the sub-basin is Dystric REGOSOLS.
Crop data
The crop coefficient (Kc), yield response factor (Ky) and root zone depth of study area is obtained from FAO irrigation and drainage paper number 56. Cropping pattern data and crop calendar (sowing and harvesting date of crop) including season wise crops grown in the study area was acquired from Kankai irrigation management division.
Collection of climatic data
CMIP6-GCMs model outputs will be collected from World Climate Research Programme (WCRP) website (https://esgfnode.llnl. gov/search/cmip6/). Daily precipitation and temperature are available only for these 10 GCMs. Those CMIP6-GCMs (along with their spatial resolutions) as given in Table 2.
| S.no | Model name | Latitude resolution | Longitude resolution | Research center |
|---|---|---|---|---|
| 1 | ACCESS-CM2 | 1.5 | 1.875 | Australian Community Climate and Earth System Simulator (ACCESS) |
| 2 | ACCESS-ESMI-5 | 1.5 | 1.875 | Australian Community Climate and Earth System Simulator (ACCESS) |
| 3 | BCC-CSM2-MR | 1.1215 | 1.125 | Beijing Climate Center (BCC) |
| 4 | EC-Earth3-Veg | 0.7018 | 0.7031 | European Community Earth (EC-Earth) |
| 5 | EC-Earth3 | 0.7018 | 0.7031 | European Community Earth (EC-Earth) |
| 6 | MRI-ESM2-0 | 1.1215 | 1.125 | Meteorological Research Institute (MRI) |
| 7 | MPI-ESMI-2-LR | 1.8653 | 1.875 | Max planck Institute for Meteorology (MPI) |
| 8 | MPI-ESMI-2-HR | 0.9351 | 0.9375 | Max planck Institute for Meteorology (MPI) |
| 9 | NorESM2-MM | 0.9424 | 1.25 | Norwegian Climate Center |
| 10 | INM-CM4-8 | 1.5 | 2 | Institute for Numerical Mathematics (INM) |
Table 2: CMIP-6 GCMs model output.
Methodology
Overall methodology
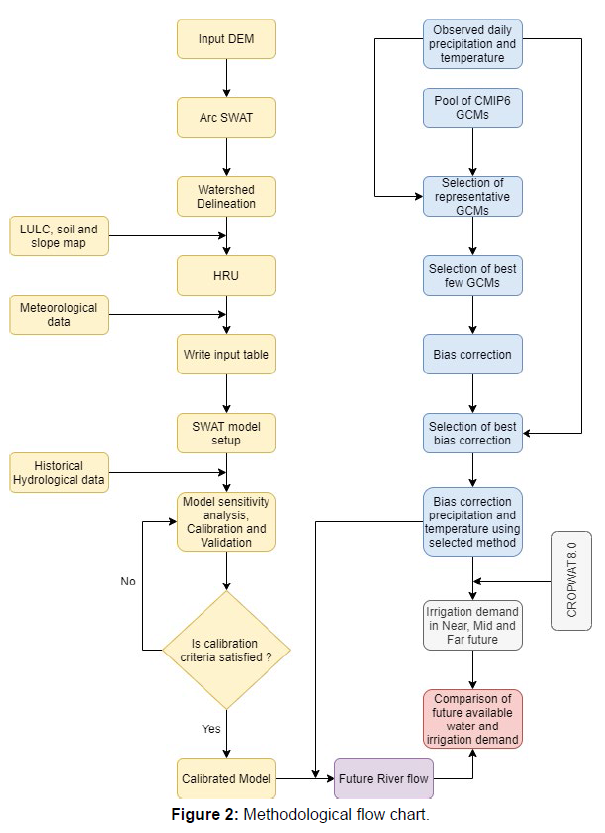
The overall analytical structure of the research is presented in Figure 2. The first phase included the collecting of various forms of data, including hydrological, temperature, discharge, land use, soil, crop data and meteorological data. Weather data for the future were downscaled from listed GCMs. Future crop water requirement and irrigation water requirement were calculated using the CROPWAT model and future river flow was evaluated after the model calibration and validation. In the end, a comparison of future available water and future irrigation demand was done.
There are five major stages:
➢ Rainfall runoff hydrological model setup in Arc SWAT.
➢ Calibration, Validation and Sensitivity analysis in SWAT CUP using SUFI2
➢ Future projection of Precipitation, Minimum and Maximum temperature
➢ Future stream flow projection using Calibrated model and projected climatic variables.
➢ Projection of crop water requirement and irrigation water requirement in Near, Mid and Far future.
Result and Discussion
Selected GCMs from pools of raw GCMs
The precipitation and temperature forecasts produced by several GCMs showed significant diversity. Each GCM has its own set of strengths and shortcomings; some are better in tropical areas than others in mountainous areas. It is critical to choose the model that works well in the desired area. As shown by the performance metrics, the performance of GCMs under various climatic indices varies depending on the model employed.
The performance metrics of each model for four station stations are computed and converted into arbitrary performance ratings based on the average of combined ratings of all metrics at all selected stations. Using a pool of 10 GCMs, the GCMs are ranked and the best performing 4 GCMs are selected. Using the four earlier mentioned performance metrics (i.e. RSR, R2, PBIAS and NSE), the rating of the individual GCMs for each station were calculated and their ranks were assigned based on the average ratings of all stations rating. Results showed that ACCESS-ESM1-5, MPI-ESM1-2-LR, BCC-CSM2-MR, NorESM2-MM are the models with generally higher ratings for the Precipitation. The above-mentioned GCMs were selected for further bias correction and multi-model ensemble for precipitation.
The performance metrics of each model for four station stations are computed and converted into arbitrary performance ratings based on the average of combined ratings of all metrics at all selected stations. Using a pool of 8 GCMs, the GCMs are ranked and the best performing 3 GCMs are selected. Using the four earlier mentioned performance metrics (i.e. RSR, R2, PBIAS and NSE), the rating of the individual GCMs for each station were calculated and their ranks were assigned based on the average ratings of all stations rating. Results showed that INM-CM4-8, NorESM2-MM, INM-CM5-0 are the models with generally higher ratings for the maximum temperature. The abovementioned GCMs were selected for further bias correction and multimodel ensemble for maximum temperature.
Similarly, NorESM2-MM, day_EC-Earth3, MPI-ESM1-2-HR are the models with generally higher ratings for the minimum temperature. The above-mentioned GCMs were selected for further bias correction and multi-model ensemble for minimum temperature.
Bias Correction
Initially, the historical period's temperature and precipitation biases were corrected. The historical precipitation data from ACCESSESM1- 5, BCC-CSM2-MR, MPI-ESM1-2-LR, and NorESM2-MM were bias-corrected for the four observed stations.
Similarly, minimum temperature and maximum temperature data from INM-CM4-8, INM-CM5-0, NorESM2-MM, and EC-Earth3 MPI-ESM1-2-HR, NorESM2-MM were bias-corrected for the four observed stations respectively. For precipitation, bias correction was done by thirteen methods, and selection of the best bias correction method was done by using performance rating of past data. For quantifying the performance, the performance used are Nash-Sutcliffe efficiency (NSE), root mean square error (RMSE) and percentage bias (PBIAS) and coefficient of determination (R2). Based on the average of combined ratings of all metrics at all selected stations using all 13 bias correction methods on a pool of 4 GCMs, the best performing bias correction method for precipitation was as Bernoulli Weibull method. Likewise, both maximum temperature and minimum temperature were bias-corrected by nine methods, and selection of the best bias correction method was done by using performance rating of past data. Based on the average of combined ratings of all metrics at all selected stations using all 9 bias correction methods on a pool of 4 GCMs, the best performing bias correction method for both maximum and minimum temperature was selected as the Linear Transformation method.
Future projection of temperature
I. Maximum temperature
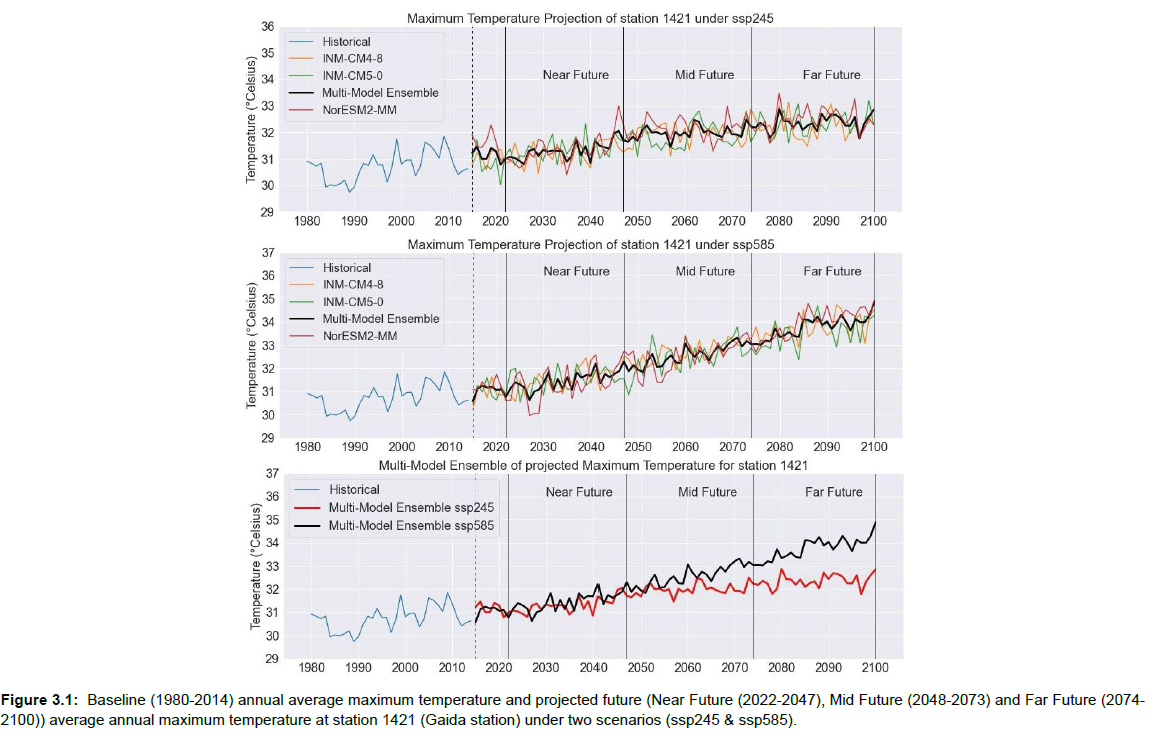
For the future prediction of precipitation and temperature, the GCM data from the period of 2022 to 2100 were used after bias correction. The future period was divided into 3 timelines of 25 years interval: Near Future (2022-2047), Mid Future (2048-2073) and Far Future (2074-2100). The predicted temperature in the basin showed a considerable rise in maximum temperature and minimum temperature after bias correction of GCMs data.
Up to the period 2100, the future temperature forecast in the study area was done. In the case of maximum temperature, the temperature rise was less for the ssp245 scenario while the ssp585 scenarios predicted a higher rise in temperature for all the three GCMs. Figure 3.1 presents a projection of the maximum temperature based on three GCMs under two SSP scenarios. It also shows that there is a rise in maximum temperature towards the future. The projected range of Multi-Model Ensemble for the maximum temperature under the middle of the road (ssp245) is between 30°C to 32.8°C whereas under ssp585 scenario (highway) is between 30.5°C – 35°C based on linear transformation bias-corrected results.
II. Minimum temperature
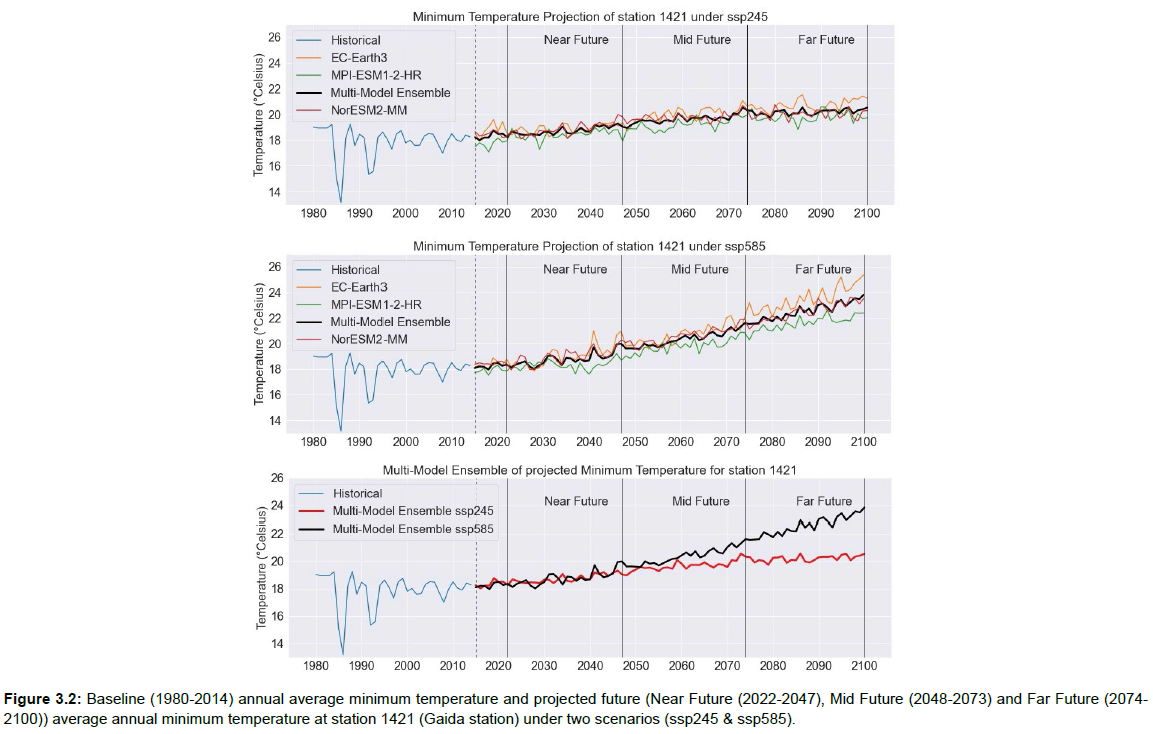
The projected average annual minimum temperature for station 1421 (Gaida station) based on three GCMs under ssp245 and ssp585 scenarios is illustrated in Figure 3.2.
The projected minimum temperature towards the future period shows that there is a rise in minimum temperature under both scenarios. In the case of maximum temperature, the temperature rise was less for the ssp245 scenario while ssp585 scenarios predicted a higher rise in temperature for all the three GCMs. The projected range of Multi- Model Ensemble for the minimum temperature under middle of the road (ssp245) is between 18°C to 20°C whereas under ssp585 scenario (highway) is between 18°C – 24°C based on linear transformation bias-corrected results. Plot for other meteorological stations of average annual maximum temperature is attached in an annex of this report.
III. Future projection of precipitation
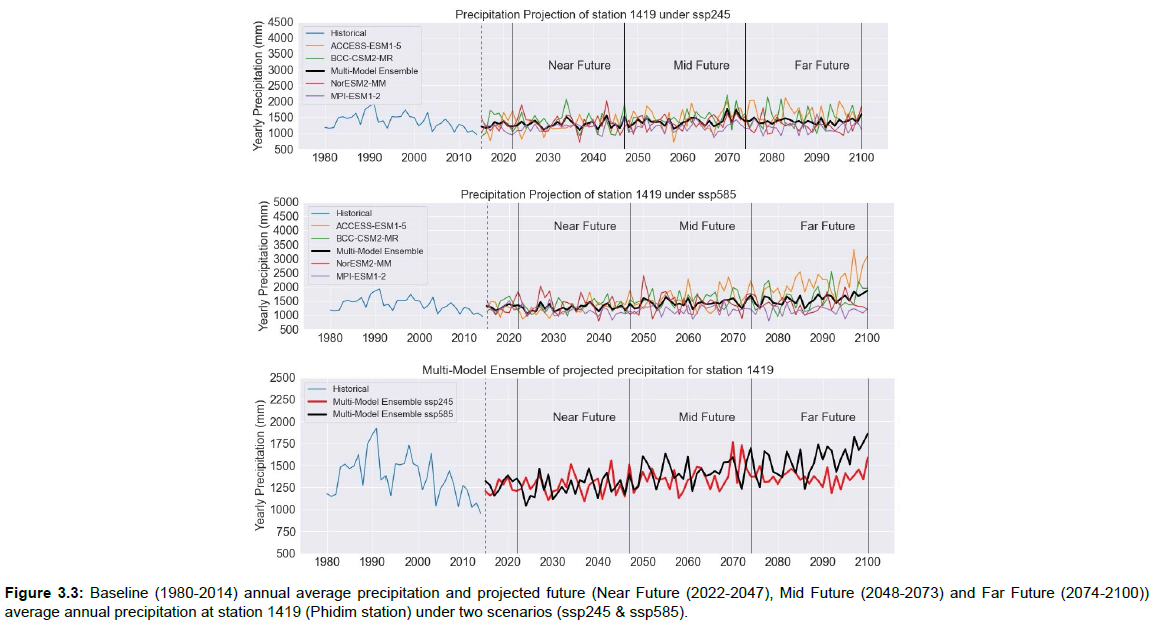
Figure 3.3 shows the precipitation projection for a representative station 1419 from 2015 to 2100 for all four stations. For both emission scenarios, the annual average precipitation in the basin varies throughout the year. The same time periods as for temperature prediction were used for precipitation forecasting.
The ssp585 showed a slight increase in precipitation compared to ssp245 in all the GCMs for the future projection period. Figure 3.3 presents the climate projection of 85 years of variability for all three GCMs for the Phidim station. The raw data after the extraction was also plotted to see whether there is a difference in ssp245 and ssp585. There is a slight increase in ssp245 than ssp585 but not with a significant difference. Plot for other meteorological stations of average annual maximum temperature is attached in an annex of this report.
Hydrologic modelling
I. Model calibration for runoff
Model calibration is required for preliminary testing of a model, as well as tuning observed data, and is required for the proper usage of any hydrologic simulation. In the present study manual and automatic calibration methods were applied. Single gauging stations were used for the calibration and validation of the model. In general, the outputs of the model are calibrated and validated using data from the previous 13 years. With observed hydrological data from DHM, monthly calibration and validation were performed at single-stream gauge. For stations 795 time period of 1994– 2001 was used for calibration; the period of 2002 – 2006 was used for validation. Two years period of 1994-1996 was taken as the warm-up period. In this study, SWAT CUP is implemented for calibration and validation of the model.
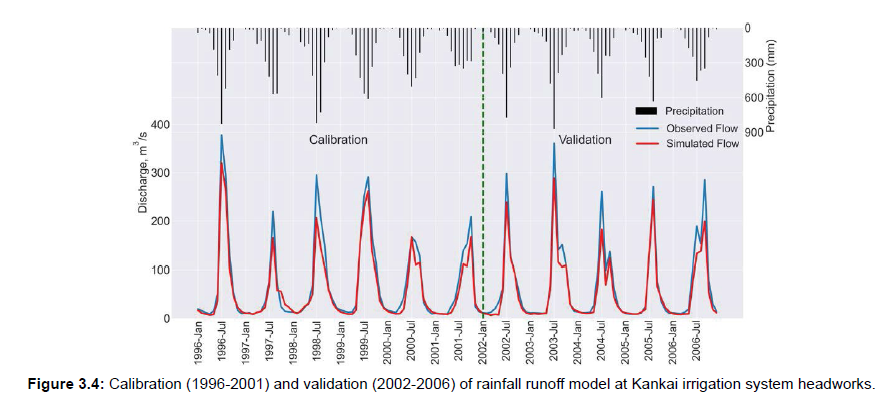
The calibration of the SWAT model for the runoff was done by using the monthly observed runoff data obtained at the outlet of the watershed during the period from 1996 to. The model was calibrated by using the parameter that was identified as highly sensitive to runoff as described in the above section. In the SUFI-2 algorithm, 500 simulations were performed in each iteration Figure 3.4.
The calibrated parameters were updated back into the SWAT model for the final simulation. Runoff simulated by the SWAT model was compared with their respective observed data. Figure 3.4 shows the graphical comparison of simulated v/s measured monthly runoff. From the graph, it was observed that the model simulated both high and low monthly runoff values similar to the observed values. It is observed from that the simulated value of runoff underestimates as compared to the field observed during the whole season.
The base flow was well predicted for both the calibration and validation periods, according to the results. The base flow's alphafactor (Alpha BF) is a crucial element for altering the base flow. Its value ranges from 0.1-0.3 for slow-responding land to 0.9-1.0 for fastresponding land, but the best estimates are obtained by evaluating observed stream flow during the watershed's no-recharge phase. SOL K (saturated hydraulic conductivity), which was calibrated for the model, is one of the sensitive parameters. The hydraulic gradient is related to the soil water flow rate and is defined by the ease with which water passes through the soil (flux density). The results also revealed that routing parameters like manning's n value (CH N2) are modeldependent.
II. Model validation for runoff
The calibrated parameters were kept the same and the model was run for the year 2002- 2006 with a monthly time step of calibration. The hydrograph below shows the comparison of observed flows with the simulated flows during the validation period. Like the calibration period, the model was successfully able to predict the flow pattern of the basin during the validation period also. The observed flows are shown with the solid blue line and the simulated flows are shown with the solid red line as shown in Figure 3.4.
From Figure 3.4 hydrograph it can be seen that the model has simulated the peak flows slightly higher than the calibration period though it has underestimated the low flows in some periods. NSE for the validated years was found to be 0.93. The PBIAS for the validation period was found to be -16.30 %.
III. Performance Evaluation
Nash-Sutcliffe Model performance was measured using efficiency (NSE) and coefficient of determination (R2). The Normalized Standard Error (NSE) is a normalized statistic that measures the magnitude of residual variance in relation to observed data variation (Nash and Sutcliffe, 1970). The NSE is a metric that compares how well the observed versus simulated data plot fits the 1:1 line [18].
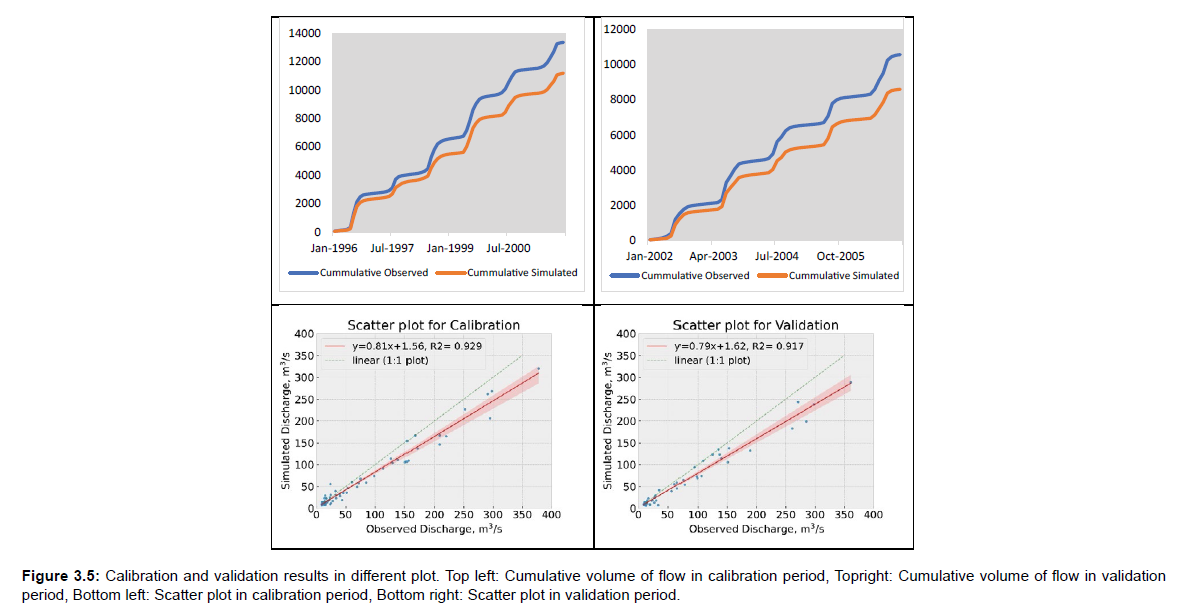
The SWAT model was tested to evaluate the performance of its predictability. The monthly calibration statistics results for behavioral parameters in SWAT-CUP for runoff is shown in Table 3.1. It is observed from the Table 3.1 that the calibration statistics NSE, PBIAS and R2 values between measured and simulated by the model were found to be 0.92, -18.70 and 0.97 respectively. It indicates that the model performance for monthly calibration was very good in terms of NSE and value, as NSE value being >0.75 as per the performance ratings of the hydrological model. And also, in terms of PBIAS value, the model performance was found to be good. The performance evaluation criteria suggest that the model is “very good” in calibration for watershed scale in stream flow [18].
Monthly runoff validation results from the SWAT-CUP are shown in Table 3.1. The validation results are also showed good performance, with NSE and values between observed and predicted values of the model, which were found to be 0.93 and 0.97 respectively. However, with respect to PBIAS, the value found -16.30, indicated that model performance was very good. By observing calibration and validation tables, the SlWAT model is satisfactory in simulating the runoff from the Kankai watershed. The performance evaluation criteria also suggest that the model is “very good” in validation for watershed scale in stream flow [18] (Figure 3.5).
| Station | Variable period | NSE | BIAS (%) | |
|---|---|---|---|---|
| 795 (Mainachuli) | (1996-2001) Calibration period | 0.92 | 0.97 | -18.70 |
| (2002-2006) Validation period | 0.93 | 0.96 | -16.30 |
Table 3.1: Statistical indicators of model performance during the calibration and validation period.
IV. Sensitivity analysis
The sensitivity analysis was done using a global sensitivity analysis. The effective hydraulic conductivity in the main channel (CH K2) had a bigger absolute value for t-stat (t=-37.56), according to the results of the global sensitivity analysis and simultaneously had minimum absolute value for p-value (p=0.00) and hence it was considered as the most sensitive parameter followed by curve number (CN2) (t=34.15, p=0.00), Base flow recession constant (ALPHA_BF ) (t=31.97, p=0.00), Lateral flow travel time (LAT_TTIME) (t=-21.87, p=0.00) and Available water storage capacity of the soil layer (SOL_AWC()) (t=- 10.02, p=0.00) ranking up to fifth position. CH_N1 (t=-0.34, p=0.73), SMFMX (t=-0.51, p=0.61), SMFMX (t=0.51, p=0.60) and Precipitation lapse rate (PLAPS) (t=-0.86, p=0.38) were found to be least sensitive parameters. It is clear from the outcomes that, these sensitive parameters have important role in representing runoff, channel routing and evapotranspiration losses from the watershed.
Impact of climate change on stream flow
The consequences of climate change impact are reflected in future stream flow. The future stream flow was projected using calibrated SWAT model and projected precipitation and temperature. The future stream flow was projected in three different future periods under spp245 and ssp585 scenarios. The projected base flow in the different future periods under ssp245 and ssp585 scenarios with baseline base flow are shown in Figure 3.6. The pattern of base flow is quite similar to the baseline period base flow of the river.
The base flow in all future periods under both scenarios is decreased in the first three months with respect to baseline flow. The decreased in base flow is due to an increase in both maximum and minimum temperature in such a period. The highest decreased in base flow was occurred in June month followed by May and April. The average monthly base flow could decrease by around 46% in the near future, 25% in the mid future and 17% in the far future under the ssp585 scenario as compared to baseline flow. Whereas under the ssp245 scenario, the average monthly base flow could decrease by around 67% in near future and 63% in the MF and FF with respect to baseline base flow. The base flow could increase significantly as compared to baseline base flow in July, August and September months under both ssp245 and ssp585 scenarios. The annual average base flow under ssp245 scenario is increased by 19% in near future, 32% in mid future and 36% in far future. Whereas, the annual average base flow under ssp245 in near future is decreased by 13% and increase by 11% & 36% in MF and FF respectively.
[19-22] studied on future water availability on Babai River basin, Nepal and found that the effect of climate change was studied using three general circulation models for the decades 2020–2044, 2045–2069, and 2070–2099, respectively, under two representative concentration paths (RCPs 4.5 and 8.5). According to the findings, the watershed will likely see an increase in rainfall and temperature in the future. The annual river flow reflects the impact of increased rainfall and rising temperatures. In comparison to historical data from 1991 to 2014, this is expected to rise by 24–37 percent.
But in the case of Kankai river basin, future base flow of river was estimated using ssp245 and ssp585 scenarios. Under ssp245 scenario, the base flow is increased by 19%, 32% and 36% in near, mid and far future respectively. While considering ssp585 scenario, the base flow in near future is decreased by 13 % and increased by 11% and 36% in mid and far future respectively.
Projection of future crop water requirement
Presently Kankai irrigation commands 7000 hectares of the Jhapa district. Generally, crops are growing in the monsoon, spring and winter seasons. It includes 6394 ha monsoon rice, 844 ha wheat, 1103 ha maize, 539 ha potato, 647 ha mustard, 396 ha vegetable, 126 ha pulses and 2025 ha spring rice. Three time zones separate the future period (NF, MF and FF) and crop water requirement of all crops are computed individually for each year under different scenarios. The projected meteorological data of station 1421 (Gaida station) is used for computing future CWR and IWR in the Kankai command area
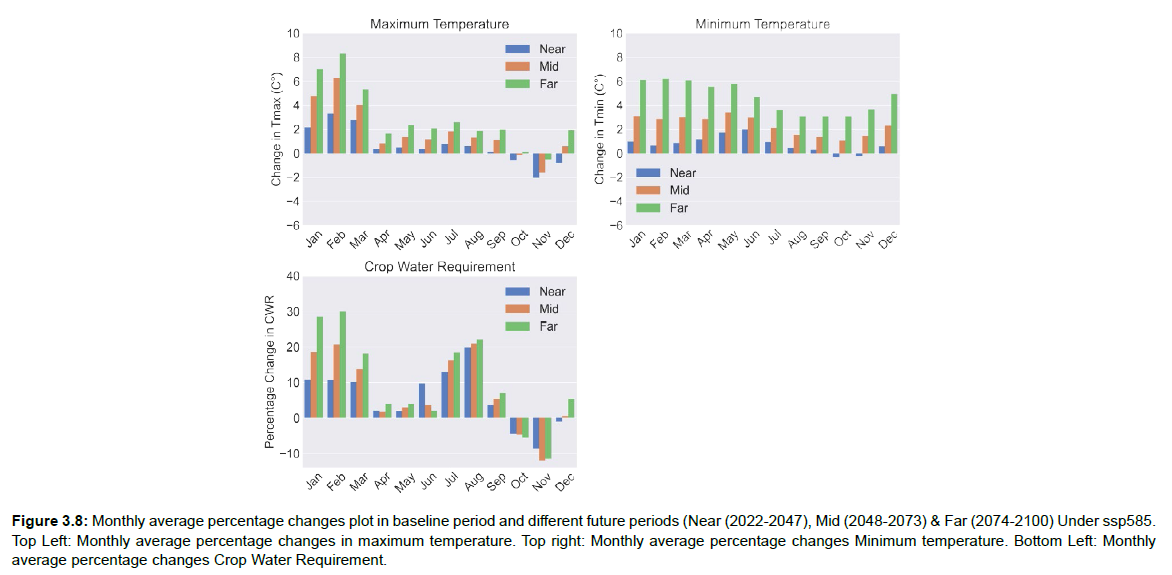
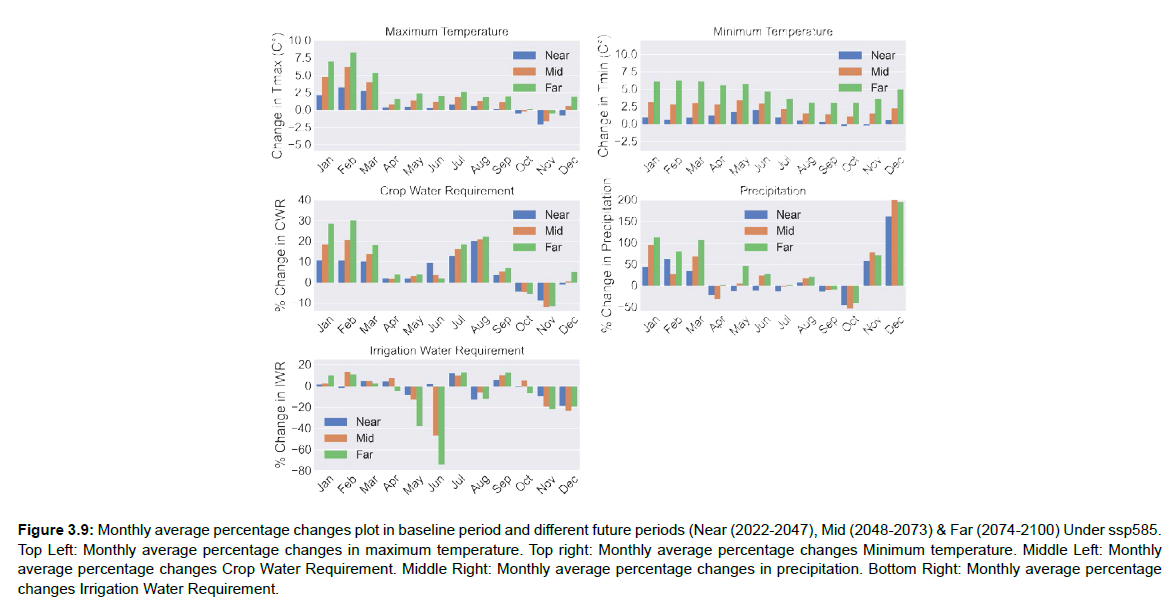
The projected crop water requirement in the NF, MF and FF under ssp585 scenarios is illustrated in Figure 3.7 . The crop water requirement in the first three months is increased towards different future periods. The increase in crop water requirement under ssp585 in the first three months is higher as compared to other months because the minimum and maximum temperatures of Kankai command area under ssp585 in the first three months toward future periods are increased significantly. The increase in maximum and minimum temperature leads in to increase in evapotranspiration which results to increase in crop water requirement.
The crop water requirement toward the future period is increased for all months except for October and November. The percentage change in crop water requirement is highly increased for the first three months (January, February and March) as compared to other months because the percentage increase in maximum and minimum temperature of Kankai command area is higher during those months.
The crop water requirement in the far future is increasing up to 30.05% in February month and decreasing up to -11.43% in November month. From the analysis, it shows that crop water requirement in the NF, MF and FF is increased because the maximum and minimum temperatures are also increasing in the order in near; mid and far future (Figure 3.8).
Figure 3.8: Monthly average percentage changes plot in baseline period and different future periods (Near (2022-2047), Mid (2048-2073) & Far (2074-2100) Under ssp585. Top Left: Monthly average percentage changes in maximum temperature. Top right: Monthly average percentage changes Minimum temperature. Bottom Left: Monthly average percentage changes Crop Water Requirement.
Projection of future irrigation water requirement
The present irrigation water demand of KIS has been computed for the current cropping intensity of 170% in the total irrigated area. We considered the scheme efficiency to be at 40% and the IWD calculation for the different future periods was carried out to maintain a cropping intensity of around 240% and 300% (as per the target of the KIS by 2026) in the total area.
The monthly change in maximum temperature, minimum temperature, percentage change in crop water requirement, percentage change in precipitation and percentage change in irrigation water requirement is presented in Figure 3.9. The irrigation water demand is decreased toward future period under ssp585 scenario in five months namely; May, June, August, November and December months. But crop water requirement is increased in May, June and August months towards different future period.
Figure 3.9: Monthly average percentage changes plot in baseline period and different future periods (Near (2022-2047), Mid (2048-2073) & Far (2074-2100) Under ssp585. Top Left: Monthly average percentage changes in maximum temperature. Top right: Monthly average percentage changes Minimum temperature. Middle Left: Monthly average percentage changes Crop Water Requirement. Middle Right: Monthly average percentage changes in precipitation. Bottom Right: Monthly average percentage changes Irrigation Water Requirement.
The increased in crop water requirement is fully meet by increased precipitation. The irrigation water requirement is highly dependent on effective rainfall. The decreased in irrigation water demand is due to increase in effective rainfall in such months. Whereas, irrigation water demand is increased in six months namely; January, February, March, April, July and September months. The crop water requirement during those months also increased. But, precipitation in first three months also increased. The increased in precipitation could not meet the increased crop water requirement. Therefore, irrigation water demand is also increased.
A total of 19 sub-scenarios were constructed based on cropping intensities of 170 percent, 240 percent and 300 percent under ssp245 and ssp585 scenarios with a scheme efficiency of 40 percent. Table 3.2 shows the IWD for each sub-scenario over 12 months periods. The highest irrigation water demand is occurred in March month under ssp585 and CI 300%. Whereas, August month have lowest irrigation water demand under all sub scenario.
| Sub-Scenarios | Jan | Feb | Mar | Apr | May | Jun | Jul | Aug | Sep | Oct | Nov | Dec |
|---|---|---|---|---|---|---|---|---|---|---|---|---|
| Current-CI=1.7 | 2.5 | 4.0 | 14.0 | 8.4 | 3.7 | 0.8 | 6.9 | 1.3 | 3.0 | 6.5 | 2.8 | 1.6 |
| ssp245-NF-CI=1.7 | 2.7 | 4.9 | 15.4 | 8.4 | 2.9 | 0.2 | 7.2 | 0.0 | 0.1 | 7.1 | 2.4 | 1.4 |
| ssp245-NF-CI=2.4 | 4.3 | 6.7 | 23.9 | 14.2 | 6.2 | 1.3 | 11.7 | 2.2 | 5.1 | 11.1 | 4.8 | 2.7 |
| ssp245-NF-CI=3.0 | 5.8 | 9.1 | 32.3 | 19.3 | 8.4 | 1.8 | 15.9 | 2.9 | 6.9 | 15.0 | 6.5 | 3.6 |
| ssp585-NF-CI=1.7 | 3.0 | 5.0 | 16.0 | 8.4 | 3.7 | 0.8 | 6.9 | 1.3 | 3.0 | 6.5 | 2.8 | 1.6 |
| ssp585-NF-CI=2.4 | 5.1 | 8.4 | 27.3 | 14.2 | 6.2 | 1.3 | 11.7 | 2.2 | 5.1 | 11.1 | 4.8 | 2.7 |
| ssp585-NF-CI=3.0 | 6.9 | 11.4 | 36.9 | 19.3 | 8.4 | 1.8 | 15.9 | 2.9 | 6.9 | 15.0 | 6.5 | 3.6 |
| ssp245-MF-CI=1.7 | 2.9 | 4.6 | 15.6 | 8.0 | 2.6 | 0.1 | 7.2 | 0.0 | 0.3 | 7.4 | 2.4 | 1.3 |
| ssp245-MF-CI=2.4 | 4.6 | 8.3 | 26.2 | 14.3 | 5.0 | 0.4 | 12.2 | 0.0 | 0.1 | 12.1 | 4.0 | 2.3 |
| ssp245-MF-CI=3.0 | 6.2 | 11.2 | 35.5 | 19.4 | 6.7 | 0.5 | 16.6 | 0.0 | 0.2 | 16.4 | 5.4 | 3.2 |
| ssp585-MF-CI=1.7 | 3.0 | 5.7 | 16.1 | 8.6 | 3.5 | 0.4 | 6.8 | 1.4 | 3.2 | 6.9 | 2.5 | 1.5 |
| ssp585-MF-CI=2.4 | 5.2 | 9.7 | 27.3 | 14.7 | 5.9 | 0.7 | 11.5 | 2.3 | 5.4 | 11.7 | 4.3 | 2.5 |
| ssp585-MF-CI=3.0 | 7.0 | 13.1 | 36.9 | 19.8 | 8.0 | 0.9 | 15.6 | 3.2 | 7.3 | 15.9 | 5.8 | 3.4 |
| ssp245-FF-CI=1.7 | 3.1 | 5.4 | 15.9 | 7.0 | 2.6 | 0.0 | 7.2 | 0.0 | 0.8 | 7.2 | 2.3 | 1.4 |
| ssp245-FF-CI=2.4 | 4.9 | 7.8 | 26.5 | 13.5 | 4.5 | 0.2 | 12.2 | 0.0 | 0.5 | 12.6 | 4.1 | 2.2 |
| ssp245-FF-CI=3.0 | 6.6 | 10.6 | 35.8 | 18.3 | 6.1 | 0.3 | 16.6 | 0.0 | 0.6 | 17.1 | 5.6 | 3.0 |
| ssp585-FF-CI=1.7 | 3.3 | 5.6 | 15.7 | 7.7 | 2.5 | 0.2 | 7.0 | 1.3 | 3.2 | 6.1 | 2.4 | 1.6 |
| ssp585-FF-CI=2.4 | 5.5 | 9.5 | 26.7 | 13.0 | 4.2 | 0.3 | 11.8 | 2.2 | 5.5 | 10.4 | 4.1 | 2.6 |
| ssp585-FF-CI=3.0 | 7.5 | 12.9 | 36.1 | 17.6 | 5.7 | 0.4 | 16.0 | 2.9 | 7.4 | 14.1 | 5.6 | 3.6 |
Table 3.2: IWD of Kankai irrigation command area under different sub scenarios in ( m3/s).
Irrigation demand and available river flow in different future period under ssp585
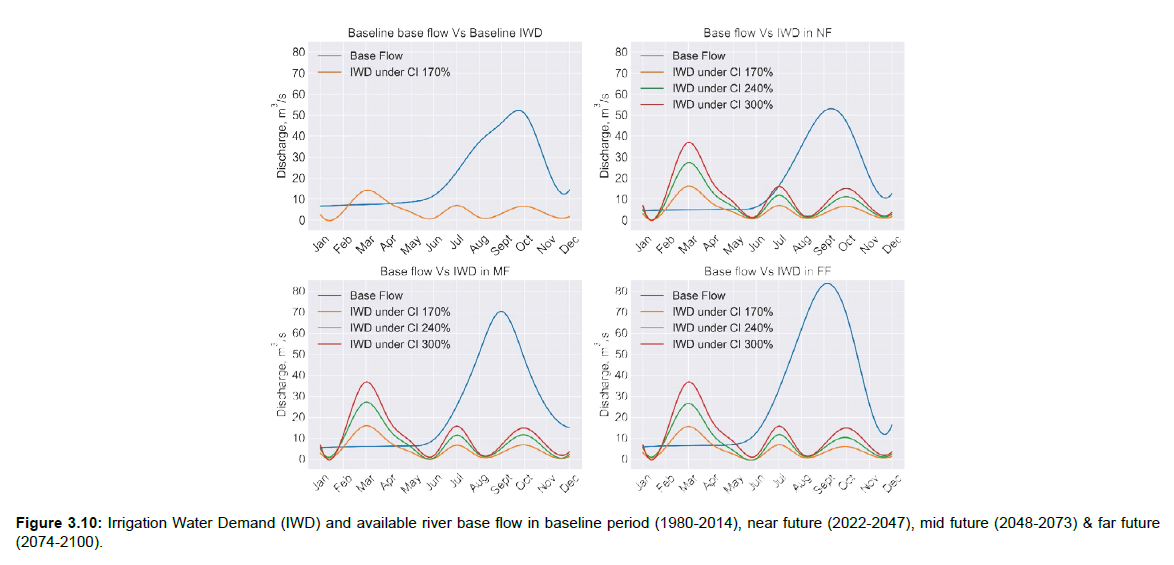
The future water availability of the Kankai River is estimated using SWAT CUP by providing the calibrated parameter of the rainfall-runoff SWAT model and projected climatic variable. The monthly river flow from 2022 to 2100 was determined, and the future period is divided into the three-time zone; namely near (2022-2047), mid (2048-2073), and far (2074-2100) future. The time series monthly flow is converted into the average monthly flow of three future periods. The base flow is very much important in the case of irrigation water demand. Therefore, the separation of the base flow of the monthly average flow of different future periods was carried out (Figure 3.10).
The comparison of baseline IWD , future IWD and future river flow under different scenarios and sub scenarios is represented in Figure 3.10. The top left Figure 3.10 represents the baseline irrigation water demand of the Kankai irrigation system versus the baseline baseflow of the Kankai river. Under cropping intensity 170 % i.e, present cropping intensity, the available baseflow of the river is not sufficient to meet the irrigation water demand in two monthly namely; February and March.
In the case of the near future, a water deficit is seen in four months namely; February, March, April and March under cropping intensity 300% and ssp585 scenario. The maximum water deficit is seen in March month (around 30 ) followed by April, February and May months. But if the present cropping intensity exists in near future then water shortage problems are only seen in three months of the year: from February to April.
For the mid-future, the highest water deficit is expected under ssp585 and cropping intensity 300%. Under the present cropping pattern and ssp585 scenario, water deficit occurs in three months of the year from February to April and the highest water shortage problems are seen in March month. While considering cropping intensity 300% and ssp585 scenario, water could be scarcer for four months of the year: from February to May and the maximum deficit is seen in March month.
The pattern of irrigation water demand in the far future is quite similar to that of the near and mid future. But due to the variation in available river water, the magnitude of deficit water is varied in the far future as compared to the near and mid future. The maximum water deficit also occurs under ssp585 and cropping intensity 300% in the far future. Under cropping intensity 300% and ssp585 scenario, water deficit occurs in four months of the year: from February to May.
[19] studied on Impacts of Climate Change on Irrigation Water Management in the Babai River Basin, Nepal and found that water demand in the Babai River Basin will rise in the future as agricultural patterns change. May is projected to have the most shortages, followed by April, February, March, and January. As a result, all of these findings suggest that the water in the Babai River is insufficient now and, in the future, to provide the year-round irrigation system and maintain a healthy ecosystem.
In the future, the Kankai river basin is a water deficit basin in four months namely: from February to May based on the worst scenario and maximum deficit occurs in May month. But as predicted by [19], a water deficit occurs in six months in the Babai river basin and May is projected to have the most shortages. Both results show that May month is more vulnerable to climate change.
Conclusion
A study has been carried out to assess the effect of climate change on the future river flow of the Kankai River and the future irrigation water requirements of the Kankai command area. This study quantified the effect of climate change on future water availability and irrigation water demand of KIS under different sub scenarios. The following is a summary of the key findings:
a. According to the findings, ACCESS-ESM1-5, MPI-ESM1- 2-LR, BCC-CSM2-MR and NorESM2-MM are the best models for forecasting precipitation events. Similarly, INM-CM4-8, NorESM2- MM and INM-CM5-0 are the models with generally higher ratings for the maximum temperature. While, NorESM2-MM, day_EC-Earth3 and MPI-ESM1-2-HR are the models useful for assessing future minimum temperature of Kankai River Basin and surrounding basins having similar meteorological characteristics.
b. Based on the average of combined ratings of all metrics at all selected stations using 13 bias correction methods on a pool of 4 GCMs, the best performing bias correction method for precipitation was as Bernoulli Weibull method. Likewise, both maximum temperature and minimum temperature were bias-corrected by nine methods, and selection of the best bias correction method was done by using performance rating of past data. Based on the average of combined ratings of all metrics at all selected stations using 9 bias correction methods on a pool of 3 GCMs, the best performing bias correction method for both maximum and minimum temperature was selected as the Linear Transformation method.
c. With ssp245 and ssp585, the estimate showed that there will be a significant increase in both maximum and lowest temperatures in the future. In the maximum and minimum temperature cases, the rise in future temperature with ssp585 was much higher than with ssp245. Both ssp585 and ssp245, the results showed, are anticipated to enhance both seasonal and annual precipitation. In comparison to ssp245, the expected increase for ssp585 was slightly larger.
d. Under the ssp245 scenario, the maximum temperature is increased by 0.72°C, 1.47°C and 1.83°C in the near, mid and far future respectively. On the other hands, the maximum temperature could be increased by 0.89°C, 1.99°C and 3.28°C in the NF, MF and FF respectively while considering the ssp585 scenario.
e. Similarly, the minimum temperature could be increased by 0.91°C, 1.73°C and 2.26°C in the near, mid and far future respectively while considering the ssp245 scenario. Whereas, the minimum temperature is increased by 0.98°C, 2.44°C and 4.55°C in the NF, MF and FF respectively under the ssp245 scenario.
f. The projected precipitation results reveal that the level of uncertainty rises with the passage of time. The projected precipitation in near future is decreased up to 7.43 %. Whereas, the precipitation is increased up to 14.68 % in the MF and FF under both scenarios.
g. For the Kankai River Basin, the SWAT model was calibrated and validated. The model performed well in monthly calibration, with R2 of 0.91, NSE of 0.92, and PBIAS of -18.70 percent in the calibration period and R2 of 0.92, NSE of 0.93, and PBIAS of -16.30 percent in the validation period.
h. According to the findings, the Kankai basin will likely see an increase in rainfall and temperature in the future. The impact of increased rainfall and rise in temperature is reflected in yearly river flow, which is expected to increase by 11.65–36.74 % when compared to historical data from 1980 to 2014.
i. Based on the foregoing findings and analysis, it is predicted that precipitation will increase in the study area for a certain period of time and then decreased, while mean minimum and maximum temperatures will rise in the future. As a result, the demand for crop water is expected to rise in the future.
j. The crop water requirement toward the future period is increased for all months except for October and November. The percentage change in crop water requirement is highly increased for the first three months (January, February and March) as compared to other months because the percentage increase in maximum and minimum temperature of Kankai command area is higher during those months.
k. The highest water deficit is expected under ssp585 and cropping intensity 300 % in future periods. Under the present cropping pattern and ssp585 scenario, water deficit occurs in three months of the year from February to April and the highest water shortage problems are seen in March month. While considering cropping intensity 300 % and ssp585 scenario, water could be scarcer for four months of the year: from February to May and the maximum deficit is seen in March month.
l. The irrigation water demand is decreased toward future period under ssp585 scenario in five months namely; May, June, August, November and December months. But crop water requirement is increased in May, June and August months towards different future period. The increased in crop water requirement is fully meet by increased precipitation. Whereas, irrigation water demand is increased in six months namely; January, February, March, April, July and September months.
m. A total of 19 sub-scenarios were constructed based on cropping intensities of 170 percent, 240 percent and 300 percent under ssp245 and ssp585 scenarios with a scheme efficiency of 40 percent and IWD for each sub-scenario over 12 months periods was estimated. The highest irrigation water demand is occurred in March month under ssp585 and CI 300%. Whereas, August month have lowest irrigation water demand under all sub scenario.
Recommendation
Based on study results
The following policy implications are provided based on the findings of the study.
a. The anticipated increase in temperature, change in precipitation pattern and change in river flows in the future should be viewed as an opportunity for Nepal's relevant ministries, departments, and agencies to plan and manage the basin's water resources.
b. Under all scenarios and sub scenarios, water could be scarce for four months of the year: from February to May. The maximum shortage is expected in March, followed by April, February and May. As a result, all of these findings suggest that the water in the Kankai River is insufficient in the future to provide a year-round irrigation system. Alternative water sources are critical and must be implemented as soon as possible.
c. This research can be useful for formulating further alternative source of water like investigation of ground water resources to meet full demand of Kankai irrigation system in future periods.
d. This study advocate producing less water-demanding crops such as wheat and maize instead of rice until alternate water sources can be managed.
For future research
The following suggestions are given for future investigation.
a. Land use land cover change could be incorporated for projection of future stream flow pattern of Kankai River.
b. The crop coefficient and yield coefficient changes could be considered for estimating future irrigation water demand of Kankai irrigation command area.
c. This research can be useful for evaluating different future drought in Kankai river basin like agricultural drought, meteorological drought and hydrological drought etc.
References
- Abbaspour KC, Faramarzi M, Ghasemi SS, Yang H (2009) Assessing the impact of climate change on water resources in Iran. Water Resour Res 45: 1-16.
- Agarwal A, Babel MS, Maskey S (2014) Analysis of future precipitation in the Koshi river basin, Nepal. J Hydrol Reg 513: 422-434.
- Behera S, Khare D, Mishra PK, Sahoo S (2016) Impact of Climate Change on Cropwater Requirement for Sunei Medium Irrigation Project, Odisha, India. Int J Eng Trends Technol 34: 358-367.
- Bharati L, Gurung P, Maharjan L, Bhattarai U (2016) Past and future variability in the hydrological regime of the Koshi Basin, Nepal. Hydrol Sci J 61: 79-93.
- Bharati L, Gurung P, Jayakody P, Smakhtin V (2014) The Projected Impact of Climate Change on Water Availability and Development in the Koshi Basin, Nepal. Mt Res Dev 34: 118-130.
- Dahal V, Shakya NM, Bhattarai R (2016) Estimating the Impact of Climate Change on Water Availability in Bagmati Basin, Nepal. Environ Process 3: 1-17.
- Ghimire U, Srinivasan G, Agarwal A (2019) Assessment of rainfall bias correction techniques for improved hydrological simulation. Int J Climatol 39: 2386-2399.
- IPCC (2013) IPCC CLIMATE CHANGE 2013 Climate Change 2013.
- IPCC (2014a) Climate Change 2014: Synthesis Report. Contribution of Working Groups I, II and III to the Fifth Assessment Report of the Intergovernmental Panel on Climate Change. EPIC awi de.
- Field C (2014b) Impacts, Adaptation, and Vulnerability. Part A: Global and Sectoral Aspects. Contribution of Working Group II to the Fifth Assessment Report of the Intergovernmental Panel on Climate Change. Environ Sci.
- Kaini S, Nepal S, Pradhananga S, Gardner T (2020) Representative general circulation models selection and downscaling of climate data for the transboundary Koshi river basin in China and Nepal. Int J Climatol 40: 4131-4149.
- Khadka A, Devkota LP, Kayastha RB (2016) Impact of Climate Change on the Snow Hydrology of Koshi River Basin. J Hydrol 9: 28-44.
- Khadka D, Babel MS, Shrestha S, Tripathi, NK (2014) Climate change impact on glacier and snow melt and runoff in Tamakoshi basin in the Hindu Kush Himalayan (HKH) region. J Hydrol 511: 49-60.
- Mishra Y, Babel MS, Nakamura T, Mishra B (2021) Impacts of climate change on irrigation water management in the babai river basin, Nepal. Hydrol 8:1-20.
- Moriasi DN, Arnold JG, Liew MW, Bingner RL (2007) Model Evaluation Guidelines for Systematic Quantification of Accuracy in Watershed Simulations. Trans ASABE 50: 885-900.
- Parry ML, Rosenzweig C, Iglesias A, Livermore M (2004) Effects of climate change on global food production under SRES emissions and socio-economic scenarios. Glob Environ Change 14: 53-67.
- Pradhan P, Shrestha S, Sundaram SM, Virdis SGP (2021) Evaluation of the CMIP5 general circulation models for simulating the precipitation and temperature of the Koshi River Basin in Nepal. J Water Clim Chang 12: 3282-3296.
- Riahi K, van Vuuren DP, Kriegler E, Edmonds J (2017) The Shared Socioeconomic Pathways and their energy, land use, and greenhouse gas emissions implications: An overview. Glob Environ Change 42: 153-168.
- S, M, N, R (2014) Climate Change and its Impact on Irrigation Water Requirements on Temporal Scale. Irrigat Drainage Sys Eng 03: 1-8.
- Shrestha AB, Aryal R (2011) Climate change in Nepal and its impact on Himalayan glaciers. Reg Environ Change 11: 65-77.
- Shrestha S, Htut AY (2016) Modelling the potential impacts of climate change on hydrology of the Bago River Basin, Myanmar. Int J River Basin Manag 14: 287-297.
- Versini PA, Pouget L, McEnnis S, Custodio E (2016) Climate change impact on water resources availability: case study of the Llobregat River basin (Spain). Hydrol Sci J 61: 2496-2508.
Indexed at, Google Scholar, Crossref
Indexed at, Google Scholar, Crossref
Indexed at, Google Scholar, Crossref
Indexed at, Google Scholar, Crossref
Indexed at, Google Scholar, Crossref
Indexed at, Google Scholar, Crossref
Indexed at, Google Scholar, Crossref
Indexed at, Google Scholar, Crossref
Indexed at, Google Scholar, Crossref
Indexed at, Google Scholar, Crossref
Indexed at, Google Scholar, Crossref
Indexed at, Google Scholar, Crossref
Indexed at, Google Scholar, Crossref
Indexed at, Google Scholar, Crossref
Indexed at, Google Scholar, Crossref
Indexed at, Google Scholar, Crossref
Indexed at, Google Scholar, Crossref
Indexed at, Google Scholar, Crossref
Citation: Lamichhane M, Mishra Y, Bhattarai P (2022) Assessment of Future Water Availability and Irrigation Water Demand under Climate Change in the Kankai River Basin, Nepal. J Earth Sci Clim Change, 13: 639. DOI: 10.4172/2157-7617.1000639
Copyright: © 2022 Lamichhane M, et al. This is an open-access article distributed under the terms of the Creative Commons Attribution License, which permits unrestricted use, distribution, and reproduction in any medium, provided the original author and source are credited.
Share This Article
Recommended Journals
Open Access Journals
Article Tools
Article Usage
- Total views: 2382
- [From(publication date): 0-2022 - Apr 06, 2025]
- Breakdown by view type
- HTML page views: 1998
- PDF downloads: 384

