Research Article Open Access
Assessing the Impact of Temperature and Chlorophyll Variations on the Fluctuations of Sardine Abundance in Al-Hoceima (South Alboran Sea)
Abdellaoui B1*, Berraho A1, Falcini F2, Santoleri JR2, Sammartino M2, Pisano A2, Idrissi MH1 and Hilm K11National Institute for Fisheries Research, Oceanography Department, Casablanca, Morocco
2Institute of Atmosphere and Climate Sciences, National Research Council, Roma, Italy
- Corresponding Author:
- Abdellaoui B
National Institute for Fisheries Research
Oceanography Department, Casablanca, Morocco
Tel: 05 22940773
E-mail: Byounes2011@gmail.com
Received Date: June 09, 2017; Accepted Date: September 21, 2017; Published Date: September 25, 2017
Citation: Abdellaoui B, Berraho A, Falcini F, Santoleri JR, Sammartino M, et al. (2017) Assessing the Impact of Temperature and Chlorophyll Variations on the Fluctuations of Sardine Abundance in Al-Hoceima (South Alboran Sea). J Marine Sci Res Dev 7:239. doi: 10.4172/2155-9910.1000239
Copyright: © 2017 Abdellaoui B, et al. This is an open-access article distributed under the terms of the Creative Commons Attribution License, which permits unrestricted use, distribution, and reproduction in any medium, provided the original author and source are credited.
Visit for more related articles at Journal of Marine Science: Research & Development
Abstract
Landings of small pelagic fish in Moroccan Mediterranean Sea show large fluctuations and trends, a fact that has a considerable socio-economic impact. These changes are often related to the impact of the environmental conditions on recruitment processes. We investigate fluctuations of the sardine’s abundance at one of the most important fishing areas of the Moroccan Mediterranean Sea (i.e., Al-Hoceima region) and try to assess the impact of environmental changes on the availability of pelagic fish in this area. In these regards, we analyzed Seasonal and Trends Loess’ (STL) decomposition of time series between 2008 and 2015 of catch-per-unit-effort (CPUE) data along with environmental parameters (i.e., sea surface temperature and chlorophyll-a) from remote sensing and we applied nonlinear models (GAM). Results show an inverse relationship between fluctuations of sardine CPUE and sea surface temperature. Nonlinear relationships confirm that the temperature is the most important parameter affecting abundance, whereas chlorophyll-a, is generally, weakly correlated to the CPUE data at monthly and seasonal level variations, except for annual trends. The analysis also shows positive trend of chlorophyll-a, from 2003 and a negative one starting from 2011, revealing an inter-annual variability that support fish landings fluctuations. Modeling based on the relationships between the CPUE and temperature/chlorophyll-a, allowed better prediction of the sardine abundance in the Al-Hoceima fishing area (South Alboran Sea).
Keywords
Sardine; CPUE; Time series; Environmental parameters; Trends; Modeling; GAM
Introduction
Environmental conditions play an important role on marine species, especially small pelagic fishes. Temperature, salinity, biomass, and hydrodynamic conditions are the main parameters that affect development and spatial distribution of these species by controlling maturation, spawning conditions, and dispersal of eggs and larvae [1-9].
The impact of these environmental conditions is very pronounced at the planktonic stages (eggs and larvae) and it can potentially influence the local abundance of adult populations. Associated with changes in hydro-meteorological characteristics as drought and rainfall [10], the marine environmental conditions can cause large changes on fish distribution at very short time scales, with significant implications on fishing abundance [11-15].
In the Mediterranean Moroccan Sea, small pelagic fishes are exploited by 20% of the fleet vessels operating in this area. The most important landings ports are Nador, Al Hoceima, and M’diq [16,17]. The species caught are often sardine (Sardina pichardus), anchovy (engraulis encrasicolus), and mackerel (Scomber colias). Sardines and anchovies are the main targets of the vessels using purse seine two, up to threetimes overnight. The annual production of sardines, recorded between 2000 and 2009, has decreased from 25,000 to 10,000 tons [17,18]. Data analysis of the long catch time series of these species highlights a significant fluctuation, which often linked to environmental conditions [19,20]. These fluctuations are probably a consequence of recruitment variability, particularly difficult for these species with a short life cycle (3 to 5 years), which can influence the size of the population from one year to another. Small pelagic fishes (e.g. sardine) are known by an r-type life strategy (high-speed multiplication populations), characterized by high fecundity and fractional spawning (spawning batch) over a long period. The influence of environmental parameters is considerable on the behavior of these species and their reproductive strategies [7,21,22]. Berraho (2007) [23] shows that sardines seek the most favorable environmental conditions to limit losses during the main spawning period. However, at secondary period, eggs and larvae are randomly dispersed in space and time. The study of gonado- somatic index over several years of Moroccan Mediterranean sardines, show that the maximum emission period moves between January and March [18]. In fact, this plasticity in reproductive characteristics of the adults combined to the variability of marine environment conditions generates the inter-annual fluctuation of sardine stocks [24-26]. Two periods can be districted on Sardine life cycle: the first corresponds to the larval and juvenile stage and the second is mainly the adult phase. The requirements of environmental parameters seem to be more important at the main spawning period. A change in the water temperature, during that time, can have a negative impact on both spawning performance and chance of survival of eggs and larvae [27,28].
Recently, multidisciplinary studies are seeking to define diagnostic tools for linking the dots among catches, chloro-phytoplanktonic datasets, physical and bio-geochemical oceanographic measurements, and ocean modeling [9,29]. The main goal of these efforts was the understanding of the inter-annual variability of biomass in fish species, related to environmental condition. Many studies were realized on the Northern Alboran Sea [15,30-33], but very few of them have been carried out on the southern part. We here recognize and analyze fluctuations of sardine’s abundance at one of the most important fishing area in the Moroccan Mediterranean Sea, i.e., the “Al-Hoceima” marine ecosystem, in order to understand and to assess the impact of marine environmental changes on the availability of pelagic fishes, especially sardines, in this area.
Materials and Methods
Study area
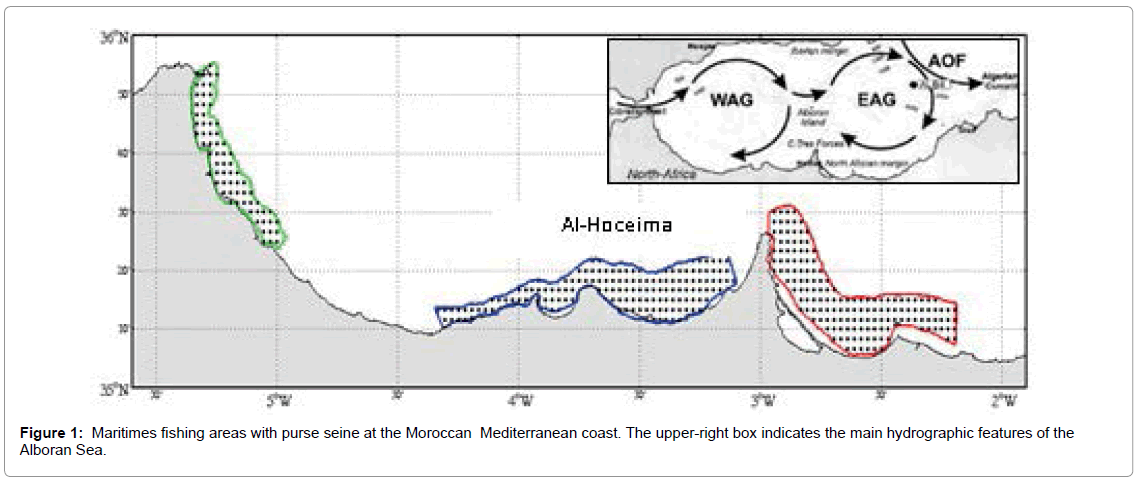
Al-Hoceima is one of the most important fishing areas of the Moroccan Mediterranean Sea where sardines are concentrated in three main areas: M’diq, Nador and Al Hoceima. This area is located in the Alboran Sea, and affected by the Western Anticyclonic Gyre (WAG), which results from the exchange of water mass between the Mediterranean basin and the Atlantic Ocean through the strait of Gibraltar. Indeed, the Atlantic jet (AJ) feeds the WAG by means of a meandering structure of ~ 100-150 km of diameter and, occasionally, defines the Eastern Anticyclonic Gyre (EAG) as well (Figure 1). This dynamic and complex system is regulated by the interaction of local and regional processes [30,32].
Fisheries data and CPUE
The abundance of fish stock is an important part of information required for fisheries management. Catch-per-unit-effort (CPUE) data of fisheries have traditionally been used to measure changes in relative abundance and it is often the main source of information used in fisheries for stock assessment. CPUE is generally assumed to be proportional to abundance and it expresses the performance of each fishing unit and resource availability, based on the catch (biomass) and unit effort (fishing time / space / gear type, etc.) [34-36].
Time records (January 2008 - December 2014) of daily catch and effort at Al Hoceima port were obtained from the National Fisheries Officer (ONP) through the MAIA statistics information system. The CPUE was then calculated by using a fundamental relationship between the catch and fishing effort [37] :
Ct = q EtNt (1)
Where Ct , Et , and Nt are the catch, the effort, and the abundance at a given time t; q is the part of stock that was captured per unit effort (often called the saturability coefficient). This equation can be rearranged to establish the proportional relationship between CPUE and abundance:
CPUE = Ct / Et = q Nt (2)
In practice, q is usually considered as a constant. However, it may vary depending on many factors, such as the efficiency of the fleet, the marine environment, the dynamics of the fleet, and fishing [37]. Therefore, CPUE is calculated for a defined period (e.g., year or month) or a space (km2 fishing ground), so that conditions (i.e., q) can be assumed constant (Maunder and Punt, 2004).
In our case, the CPUE is used to describe the abundance of the sardine stock, or the yield of the fishery, assuming that fishing was operating under homogeneous conditions and the CPUE depends only on the effort (Et) witch was indicated in its conceptual form as the “number of days spent in the sea” (24-hour periods, reckoned from midnight to midnight) on which any fishing took place of a single boat.
CPUExt = Cxt / Ext (3)
CPUExt = catch per unit of effort for vessel x at time t (month or year)
Cxt = catch of vessel n at time t (month or year)
Ext = effort calculated as number of fishing days at sea for vessel x at time t (month or year).
Environmental data
Monthly sea surface temperature (SST) and chlorophyll-a (Chl) concentrations were derived from satellite data of MODIS (Moderate Resolution Imagine Spector-radiometer) / Aqua sensor of 4 km spatial resolution, during the same period in which catch and effort were obtained (January 2008 - December 2014). These data are available on the NASA Internet servers Ocean Color Web. MODIS images were then imported to ArcGIS and transformed from ASCI data to raster on which each pixel of 4 km2 has his own value. The monthly average value of data series considered was calculated by overlying pixels data on polygon corresponding to the fishing area of Al-Hoceima of these two variables.
Time series analysis and modeling approach
To recognize fluctuations and interactions with environmental conditions, we applied a Seasonal and Trends Loess (STL) decomposition analysis, for the time series 2008-2014, to both CPUE data and environmental parameters (i.e., SST and Chl-a) derived from satellite images [38-42].
The principal series (Xt) is divided into different fundamental components: the trend or global trend (Zt) component, which represents the long-term evolution of the series, the seasonal component (St) regular and periodic at intervals of time, and the residual component which represents the noise (ἐt) with irregular fluctuations, generally having low intensity but random frequency:
Xt = Zt + St + ἐt 1 ≤ t ≤ n (4)
The STL decomposition analysis was based on the smoothing values on periodic windows of 12 months for global trends (trend), and 6 months for seasonal trends. The residual values are then extracted for each month based on the difference between values of global and seasonal trends [42-45].
Fishing abundance was correlated with SST and Chl-a. First, a simple linear relationship was applied to understand how these independent variables were related to abundance. Then a Generalized Additive Model (GAM) was tested to improve the correlation approach by means of smoothing functions fn(x) [46,47]. This analysis aims at investigating the nonlinear relationship between abundance and environmental conditions [48]. The P-values and the (AIC) [49] Akaiki Information Criterion values were used to evaluate and select the “best” models.
GAM =b0 + f 1 (x)+ f 2(x)+...+ fn (x) (5)
Where b0 is constant and fn are the smoothing functions related to the different variables.
Results
Trends analysis
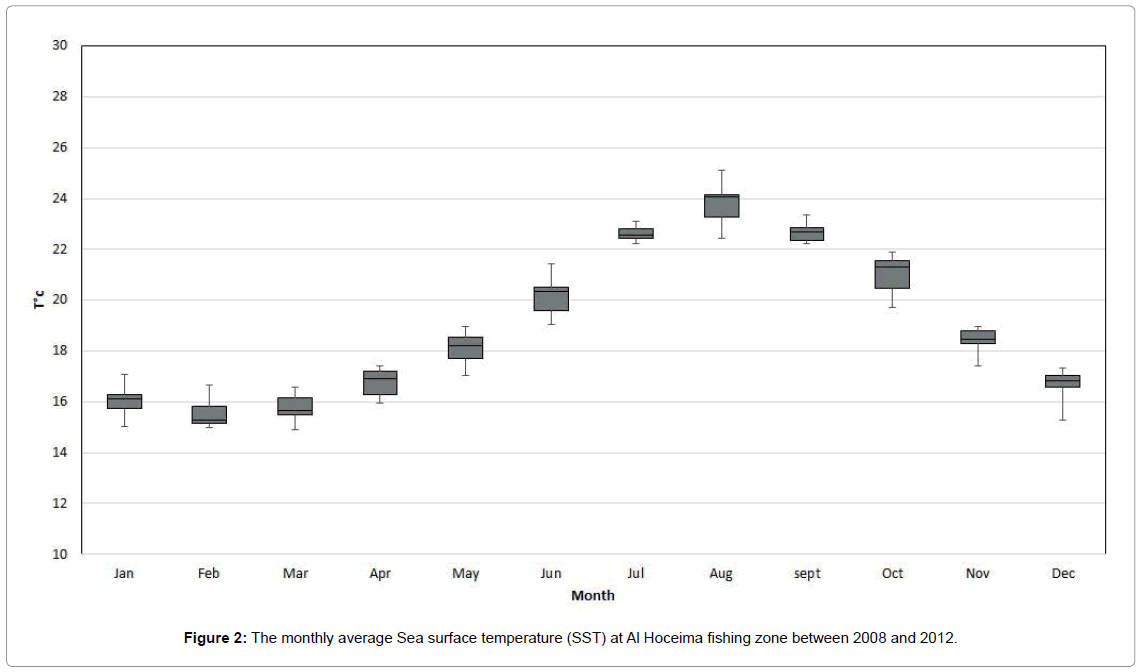
SST trends: The variation of SST monthly averages during 2008-2014 indicated a seasonal biphasic cycle in study area, strongly influenced by atmospheric changes (Figure 2). Results show a cold season between November and April and a hot season between June and October. The inter-annual variability is relatively low and SST values almost have normal distribution.
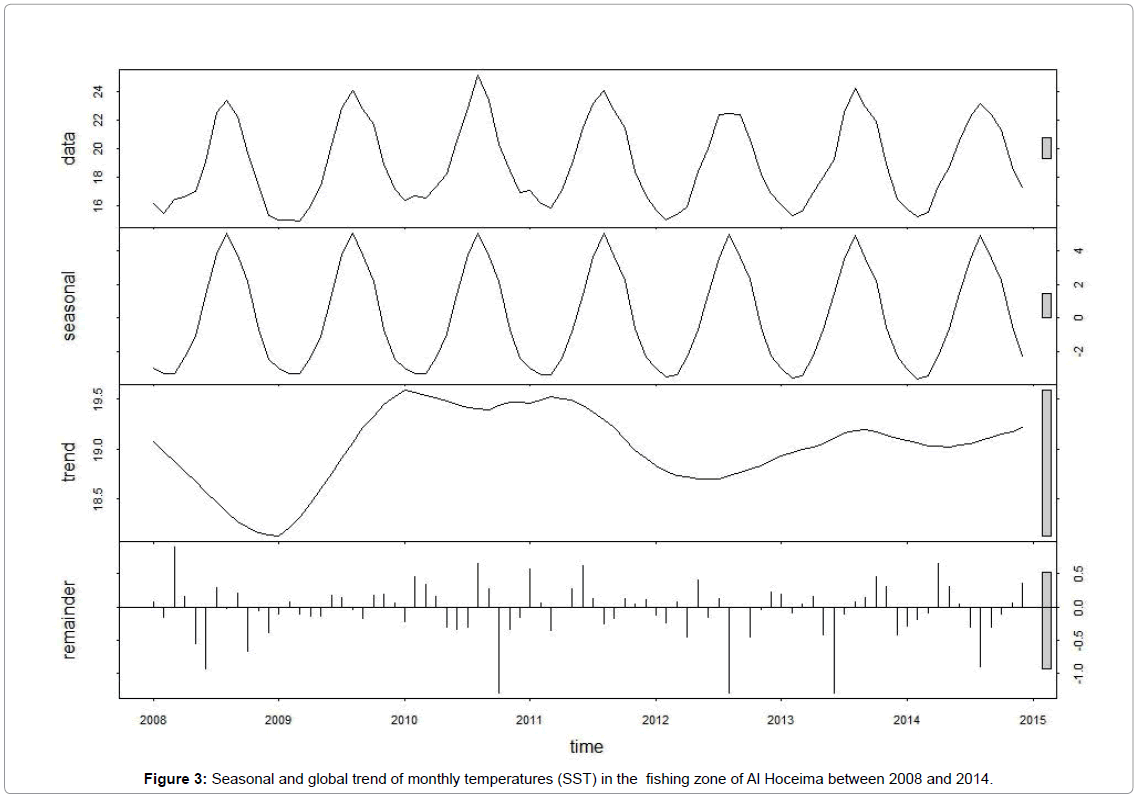
The analysis shows a downward SST trend between 2008 and 2009, followed by a general upward trend between 2009 and 2012 (Figure 3).
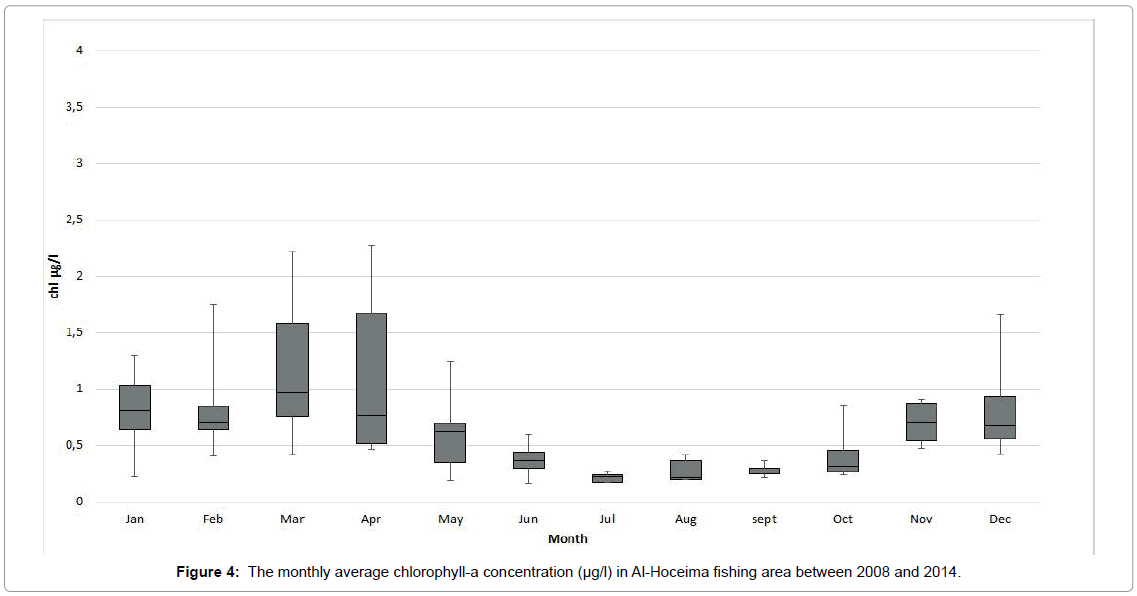
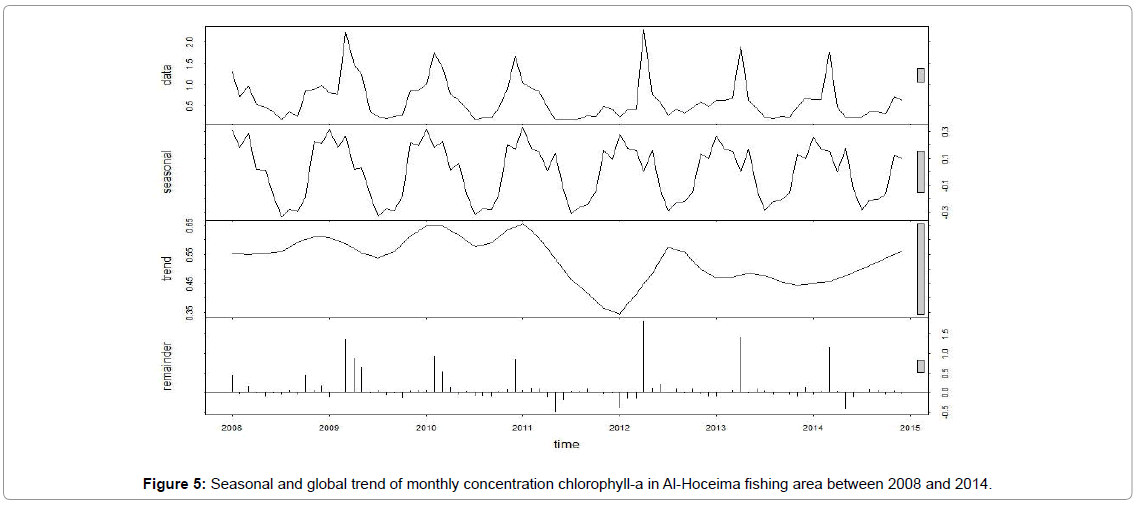
Chl-a trends: The analysis of monthly concentration Chl-a in the fishing zone of Al Hoceima shows a seasonal biphasic cycle. The winterspring period was characterized by high Chl-a concentrations, with a maximum in between March and April. On the other hand, summerautumn period showed low concentration, with a minimum in between June and August (Figure 4).
During the period 2008-2014, the monthly average of Chl-a concentration is 0.45 and 0.91 μg/l for winter-spring and summerautumn, respectively. The inter-annual variability appears to be very high with a maximum observed in winter-spring, where the concentration can vary from 0.19 to 2.88 μg/l.
The trend analysis shows the existence of two distinct periods: a period with relative high Chl-a concentration, whose values are greater than the annual average (0.55 μg/l), which goes from 2008 to 2011 and a period of low level concentration (<0.55 μg/l), which goes from 2012 to 2014 (Figure 5).
CPUE trends: The life cycle of Sardine is essentially characterized by a rapid growth and short span between 3 and 5 year. In Alboran Sea, the spawning period is about six months mainly the tow or trees coldest months in winter [50,51].
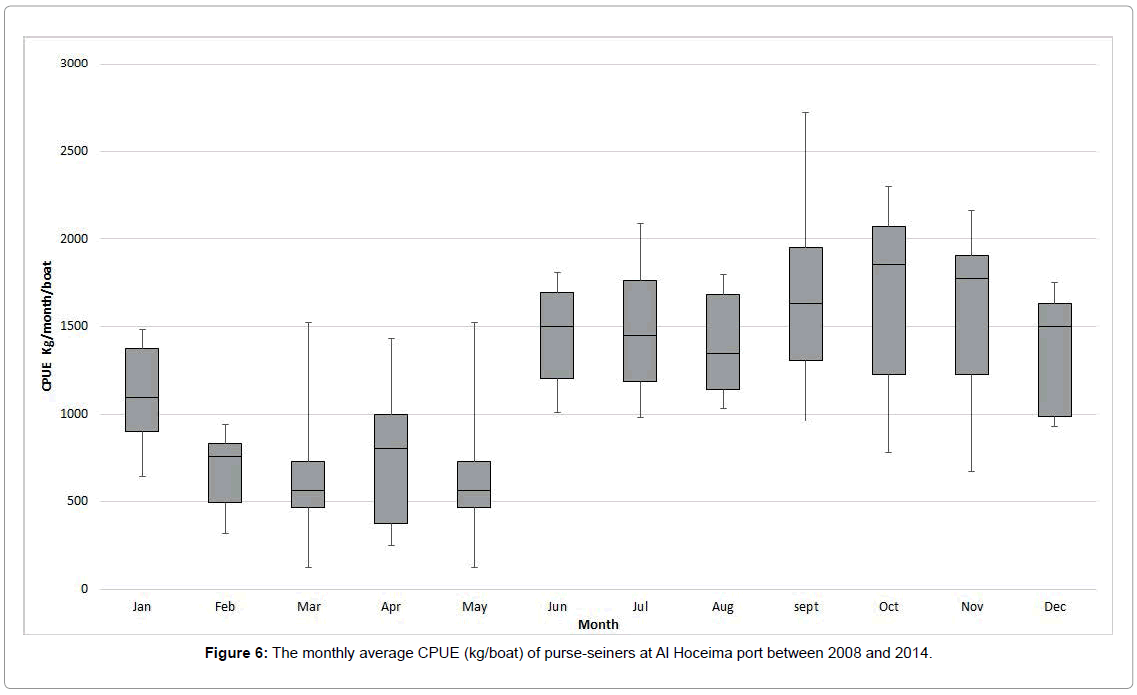
According to the seasonal variability of CPUE (Figure 6) fishing of sardine at Al Hoceima marine area is relatively low from January to May and abundant from June to December (for values> or <1000 kg/ boat/month).
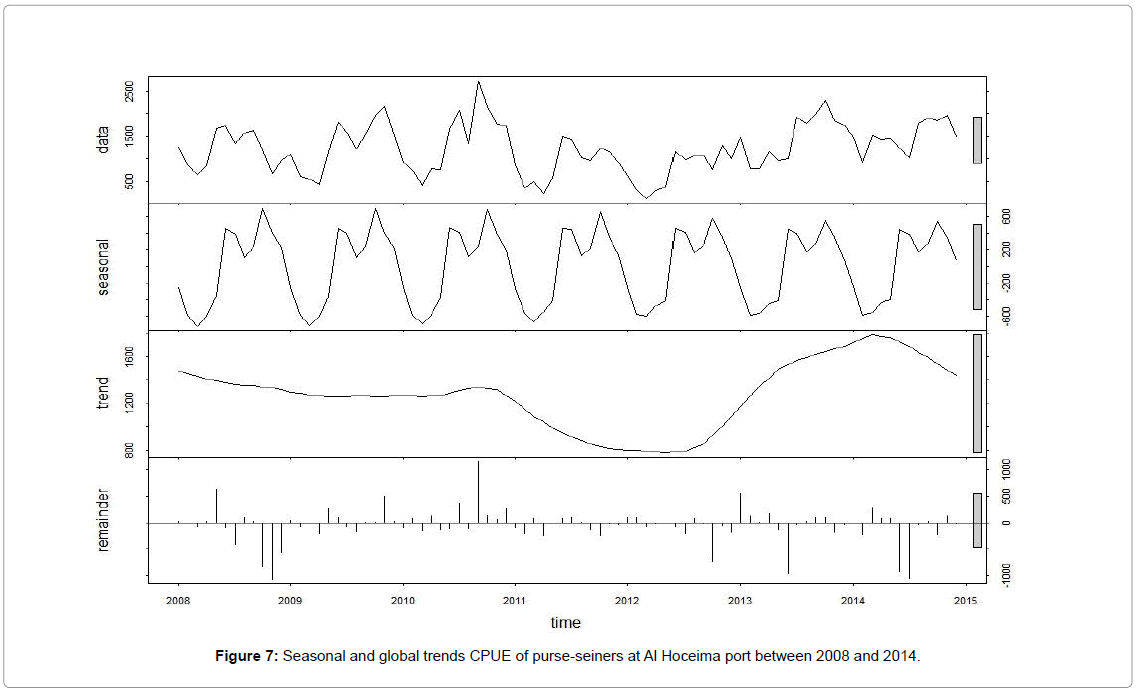
The inter-annual analysis of global trends (Figure 7) allowed the differentiation between two periods: the CPUE shows a gradual downward trend from 2008 to 2012, more pronounced between 2011 and 2012; 123 kg/unit-effort represents a minimal monthly value, never reached before (crisis of March 2012). This decline is then followed by a period of recovery with a gradual increase in yields between 2013 and 2014.
Relationship analysis
To highlight the relationship between environmental conditions (i.e., SST and Chl-a) and fluctuations of CPUE in Al Hoceima area, we used statistical tests. Relationships were studied at different time levels: Monthly; Seasonal (i.e., seasonal trends (Ts)); Annual (i.e., global trends (Tg)).
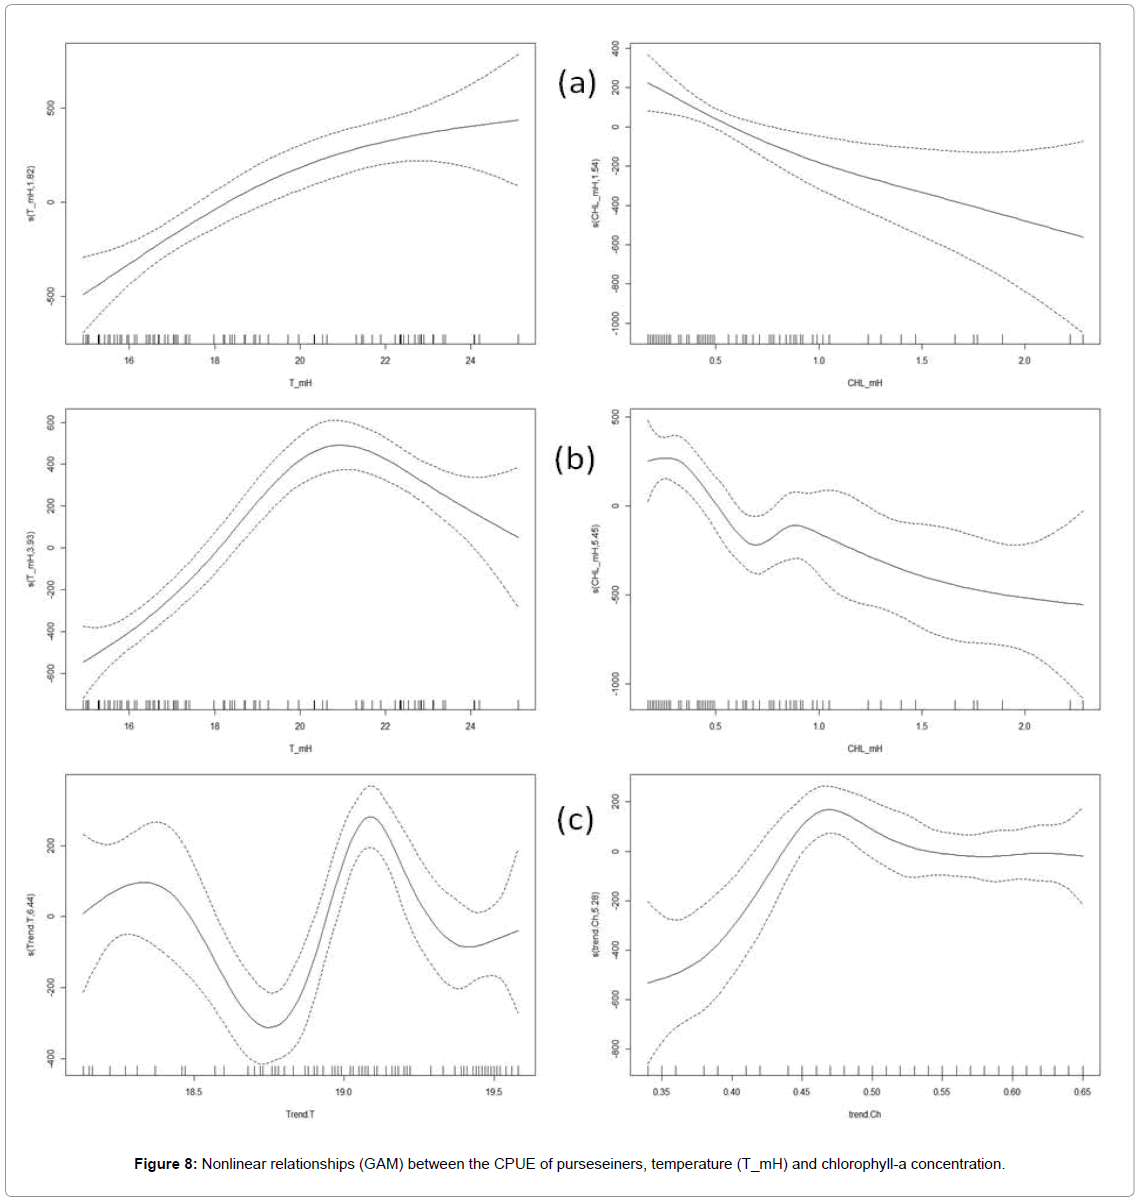
Different relationships (linear and nonlinear, obtained by applying additive models GLM and GAM) between CPUE, SST, and Chl-a are presented in Table 1. The linear models seem to explain only a part of the relationship between abundance and environmental conditions, independently or in an integrated manner (Figure 8). The correlation coefficient (r2) is generally low, ~0.29 for CPUE-temperature and 0.12 for CPUE-Chl-a. This can be explained by the fact that these two parameters do not affect instantaneously (linear relation) the yields (CPUE) but later through their impact on the biomass of spawning, recruitment and the adults through the spatial distributions.
| Models | Function | Type | r2 | Dew | P-Value | AIC |
|---|---|---|---|---|---|---|
| Md1 | CPUE '4' T mean | LM | 0.29 | - | T mH 1.27e-07*** | 1273 |
| Md2 | CPUE " CHL_mean | LM | 0.12 | - | CHL_mH0.00125** | 1291 |
| Md3 | CPUE.H '4' T mH + CHL_mH | GLM | 0.29 | 29 | T mH : 3.19e-05***/ CHL_mH : 0.908 | 1275 |
| Md4 | CPUE.H " s(T mH)) | GAM | 0.3 | 32 | s(T mH) : 4.21e-07 *** | 1271 |
| Md5 | CPUE.H '" s(CHL_mH) | GAM | 0.12 | 13 | s(CHL_mH) : 0.00617** | 1290 |
| Md6 | CPUE.H " s(T mH) + s(CHL_mH) | GAM | 0.3 | 32 | s(T mH) : 9.09e-05***/ s(CHL mH) 0.983 | 1271 |
| Md07 | Seasonal CPUE" s(T mH) | GAM | 0.65 | 67 | s(T mH) 2e-16*** | 1178 |
| Md08 | Seasonal CPUE"s(CHL mH) | GAM | 0.29 | 34 | s(CHL_mH) 2.62e-05*** | 1240 |
| Md09 | Seasonal CPUE" s(T mH) + s(CHL mH) | GAM | 0.65 | 68 | s(T mH)9.07e-14 ***/s(CHL_mH) 0.522 | 1179 |
| Md10 | Trend CPUE " s(Trend. T) | GAM | 0.45 | 49 | s(Trend.T) 4.51e-09*** | 1147 |
| Md11 | Trend CPUE " s(Trend Ch) | GAM | 0.24 | 29 | s(trend.Ch) 0.000347*** | 1173 |
| Md12 | Trend CPUE "s(Trend T) + s(trend.Ch) | GAM | 0.65 | 70 | s(Trend.T) 3.25e-11** */ s(trend.Ch )3.78e-06 | 1115 |
Table 1: LM, GLM and GAM relationships (Md: model) and their statistical parameters between CPUE purse-seiners, temperature (T-mH) and chlorophyll a concentration.
Correlations improve in the case of applying the non-linear relationships GAM (General Additive Model), using cubic smoothing functions and “basis dimension” was taken the best as it possible using p-value and k-index compared to the estimated degree of freedom parameter. CPUE-SST relationship show a correlation coefficient of ~0.65 at seasonal variations level, while r2 ~0.45 for CPUE-Chl relationship at inter-annual variations level (Table 1). The effect of chlorophyll (phytoplankton) seems to be minimal, explains only 30% of the variations while the temperature explains up to 67% for seasonal variations and 50% for the inter-annual variations.
The best functions are those of the model MD07 (Table 1), which connects seasonal variations of CPUE to monthly average SST, and model MD12, which connects inter-annual variations of CPUE to global trends of monthly SST and Chl-a averages. These models showed the best index values of Akaiki (AIC) in their categories: 1178 and 1115 (Table 1).
Based only on the values of temperature and the concentration of chlorophyll-a from satellite images a simple additive model based on time series components was established to predicts the catch per unit effort for Al Hoceima, induced either by changes of seasonal and global trends of environmental conditions:
PUE = Seasonal componentCPUE + Global componentCPUE + ἐ (6)
CPUE= SeasonalCPUE + GlobalCPUE + ἐ (7)
The seasonal component has been replaced by the MD07 model (Table 1), linking the seasonal variations of CPUE to monthly temperature, and the global component has been replaced by the MD12 model (Table 1) with his two functions linking: the global variations of CPUE to the global variations of temperature (SST) and the global variations of CPUE to the global variation of concentration chlorophyll-a. The final equation is as follows:
CPUE= Md07 + Md12 + ἐ (8)
CPUE= fs1(SST) + fs2(Tg_SST) + fs3(Tg_chl) + ἐ (9)
Tg_SST and Tg_chl: are respectively the trends of temperature and chlorophyll-a for the study period calculated from monthly averages using the smoothing functions fs1, fs2 and fs3, based on the general additive model GAM.
Discussions
Over the period 2008-2014, the abundance of sardine (CPUE) in Al-Hoceima (South western Alboran sea) experienced a large variation, illustrated by a gradual downward trend that became more pronounced between 2011 and 2012, followed by a recovery period with an increase in yields between 2013 and 2014 (Figure 7). This warm stat lasted for two years and it was characterized by a positive anomaly in both the cold (+0.56°C) and warm season. After 2012, the SST showed more steady values, with a small rate of changes around 19°C. These changes seem to be inversely proportional to the trend in global temperatures over the two periods, with a directed impact that manifests at a monthly, seasonal, and/or inter-annual level. SST has a major impact on pelagic fish species, affecting their whole life cycle on the short term (monthly) and/or on the medium term (annual). According to many authors, temperature has a positive effect on the growth rate of adults, but it has also a negative effect on the growth of larvae [22-25]. A strong relationship has been observed between abundance and SST, with a positive correlation for a range of 18.5 to 22°C and negative for lower values. Performance in abundance is depending on the seasonal component as the strongest signal detected in the time series due to the seasonal variability of temperature. The maximum yield is determined for average monthly temperatures which vary between 19 and 21°C, corresponding to autumn seawater temperatures. In this period, sardines tends to concentrate more in Betouya bay located in the western part of Al-Hoceima between Cap Tarf and Cap three Forkas for spawning which generally occurs between November and March [18].
It is known that primary production influences spawning and the survival rate of sardine early stages and hence recruitment. Larva survival depends on food availability at the surface, which, in turn, depends on the nutrient content of the surface waters. An increase of surface primary productivity in the waters enhances zooplankton production, the main food for sardine larvae. However, as a proxy of phytoplankton biomass, the study of the relationship between chlorophyll and sardine abundance could not demonstrate the true impact of primary productivity on CPUE, even at monthly or seasonal levels, except in a very limited way at the inter-annual level. The trends showed two distinct periods: from 2008 to 2011, which corresponds to relative high chlorophyll-a concentration, whose values are greater than the annual average (0.55 μg/l); from 2012 to 2014, where low level concentration (<0.55μg/l) was observed (Figure 5). In general, the relationship between abundance and chlorophyll shows a low correlation, but a limiting concentration of less than 0.46 μg/l was reported although the water temperature may be considered favorable around 19°C. The high temperatures above normal (19°C), recorded in 2010 and 2011, combined to low productivity (0.46 μg/l), may cause a gradual decline in yields of the sardine at Al-Hoceima, which has led to the crisis of May 2012 (Table 2) [18].
| Armee | Pr | SST (°C) | Chl a (WI) | CPUE (kg/bateau) |
|---|---|---|---|---|
| 2007/2008 | 257,1 | 18,35 | 0,61 | 1247 |
| 2008/2009 | 643,5 | 18,35 | 0,86 | 1084 |
| 2009/2010 | 482,3 | 19,51 | 0,72 | 1331 |
| 2010/2011 | 995,4 | 19,40 | 0,61 | 1245 |
| 2011/2012 | 474,8 | 18,70 | 0,46 | 771 |
| 2012/2013 | 307,7 | 18,83 | 0,60 | 1176 |
| 2013/2014 | 206,5 | 19,06 | 0,52 | 1565 |
Table 2: Monthly average of CPUE purse-seiners, sea surface temperature (SST) and chlorophyll-a concentration (μg/l) of Al Hoceima fishing maritime area.
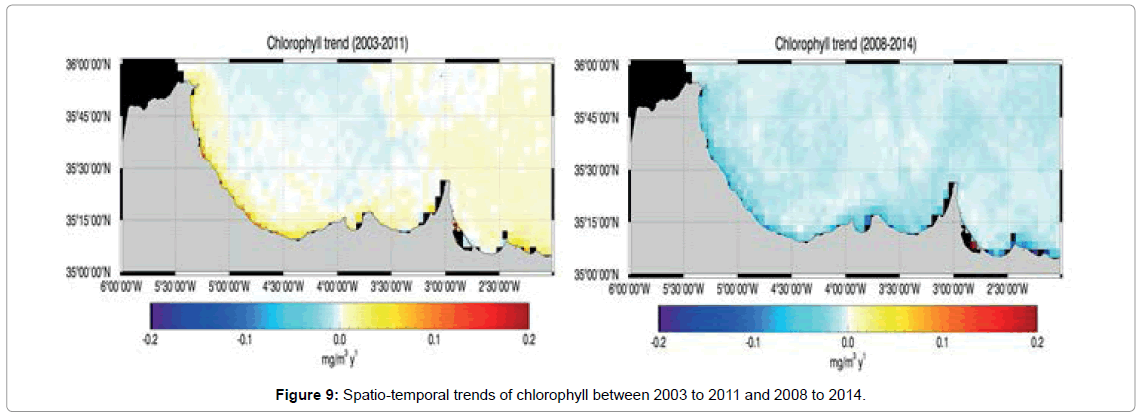
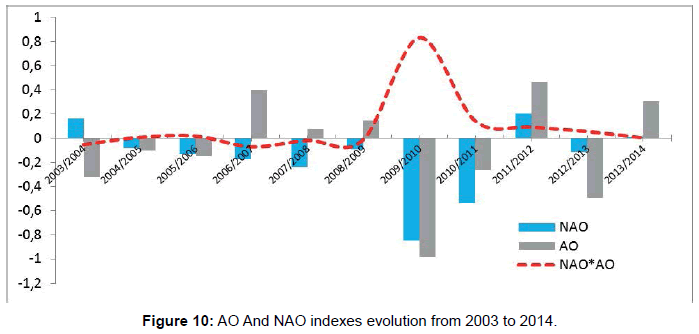
To stress and conform these findings we pursue a satellite trend analysis over the whole Alboran Sea, by applying the Mann-Kendall test and the Sens’s method for trend estimation to the Chl concentration deseasonalized monthly time series, as obtained from the X-11 technique [52]. The analysis confirmed the negative Chl-a trend from 2011 to 2014, which follows a positive trend from 2003 to 2011(Figure 9). This is likely due to a large-scale meteorological change, occurred in 2011. Indeed, the period 2008-2010 corresponds to a negative North Atlantic Oscillation (NAO), i.e., drawing more continental weather to western Europe, (dryer weather with more extreme summers and winters) with wetter weather over the Mediterranean and North African region [53,54]. The resulting large amount of rainfall (more than 600mm/ year) allowed the development of a large primary production in coastal areas related to the abundance of fresh water runoff conducted from watershed. However, from 2011, the reduced rainfall (250mm/year) and runoff had in turn reduced the development of phytoplankton as well as chlorophyll, whose concentrations were very limited to low value less than 0.55 μg/l. Indeed, according to many authors, sea surface warming is always accompanied by decreasing of phytoplankton abundance [55,56]. This impact is reflected in the food web (bottom-up control) through copepod herbivores to zooplankton carnivores because of tight trophic coupling affecting ecosystem services and placing additional stress.
It is largely recognized that both NAO and SST fluctuations are linked [53,57]. SST in the North Atlantic Ocean varies significantly with overlying atmosphere. In the Alboran Sea, these oscillations do not appear to explain, at least directly, the increase of water temperature in south Alboran Sea during wet and cold period. Over this region, air temperature varies between 10 and 12°C during the cold season and from 20 to 25°C during the hot season, and the average rainfall varies between 100 and 300 mm.
However, from 2012, a significant and gradual increase of global air temperature and a decrease in rate of rainfall was observed (Table 2). It is, therefore, likely that the inter-annual variability of SST in the Alboran cannot be explained only by climate oscillations over the Atlantic. The effect is more important in winter, but other oscillations, including Arctic oscillations (AO), can have an effect on this variability. According to Beaz et al. [54], annual and seasonal average of SST in winter are more correlated to the average of the index of (NAO) calculated for autumn of the previous year, while the seasonal average of SST in summer are correlated with the average of the AO, calculated for autumn of the previous year. In 2009 and 2010 a very humid period was recorded in North Africa, in parallel to the very coldest period that was also recorded in Europe (Figure 10) [58].
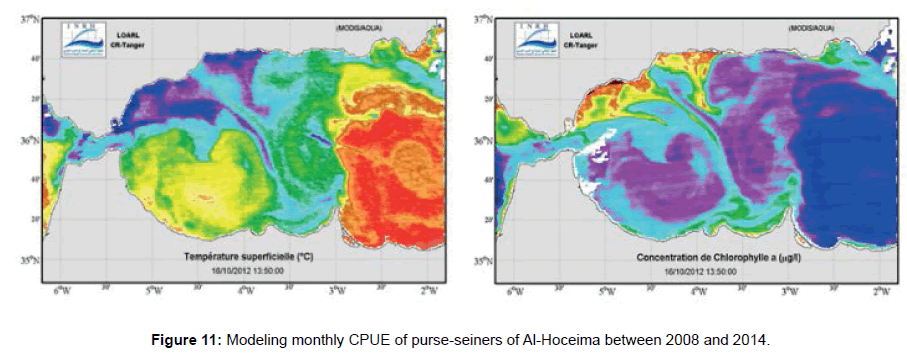
This has favored a very strong flow of fresh water towards the Sea in the spring, leading to a decrease of the salinity and the density, and reducing the importance of upwelling in the Spanish coast. On the Moroccan side, this has led to a gradual warming of the waters over the same period, particularly in the Al-Hoceima region, due to the lack of transfer of cold water from the north to the south by the Gyre [30,31]. The upwelling mechanisms of the Spanish coast and dynamic characteristics of the WAG, associated to changes in hydro-meteorological characteristics as drought and rainfall, seem to have great impact on the environmental conditions such as SST and phytoplankton biomasses in south of Alboran Sea (Figure 11). These changes may cause important fluctuations on sardine abundance in very short time scales with significant implications on fishing especially in Betouya bay at western of Al-Hoceima.
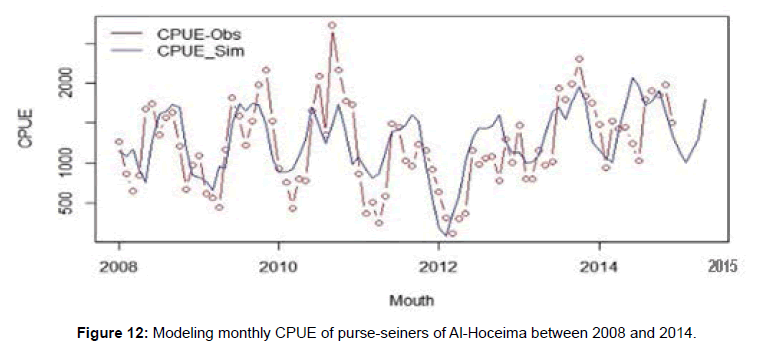
Results of the simulation, by using the above model, are shown in Figure 12, where the residual component due to combination of many factors that act instantly on the catch (such as wind bursts and mesoscale activity) has been removed.
Conclusion
From the trend analysis, it appears that changes in environmental conditions, in terms of changes of water temperature and chlorophyll-a, have a major impact on the sardine abundance in Al-Hoceima fishing area. Global fluctuations in CPUE seem to be inversely proportional to the temperature trend. The analysis of relationships, provided by the GAM models, between environmental parameters (SST/Ch-a) and CPUE at different times scales (monthly, seasonal and interannual) shows that the temperature is a major factor to explain the fluctuations of sardine abundance in this area; is strongly related to the upwelling and Gyre Westerns Alboran gyre (WAG). However a chlorophyll biomass depends mainly on hydro-climatic conditions, especially precipitation. These changes cause important fluctuations in sardine abundance in very short time with significant fishing implications, especially in Betouya Bay western Al-Hoceima area. The increase in water temperature, recorded between 2009 and 2014 combined with a minimum of chlorophyll-a at spring 2011, probably were the cause of the gradual decline in yields of sardines in Al Hoceima that led to the crisis of May 2012 (123 kg/boat). Integrating these parameters in a simple time-series equation of decomposition, a simulation test, using monthly satellite data of temperature and chlorophyll, may provide a diagnostic tool for sardine abundance in the study area of Al-Hoceima marine ecosystem.
References
- Allain G, Petitgas P, Lazure P (2001)The influence of mesoscale ocean processes on anchovy (Engraulisencrasicolus) recruitment in the Bay of Biscay estimated with a three-dimensional hydrodynamic mode. Fish Oceanography 10: 151-163.
- Lafuente JG, Vargas JM, Criado F, Garcia A, Delgado J, et al. (2005) Assessing the variability of hydrographic processes influencing the life cycle of the Sicilian Channel anchovy, Engraulisencrasicolus, by satellite imagery. FISHERIES OCEANOGRAPHY Fish Oceanography 14: 32-46.
- Lett C, Penven P, Ayón P, Fréon P (2007) Enrichment, concentration and retention processes in relation to anchovy (Engraulisringens) eggsand larvae distributions in the northern Humboldt upwelling ecosystem. J Marine Syst 64: 189-200.
- Sabatés A, Olivar MP, Salat J, Palomera I, Alemany F (2007) Physical and biological processes controlling the distribution of fish larvae in the NW Mediterranean. ProgOceanogr 74: 355-376
- Santos AMP, Chícharo A, Dos Santos A, Moita T, Oliveira PB, et al. (2007) Physical-biological interactions in the life history of small pelagic fish in the Western Iberia Upwelling Ecosystem. ProgOceanogr 74: 192-209.
- Rykaczewski RR, CheckleyJr DM (2008) Influence of ocean winds on the pelagic ecosystem in upwelling regions. PNAS 105: 1965-1970
- Xu Y, Rose KA, Chai F, Chavez FP, Ayón P (2015) Does spatial variation in environmental conditions affect recruitment? A study using a 3-D model of Peruvian anchovy. Progress in Oceanography 138: 417-430.
- Palatella L, Bignami F, Falcini F, Lacorata G, Lanotte AS, et al. (2014)Lagrangian simulations and interannual variability of anchovy egg and larva dispersal in the Sicily Channe. J Geophys Res Oceans 119: 1306-1323.
- Falcini F, Palatella L, Cuttitta A, Nardelli B, Lacorata A, Lanotte G, et al. (2015)The role of hydrodynamic processes on anchovy eggs and larvae distribution in the sicily channel (Mediterranean Sea): a case study for the 2004 data set. PloS one 10
- Schwartzlose RA, Alheit J, Bakun A, Baumgartner TR, Cloete R, et al.(1999) Worldwide large-scale fluctuations of sardine and anchovy populations. South African Journal of Marine Science 21: 289-347
- Binet D, Gobert B Maloueki L (2001) El Nin˜o-like warm events in the Eastern Atlantic (6_N, 20_S) and fish availability from Congo to Angola (1964–1999). Aquatic Living Resources 14: 99-113
- Boyer DC, Boyer HJ, Fossen I, Kreiner A (2001) Changes in abundance of the northern Benguela sardine stock during the decade 1990–2000, with comments on the relative importance of fishing and the environment. South African Journal of Marine Science 23: 67-84.
- Fréon P, Cury P, Shannon L, Roy C (2005) Sustainable exploitation of small pelagic fish stocks challenged by environmental and ecosystem changes: a review. Bulletin of Marine Science 76: 385-462.
- Zwolinski JP, Oliveira PB, Quintino V, Stratoudakis Y (2010) Sardine potential habitat and environmental forcing off western Portugal. ICES Journal of Marine Science 67: 1553-1564.
- Macías AD, Castilla-Espino B, García-del-Hoyo JJ, Navarro C, Catalán D, et al.(2014) Consequences of a future climatic scenario for the anchovy fishery in the Alboran Sea (SW Mediterranean): A modeling study Journal of Marine Systems 135: 150-159.
- Zahri Yassine (2006)Etude des prix des petits pélagique en Méditerranée marocaine : Mémoire de master en science économique et gestion de l‘activité de pêche, Université de Barcelone 04 de Abril.
- Kada, Idrissi (2010) Etat d’exploitation du stock de la sardine en Méditerranée marocaine. CGPM, Sous-Comité d'Evaluation des Stocks (SCES), Mazzra Del Vallo, Italie.
- INRH (2016) Etat des Stocks et des Pêcheries Marocaines 2015. Département Ressources Halieutiques Laboratoires Centraux – Casablanca Août 2016/DRH 16-08.
- Kifani S,Gohin F (1991) Dynamique de-l’upwelling et variabilité spatio-temporelle Sardine Température de surface de la répartition de la sardine marocaine, Sardina pilchardus (Walbaum, 1792). Oceanologica Acta 15: 173-186.
- Katara I, Pierce G J, Illian J, Scott BE (2011)Environmental drivers of the anchovy/sardine complex in the EasternMediterranean. Hydrobiologia 670: 49-65.
- Alheit J (1985) Spawning frequency of Peruvian anchovies. In: Lasker (editor): An egg production method for estimating spawning biomass of pelagic fish: Application to the northern anchovy, Engraulismordax. Dep. Commer, U.S.
- Laura Rodríguez-Graña, Leonardo, Castro R (2003) Ichthyoplankton distribution off the Peninsula de Mejillones, Chile (23° S, 71° W), under variable hydrographic conditions during the austral summer and winter of the 1997 El Niño. Hydrobiologia 501: 59
- Berraho A (2007)Relation spatialisée entre milieu etichtyoplancton des petites pélagiques de la côteAtlantiquemarocaine (zones centrale et sud). ThèseDoctorat, Univ Mohammed V Agdal. Rabat.
- Kawasaki T (1991) Long-term Viability of Pelagic Fish Populations and Their Environment.
- T. Kawasaki S, Tanaka Y, Toba, Taniguchi A.New York: Pergamum Press 47-60.
- Llucha-Belda D, Daniel B Llucho-cota, HernadezVazquez S, Cesar A, Salinas-zavalA (1991) Sardine and anchovy spawning as related to temperature and upwelling in the Californian current system. CalCOFlRep 32.
- Mann KH (1993) Physical oceanography, food chains, and fish stocks: a review ICES J Mar Sci 50: 105-119.
- Miller KA, Fluharty DL (1992) El Niño and variability in the north-eastern Pacific Salmon fishery: implications for coping with climate change. In: Glantz, M.H. (Ed.), Climate variability, climate change and fisheries. Cambridge University Press, Cambridge, UK, 49-88.
- Moyle PB, Cech JJ (2004). Fishes: An Introduction to Ichthyology, 5 th Ed. Prentice Hall. Upper Saddle River. NJ 726.
- Tugores MP, Giannoulaki M, Iglesias M, Bonanno A, Ticina V, et al. (2011) Habitat suitability modelling for sardine Sardinapilchardus in a highly diverse ecosystem: the Mediterranean Sea. Marine Ecology Progress Series 443: 181-205.
- Sarhan T, García-Lafuente J, Vargas M, Vargas JM, Plaza F (2000) c. J Mar Syst 23: 317-331.
- Stanichny S, Tigny V, Stanichnaya R, Djenidi (2005) Wind driven upwelling along the African coast of the Strait of Gibraltar, Geophys. Res Lett 32: 04604.
- Vargas Yáñez M, Zunino P, Benali A, Delpy M, Pastre F, et al. (2010) How much is the western Mediterranean really warming and salting?.Journal of Geophysical Research: Oceans115.
- Olivar MP, Salat J, Palomera IA (2001) Comparative study of the spatial-distribution patterns of the early stages of anchovy and pilchard in the NW Mediterranean Sea. Marine Ecology Progress Series 217:111-120.
- Petrere J, Gaiacomini MHC, Junior MP (2010) Catch-per-unit-effort: which estimator is best? Brazilian Journal of Biology 70:483-491.
- Campbell RA (2004) CPUE: standardisation and the construction of indices of stock abundance in a spatially varying fishery using general linear models. Fish. Res. 70: 209-227.
- Maunder MN, Sibert JR, Fonteneau A, Hampton J, Kleiber P, et al. (2006) Interpreting catch per unit effort data to assess the status of individual stocks and communities. ICES Journal of Marine Science, 63: 1373-1385.
- Maunder MN, Punt AE (2004) Standardizing catch and effort data: a review of recent approaches. Fish Res 70: 141-149.
- Vantrepotte V, Mélin F (2011) Inter-annual variations in the SeaWiFS global chlorophyll a concentration (1997–2007). Deep Sea Research Part I: Oceanographic Research Papers 58: 429-441.
- Vantrepotte V, Mélin F (2009) Temporal variability of 10-year global SeaWiFS time-series of phytoplankton chlorophyll a concentration. ICES Journal of Marine Science, 66: 1547-1556.
- Loisel H, Mangin A, Vantrepotte V, Dessailly D, Dinh DN, et al. (2014) Variability of suspended particulate matter concentration in coastal waters under the Mekong's influence from ocean color (MERIS) remote sensing over the last decade. Remote Sensing of Environment, 150: 218-230.
- Cleveland RB, Cleveland WS, McRae JE, Terpenning I (1990) STL: A Seasonal-Trend Decomposition Procedure Based on Loess. Journal of Official Statistics 6: 3-73.
- Lauret-Stepler J, Bourjea D, Roos D, Pelletier PG, Ryan S, et al. (2007) Reproductive seasonality and trend of Cheloniamydas in the SW Indian Ocean: a 20 yr study based on track counts endangered species research. Endang Species Res. 3: 217-227.
- SomarakisStylianos, AlexisRamfos, Andreas Palialexis, Vasilis D. Valavanis (2011) Contrasting multispecies patterns in larval fish production trace inter-annual variability in oceanographic conditions over the N.E. Aegean Sea continental shelf (Eastern Mediterranean). Hydrobiologia 670:275-287
- Perretti Charles (2015) Reducing Uncertainty in Data-Poor Assessments Using Seasonal-Trend Decomposition EFSC, National Marine Fisheries Service, Woods Hole, MA.
- Hastie T, Tibshirani R (1990) Generalized Additive Models. London: Chapman and Hall
- Chambers JM, Hastie TJ (1997) Statistical Models in S. Chapman and Hall, London.
- Bigelow KA, Boggs CH, He X (1999) Environmental effects on swordfish and blue shark catch rates in the US North Pacific longline fishery. Fish. Oceanogr 8: 178-198.
- Akaike H (1974) A newlook at the statistical identification model. IEEE Transactions on Automatic Control 19: 716-723.
- Stratoudakis Y, Coombs S, de Lanzós AL, Halliday N, Costas G, et al. (2007) Sardine (Sardinapilchardus) spawning seasonality in European waters of the northeast Atlantic. Marine Biology 152: 201-212.
- Ramı́rez T, Cortés D, Garcı́a A, Carpena A (2004) Seasonal variations of RNA/DNA ratios and growth rates of the Alboran Sea sardine larvae (Sardinapilchardus). Fisheries research 68: 57-65.
- Colella, Simone, Federico Falcini, Eleonora Rinaldi, Michela Sammartino, et al. (2016) "Mediterranean Ocean Colour Chlorophyll Trends." PloS one 11: 0155756.
- Visbeck MH, Hurrell JW, Polvani L, Cullen HM (2001) The North Atlantic Oscillation: Past, present, and future. PNAS 98: 12876-12877.
- Báez JC, Gimeno L, Gómez-Gesteira M, Ferri-Yáñez F, Real R (2013) Combined effects of the North Atlantic Oscillation and the Arctic Oscillation on sea surface temperature in the Alborán Sea. PLoS ONE 8.
- Daniel G, Boyce, Marlon R, Lewis R, et al. (2010) Global phytoplankton decline over the past century. Nature: 466: 591-596.
- Richardson AJ, Schoeman DS (2004) Climate impact of plankton ecosystems in the Northeast Atlantic. Science 30: 1609-1612.
- Bjerknes, J (1964) Atlantic air-sea interaction, Adv. Geophys. 10: 1-82.
- Cattiaux J, Vautard R, Cassou C, Yiou P, Masson Delmotte V, et al. (2010) Winter 2010 in Europe: a cold extreme in a warming climate. Geophysical Research Letters 37.
Relevant Topics
- Algal Blooms
- Blue Carbon Sequestration
- Brackish Water
- Catfish
- Coral Bleaching
- Coral Reefs
- Deep Sea Fish
- Deep Sea Mining
- Ichthyoplankton
- Mangrove Ecosystem
- Marine Engineering
- Marine Fisheries
- Marine Mammal Research
- Marine Microbiome Analysis
- Marine Pollution
- Marine Reptiles
- Marine Science
- Ocean Currents
- Photoendosymbiosis
- Reef Biology
- Sea Food
- Sea Grass
- Sea Transportation
- Seaweed
Recommended Journals
Article Tools
Article Usage
- Total views: 5460
- [From(publication date):
October-2017 - Jul 11, 2025] - Breakdown by view type
- HTML page views : 4426
- PDF downloads : 1034

