Research Article Open Access
Assessing Hydrological Response to Changing Climate in the Krishna Basin of India
| Kulkarni BD, Deshpande NR*, Patwardhan SK and Bansod SD | |
| Indian Institute of Tropical Meteorology, Pune, India | |
| Corresponding Author : | Deshpande NR Indian Institute of Tropical Meteorology Pune 411008, India Tel: +91 20 25904541 E-mail: nrdesh@tropemt.res.in |
| Received June 24, 2014; Accepted July 29, 2014; Published August 10, 2014 | |
| Citation:Kulkarni BD, Deshpande NR, Patwardhan SK, Bansod SD (2014) Assessing Hydrological Response to Changing Climate in the Krishna Basin of India. J Earth Sci Clim Change 5: 211doi: 10.4172/2157-7617.1000211 | |
| Copyright: © 2014 Kulkarni BD, et al. This is an open-access article distributed under the terms of the Creative Commons Attribution License, which permits unrestricted use, distribution, and reproduction in any medium, provided the original author and source are credited. | |
Visit for more related articles at Journal of Earth Science & Climatic Change
Abstract
Impact of climate change on water balance components in the Krishna river basin are investigated using a semidistributed hydrological model namely Soil and Water Assessment Tool (SWAT). The model is calibrated and validated using the measured stream flow and meteorological data for the period (1970-1990) at a single guage outlet. The model has been used further for hydrologic parameter simulations. Daily climate simulations from regional climate model PRECIS (Providing Regional Climates for Impacts Studies) is used as input for running SWAT and monthly hydrologic parameters such as precipitation, surface flow, water yield, Evapotranspiration (ET) and Potential Evapotranspiration (PET) are generated under the assumption of no change in Land Use and Land Cover (LULC) pattern over time. Simulations at 23 sub-basins of the Krishna basin have been obtained for the control runs (1961-1990) and the for two time slices of future scenarios (2011-2040) and (2041-2070). Model projections indicate increase in the annual discharge, surface runoff and base flow in the basin in mid-century.
| Keywords |
| Climate change; Krishna river basin; SWAT; PRECIS |
| Introduction |
| Climate variability and change are expected to alter regional hydrologic conditions and result in variety of impacts on water resource systems throughout the world. Potential impacts may include changes in hydrological processes such as evapotranspiration, soil moisture, water temperature, stream flow volume, timing and magnitude of runoff, and frequency and severity of floods [1,2]. Such hydrologic changes have pronounced impact on many sectors of the society. Quantitative estimation of the hydrological effects of climate change will be helpful for appropriate design and management of water resources in that region. The general impacts of climate change on water resources have been brought out by the Fifth Assessment Report of the Intergovernmental Panel on Climate Change [3] emphasizing on increasing flood and extreme weather events leading to deteriorated drinking water quality and other health hazards with increase in epidemic diseases. Observed warming over several decades has been linked to changes in the largescale hydrological cycle such as, increasing atmospheric water vapor content; changing precipitation patterns, intensity of extremes reduced snow cover and widespread melting of ice as well as changes in soil moisture and runoff. Precipitation changes show substantial spatial and temporal variability. The frequency of heavy precipitation events shows increasing trends over the central part of India [4]. |
| Impact of climate change is going to be most severe in the developing countries, because of their poor capacity to cope up with and adapt the climate change. The present study examines the future projections of water balance components in the Krishna river basin, which is second largest river basin in the Indian Peninsular region. |
| The main objective of this study is to evaluate the climate change impacts on the future water balance components at different sub-basins of the Krishna river basin. In order to accomplish this objective, SWAT, a distributed hydrologic model has been used. Future climate projections simulated by the regional Climate Model PRECIS under A1B scenario are used as input to SWAT to project future stream flow changes |
| Materials and Methods |
| Study area |
| The Krishna is one of the longest rivers in the Peninsular India (about 1,300 km in length). It originates at Mahabaleshwar in Maharashtra, passes through Maharashtra, Karnataka and Andhra Pradesh before meeting Bay of Bengal. The drainage area of the entire basin is about 2,58,948 km2 of which 26.8% lies in Maharashtra state, 43.8% in Karnataka state and 29.4% in Andhra Pradesh state. Its important tributaries are the Tungabhadra River which itself is formed by the rivers Tunga and Bhadra, the Koyna, Bhima, Malprabha etc. In the present study the Krishna basin is divided in to 23 sub-basins. |
| A hydrological model- SWAT is used in the present analysis. The SWAT model is a physically based, continuous-time model, developed by Dr. Jeff Arnold for United USDA-ARS (Agricultural Research Service) [5]. It is used worldwide. In China, the model has been used to simulate or predict runoff of different basins, e.g. the Yangtze River [6,7], Sanchuanhe River [8]. In India this model has been extensively used for climate change study of Indian River basins by Gosain et al. [9]. The model has an ability to use for small watersheds as well as the major river basin systems. It is distributed, continuous daily time interval hydrological model with an ArcGIS interface. The study determines the present water availability in space and time, without incorporating any man made changes like dams, diversions etc. The same framework is then used to predict the impacts of climatic change on the availability of future water resources under the assumption of no change in the land use pattern over the time [10]. |
| Data used |
| The SWAT model requires data on terrain, land use, soil and weather for the assessment of water availability at desired locations of the drainage basin. To create a SWAT dataset, the interface needs to access ArcGIS with spatial analyst extension and data set files, which provide certain types of information about the watershed. |
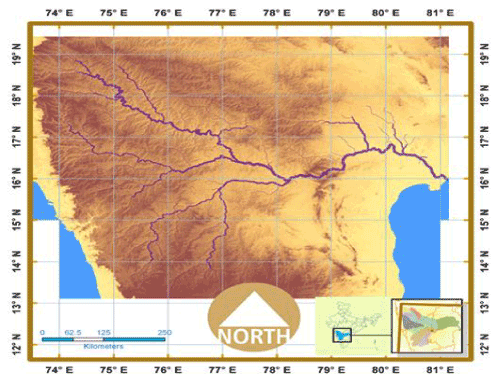
| Digital Elevation Model (DEM): DEM represents a topographic surface in terms of a set of elevation values measured at a finite number of points. DEM for the study area in the present analysis have been downloaded from ASTER GDM., ASTER Global Digital Elevation Model (ASTER GDEM). The Ministry of Economy, Trade and Industry of Japan (METI) and the National Aeronautics and Space Administration (NASA) are collaborating on a project to develop ASTER Global Digital Elevation Model (ASTER GDEM). DEM data for the study region is acquired by a satellite-borne sensor "ASTER". The resolution of the data is 30 seconds and it is downloaded in degree tiles and then mosaic using ArcGIS tool box. The stream layer and watershed layer have been generated using above mentioned data set. Figure 1 shows the Digital Elevation Model of the basin. |
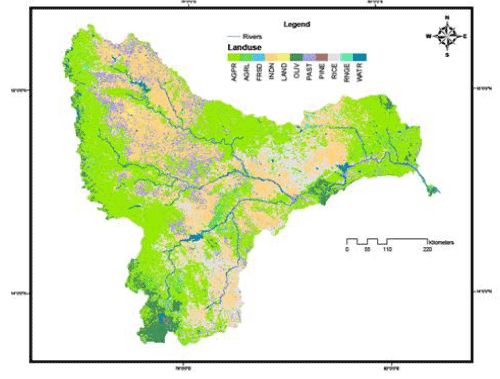
| Land use/Land cover layer: Classified land cover data produced by the University of Maryland using remote sensing Global Land cover Facility (13 categories) with resolution of 1 km×1 km grid cell size is used [11]. Figure 2 shows land use/land cover in the basin. |
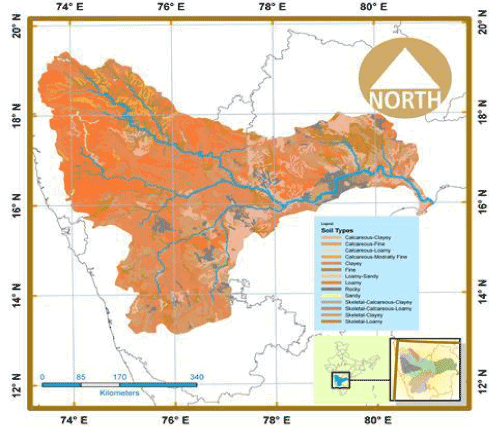
| Soil data: The paper maps of soil layer have been procured from the National Bureau of Soil Survey and Land Use Planning [12], Nagpur, a premier Institute of the Indian Council of Agriculture Research (ICAR). These soil maps were first digitized and various soil properties viz. Hydrological Group, Maximum routing Depth (mm), Depth of soil at various layers, Water holding capacity of the soil, Texture of the soil, Bulk Density, Moist soil albedo and erosion factor of the soil have been worked out. Figure 3 shows the soil layer of the basin. |
| Weather data: |
| Weather generator data: SWAT requires daily values of precipitation, maximum and minimum temperature, solar radiation, relative humidity and wind speed. Daily gridded rainfall for the period 1951-2009 and temperature values for the period 1969-2005, published by India Meteorological Department (IMD), Pune India, have been used. Monthly climatology of solar radiation, wind and relative humidity published by IMD, Pune is used for weather generator. |
| Regional climate model data sets: PRECIS (Providing Regional Climate for Regional Studies) is the regional climate modeling system developed by the Hadley Centre, UK. It is a limited area model and can be locatable on any part of the globe. The PRECIS model is based on the atmospheric component of Hadley Centre Climate model (HadCM3) with substantial modifications to the model physics [13]. PRECIS is an atmospheric and land surface model. HadAM3H is an atmosphereonly model of Hadley Centre, UK which has been derived from the atmospheric component of HadCM3. Being a limited area model, PRECIS is forced at its lateral boundaries by the Lateral Boundary Conditions (LBCs) obtained from HadAM3H. PRECIS has horizontal resolution of 50 km x 50 km. The model details are described in Noguer et al. [14]. |
| PRECIS has been configured for a domain extending 1.5°N to 38°N and 56°E-103°E. PRECIS simulations have been performed in Indian Institute of Tropical Meteorology, Pune, India to generate the present climate (1961-1990) and future scenarios for 2020s (2011-2040), 2050s (2041-2070) and 2080s (2071-2098) for A1B scenario. The LBCs are used from the QUMP (Quantifying Model Uncertainty in Model Predictions) project of Hadley Centre, UK [15]. PRECIS simulations with LBCs from QUMP project show reasonable skill in representing the present climate [16]. |
| The daily simulations of solar radiation, wind speed, relative humidity, rainfall and temperatures (maximum as well as minimum) for the period 1961-1990 (representing present climate) and for future time slices viz. 2011-2040 and 2041-2070 are used to run the hydrological model SWAT for Krishna Basin through ARCGIS interface. Daily Climate simulations for present climate (baseline period) of 1961-1990 is used for model validation. |
| Hydrological modelling of the basin |
| The ArcSWAT distributed hydrologic model has been used here to simulate hydrological parameter for future scenario. The basin has been sub-divided in to 23 sub-basins so as to account for the spatial variability. After mapping the basin for terrain, land use and soil features of the basin, hydrological parameters are generated for observed, baseline (present climate) and future projected weather data sets. |
| Delineation of the river basin |
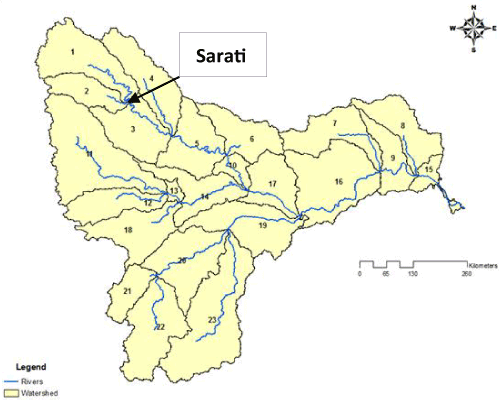
| Automatic delineation of the Krishna river basin is done by using the DEM as input and the final outflow point on the river basin as the final drainage point. Figure 4 depicts the modelled river basin (automatically delineated using ArcGIS). The river basin has been further divided into 23 sub-basins. |
| Results and Discussions |
| Model calibration and validation |
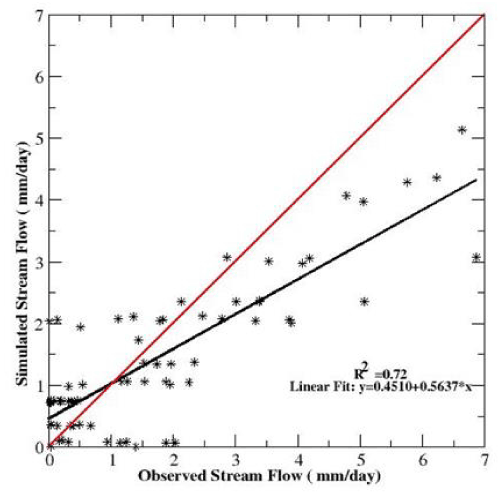
| Monthly calibration and validation of the SWAT model for stream flow were performed after conducting sensitivity analysis. Manual and automatic calibration methods were used for calibration. The sensitivity analysis and calibration currently available in the SWAT-CUP , Sequential Uncertainty Fitting (SUFI 2 method) were performed to determine optimal parameter values for output variable based upon observed data collected at a single gauge outlet of the Nira river watershed at Sarati (17° 54’ 00 N, 75° 02’ 00 E) shown in Figure 4. Twenty one (1970-1990) years of meteorological and measured monthly stream flow data were used for calibration and validation. The data for the period 1970-1986 were used for the calibration including two years of warm-up period (1970 and 1971) and 1987-1990 were used for validation. The warmup period minimizes the effect of the simulated initial state variable such as soil water content and surface residue. After each parameter adjustment, the simulated and measured stream flows were compared to examine the improvement in the model prediction. The performance of the model in simulating hydrologic variables was evaluated with the help of statistical parameters such as coefficient of determination (R2) and Nash-Suttcliffe Simulation Efficiency (NSE). The R2 value indicates the relationship between the observed and simulated values, while, NSE indicates how well the plot of observed verses simulated values fits the 1:1 line, mean absolute error (MAE) and Root Mean Square Error (RMSE) indicate the difference between observed and simulated values. Model prediction is considered unacceptable if theR2 and NSE values less than or very close to zero while prediction is perfect if the values are almost one. While MAE and RMSE have lower limit of zero which is the optimal value for them. Statistical parameters for model evaluation are given in Table 1. |
| The scatter plots of the observed and simulated monthly stream flow for the calibration period during June to September is shown in Figure 5 (a). |
| The major portion of the scatter plot is well distributed about the regression line indicating the model capability of estimating stream flow for well-distributed normal rainfall events. The R2 and NSE values were found to be as 0.72 and 0.82 respectively. The R2 value during the calibration period shows a good correlation between observed and simulated values of stream flow. |
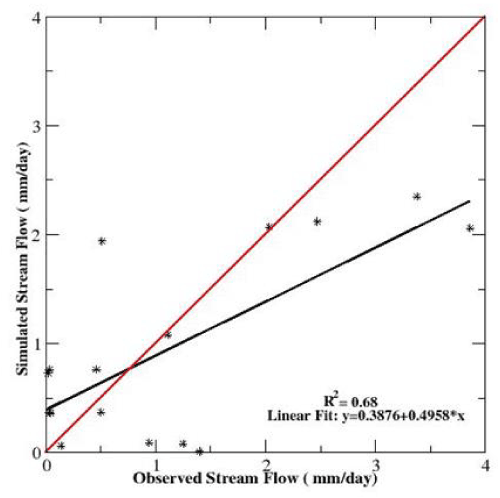
| The scatter plots of the observed and simulated monthly stream flow for validation period (1987-1990) during June to September are shown in the Figure 5(b). The R2 and NSE values were found to be as 0.69 and 0.77 respectively during the validation period. R2 values during the validation and calibration period indicate a good correlation between observed and simulated values of monthly stream flow. |
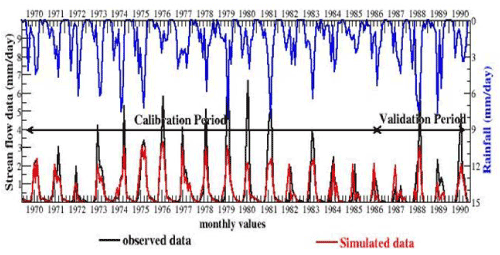
| The simulated monthly stream flow values during monsoon season have been compared with the observed stream flow values and shown in Figure 6. It is seen that the magnitudes of the simulated stream flow are lower than that of observed stream flow during high rainfall events. In case of normal rainfall events the prediction matches with the measured values. As initially the soil was dry and major portion of rainfall was retained in the cultivable land, the less runoff was generated at the beginning of the monsoon season. It is observed that the stream flow mainly depends on the nature of rainfall. Heavy and continuous rainfall in short span of time produces more runoff. The observed as well as simulated high runoff during high rainfall months of July through September causes slower recharge process. |
| After validating the hydrological model, for the historical records, the next step is to simulate the hydrological parameters for future climate projections using PRECIS data corresponding to two time slices under A1B scenario. |
| Hydrological parameter estimation for baseline simulations |
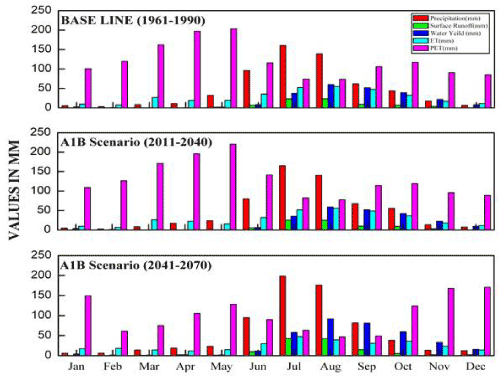
| Monthly stream flow in the Krishna basin has been simulated using ArcSWAT model for PRECIS control climate (1961-1990). An evaluation of the PRECIS model, skills and biases are well comparable with observed precipitation and temperature patterns. The SWAT model has been used on various Indian catchments of varied sizes and it has been observed that the model performs very well [17]. Presently, the model has been used in absence of any manmade structures across the river. The model generates the detailed outputs on flow at sub-basin outlet points, actual evapotranspiration and soil moisture status on monthly scale. Further sub-divisions of the total flow into components such as surface and subsurface runoff, recharge to the ground water, are made on daily basis. The monthly average precipitation, actual evapotranspiration and water yield as simulated by the model over the Krishna basin as a whole for control scenario as well as for future two time slices has been depicted in Figure 7. |
| Hydrological parameter estimation for future climate scenario |
| The model is run for the Krishna river basin for future climate scenario (for the data period 2011-2040 & 2041- 2070 viz) assuming no change in the land use pattern in the 21st century. Detailed analyses have been performed on the study basin to demonstrate the impacts at the sub-basin level. The monthly average simulated precipitation, actual evapotranspiration, potential evapotranspiration, surface flow and water yield have also been depicted in Figure 7. |
| Temporal changes in water balance components |
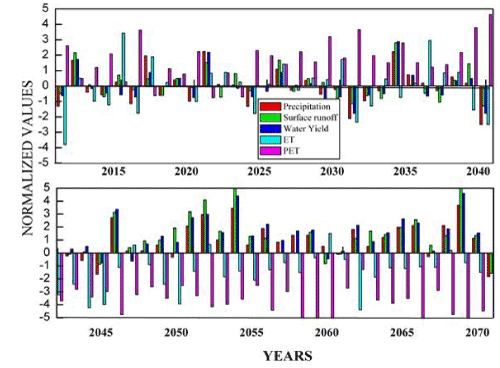
| All annual water balance components have been normalized for the baseline period and shown in Figure 8. Climate projections for the period 2041-2070 indicate, increase in the annual precipitation, surface runoff, water yield and actual evapotranspiration as compared to the baseline simulations of 1961-1990. However no substantial change have been indicated in these parameters by the model runs in 2020s (2011- 2040). |
| Limitations of the study |
| This study uses only one ensemble of future climate scenario for each of the 2 time slices. Hence the Results of the present study may be used qualitatively. Use of multiple ensembles will reduce the uncertainty in the results. Moreover, the model simulations consider only future climate change scenarios assuming no change in land use pattern and soil type. But changes in the land use, soil, management activities and other climate variables will also contribute some impacts on water availability and crop production. |
| Conclusion |
| Climate change impacts on water balance components of the Krishna basin in India are investigated in the present study. Quantification of the climate change impacts on soil water availability and surface runoff have been carried out using Regional Climate Model (PRECIS) simulations and water balance simulation modeling approach of SWAT model. Some of the outcomes of the study are summarized here. |
| 1. The criteria used for model evaluation, coefficient of determination and the Nash-Sutcliffe simulation efficiency values, showed that the SWAT model simulates the stream flow appreciably well for the study area. |
| 2. Hydrological impact of future climate change scenarios indicate that increase in the annual precipitation, surface runoff, water yield and actual evapotranspiration. However no substantial change have been indicated in these parameters by the model runs in 2020s (2011-2040) [18]. |
| Acknowledgements |
| Authors are thankful to Prof. B. N. Goswami, Director, IITM Pune and Dr. R. Krishnan, Executive Director, Centre for Climate Change Research, IITM, Pune for their keen interest and encouragement for carrying out the study. Thanks are also due to the anonymous reviewers whose suggestions helped us to improve this manuscript to a great extent. |
References
|
Tables and Figures at a glance
| Table 1 |
Figures at a glance
 |
 |
 |
 |
 |
| Figure 1 | Figure 2 | Figure 3 | Figure 4 | Figure 5a |
 |
 |
 |
 |
| Figure 5b | Figure 6 | Figure 7 | Figure 8 |
Relevant Topics
- Atmosphere
- Atmospheric Chemistry
- Atmospheric inversions
- Biosphere
- Chemical Oceanography
- Climate Modeling
- Crystallography
- Disaster Science
- Earth Science
- Ecology
- Environmental Degradation
- Gemology
- Geochemistry
- Geochronology
- Geomicrobiology
- Geomorphology
- Geosciences
- Geostatistics
- Glaciology
- Microplastic Pollution
- Mineralogy
- Soil Erosion and Land Degradation
Recommended Journals
Article Tools
Article Usage
- Total views: 16604
- [From(publication date):
September-2014 - Jul 13, 2025] - Breakdown by view type
- HTML page views : 11567
- PDF downloads : 5037
