Artificial Neural Network Modelling to Predict PM2.5 and PM10 Exhaust Emissions from On-Road Vehicles in Addis Ababa, Ethiopia
Received: 23-Apr-2022 / Manuscript No. EPCC-22-61619 / Editor assigned: 26-Apr-2022 / PreQC No. EPCC-22-61619 (PQ); / Reviewed: 16-May-2022 / QC No. EPCC-22-61619; / Revised: 18-May-2022 / Manuscript No. EPCC-22-61619 (R); / Accepted Date: 27-May-2022 / Published Date: 27-May-2022 DOI: 10.4172/2573-458X.1000279
Abstract
Transport vehicles are the major sources of air pollution in the urban area. This study aims to investigate the level of roadside vehicularPM2.5 and PM10concentrations and their impact on urban air quality. In addition, artificial neural network model is used to predict the average 24 hours concentrations ofPM2.5 and PM10in the capital city of Ethiopia. For the prediction, the model uses relative humidity, temperature, wind speed, wind direction, traffic volume and data of concentrations ofPM2.5 and PM10collected from 15 different sites in city. This model trained, using Levenberg Marquardt and Scaled Conjugate Gradient Algorithm training functions, to define the finest fractional error between the measured and the predicted value. The performance of the model is determined using coefficient of correlation. It is found that the proposed model could predict exhaust emissions with an average coefficient correlation of 0.948 forPM2.5 and 0.959 for PM10. The results show that Levenberg Marquardt algorithm functions have a better coefficient of correlation and this could be considered as an alternative option to evaluate the exhaust emission concentration. The acquired results indicate that the above input data can be used to accurately predict the particulate matter concentrations in the city.
Keywords
PM prediction; Artificial Neural Network; Roadside emission; Addis Ababa
Highlights
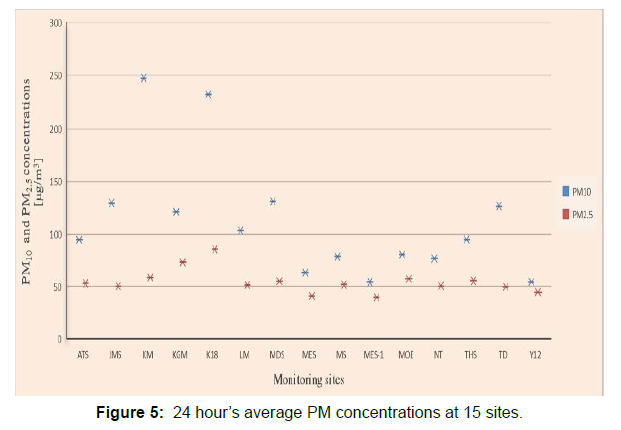
a. Addis Ababa city daily average mean concentrations of PM10lie between 54.21 (±5.81) to 247.36 (±37.32) μg/m3 and 39.59 (±4.13) to 85.34 (±11.86) μg/m3 forPM2.5
b. Relative humidity, temperature, wind speed, wind direction, and traffic volume is input data for the model
c. Predicting exhaust emission particles using ANN modeling in MATLAB
d. The results show that Levenberg Marquardt algorithm functions have a better coefficient of correlation than Scaled Conjugate Gradient
Nomenclature
ANN Artificial Neural network
AQI Air Quality Index
M Meter
MAE Mean Absolute Error
MLP Multilayer Perceptron
MSE Mean Square Error
PM Particulate Matters
PMES Portable Measuring Emission System
R Correlation Coefficient
RMSE Root Mean Square Error
WHO World Health Organization
Introduction
Particle matters released to the roadside, in an urban environment, originates from vehicle exhaust or non-exhaust emissions. However, the particle emitted from the vehicle exhaust tailpipe are influenced by fuel property, oil consumption, fuel introduction mechanism, combustion process, engine size, road gradient, driving condition, mileage of the vehicles and so on. Non-exhaust sources include tire wear, road surface wear, corrosion, and resuspension [1,2]. Consequently, released particles seriously affect the surrounding environment as well as the globe. A recent study shows that, globally,PM2.5 accounts to about 4.2 million deaths and the 5th risks factor among all worldwide death factors, including smoking, diet, and high blood pressure. In addition, many research indicates that air pollution aggravates rates of cardiovascular disease and stroke and disturbs human health [3].
In Ethiopia, air pollution research is limited and still, now it assumed generally the concentrations as low [4]. However, a few studies done in different parts of the country, indicate that air pollution is progressively becoming a health concern due to high concentrations of indoor as well as traffic-related and other ambient air pollutant emissions [5, 6]. A recent national situational analysis and needs assessment report disclosed that health and environment linkage has a weak relationship. However, the report pinpointing air pollution as one of the important policy priorities in Ethiopia [7].
Modern motor vehicles are equipped with different emission controlling technologies. Despite advances in emissions control technologies, for diesel and gasoline engine, vehicle pollution is still a vital concern in air pollution in urban areas. To examine emission levels generally, there are two methods; real-world road traffic test and dynamometer test. Dynamometer determines emission factors of specific engines but cannot address a vehicle with different ages, cumulative mileage, load, road condition, and engine capacity, etc. that exists in real traffic conditions [8]. Therefore, for this work to achieve its goal, traffic data, meteorological data, and pollutant data were collected from roadside experimental tests using a portable emission monitor.
This paper aims to investigate the level of roadside vehicular PM2.5 and PM10concentrations and its impacts on urban air quality. In addition, the collected data are also used to predict the 24 hours concentrations ofPM2.5 and PM10in the city of Addis Ababa using an ANN model. For estimating health adverse effects and monitoring purposes, the PM is measured and categorized by their aerodynamic diameter into two main categories of particles, PM10andPM2.5 [9].
Monitoring of particle concentrations with PEMs methods is an important task due to the reconnaissance of air quality standards. However, due to the high cost of the monitor, doing research in a country like Ethiopia is challenging. Various modeling methods can address such limitations and can be used as an alternative option [10].
Many research outputs stated that ANN is a powerful and useful modeling tool that has the ability to recognize complex relationships from input-output data [11, 12]. Collections of data regarding exhaust emissions from on-road vehicles cases are time-consuming and expensive. Alternatively, the performance and vehicular particle concentrations of a roadside depending on traffic volume, relative humidity, temperature, wind speed, and wind direction of the selected sites can be modeled using ANNs, which allow the modeling of complex physical phenomena without requiring explicit mathematical representations.
In this work, using the experimental test results, the average concentrations ofPM2.5 and PM10emissions from 15 sites of Addis Ababa city between October 16 and November 23, 2018, are evaluated. The output is compared with Ethiopian, Air Quality Index, and World Health Organization standards. Moreover, the proposed ANN modeling predicts the output of the system as long as enough experimental data for training, validating and testing. Then by creating an ANN model using MATLAB, On-roadside vehiclesPM2.5 and PM10emissions concentrations for 24 hours can be predicted.
Material And Methods
Study area Addis Ababa is the political, economic and industrial center of Ethiopia that covers 527 square kilometers of area. It is located at 9° 01’ 29.89” North latitude, and 38° 44’ 48.80” East longitude, and has 10 sub-cities. It has an approximate 6.5 million residents, and its average altitude is 2,500 meters above sea level [12]. Vehicle ownership demand in Ethiopia shows a vast increment with time. Among the total number of vehicles of the country, 62% are being used in Addis Ababa and it is believed that this has contributed to high pollution. Besides; the ministry of Forest, climate and environment commission report indicates that the amount of carbon dioxide, carbon monoxide, nitrogen, and other toxic gases has increased in and around the city [13].
Roadside exhaust emission measurements
By measuring the PM concentrations in roadside it is possible to calculate exhaust emission concentration levels for a given site [14]. Exhaust emissions concentration data was collected using Aeroqual series-500 digital analyser. Aeroqual is an optical particle counter instrument which has portable air quality monitor and the sensor head works at a range of 0.001-1.000 mg/m3 with an accuracy of ± 0.005 mg/m3 +15%, resolution of mg/m3 [15]. This apparatus is designed for portable emission measurement that can measure simultaneouslyPM2.5, PM10, relative humidity, and temperature.
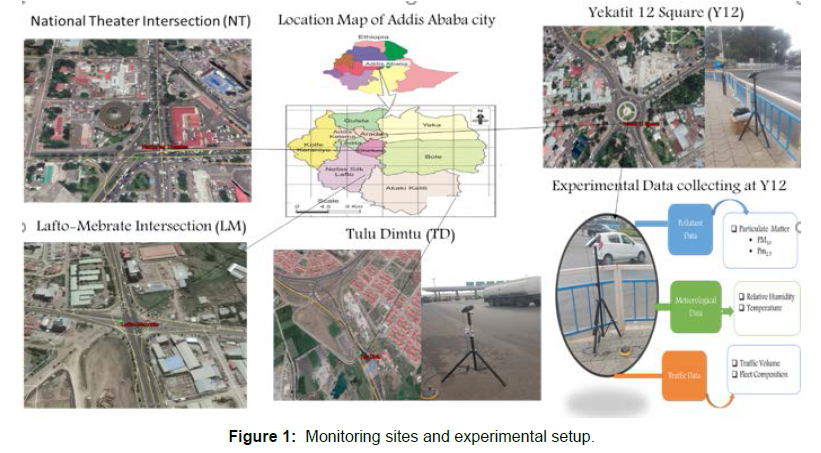
The emission sample was collected from 15 sites. The apparatus was mounted 1 meter far from the roadside and 1.5 meter above the ground considering to the wind direction on each selected road a total of 360 hours of data collection was done. Some of the monitoring sites and apparatus setup as shown in figure 1.
Traffic and weather data
A traffic census, by manual counting, was conducted in the study area at 4-hour interval for a period of 24 hours in all sites. In addition, secondary data were gathered for a few stations from Addis Ababa traffic management office. Weather-related data as relative humidity and temperature were measured simultaneously every minute. In addition, all meteorological data, including wind speed, wind direction, temperature, and relative humidity for the selected area was extracted from meteoblue online access [16].
Artificial neural network method
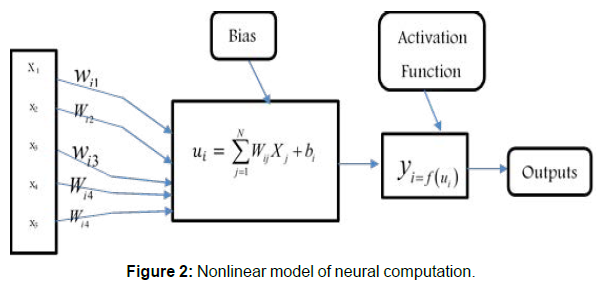
In this study, by using SPSS 25 package, the statistical conformity of the data like analysis of variance, coefficient of variation, mean and standard deviations are carried out. Finally, by creating an Artificial Neural Network model, roadside emissions concentrations are predicted using MATLAB software (Figure 2).
ANN model is a mathematical model inspired by the biological neurons [11], and are used to compute a complex and non-linear function. ANN is an effective optional statistical technique for predicting time series [17].
Artificial neural network models are universal estimators with the ability to generalize through learning non-linear relationships between provided variables of inputs and outputs. ANN is interconnected processing elements known as neurons or nodes that are arranged in layers. These layers contain an input layer, one or more hidden layers and an output layer which is connected to each neuron to the next layer neural network system with the weights; the inputs multiplied by the corresponding weight of the neuron connection based on its relative importance before entering the hidden layer [11]. The data transfer is allowed only to the next consecutive layer. Each node of the hidden layer receives the incoming signals from the nodes of the input layer. The total input signal u is calculated as follows:

The aim of all ANN models is to bargain the unknown functional relationship between W and X which links the input vectors in X to output vectors in Y using an activation function [17]. The forecasting ability of ANNs results from training in experimental data and following validation with independent data [18]. Each neuron contains, x1, x2,xn inputs added to a weight wij that indicates the link strength of a particular input for each connection, weight bias, and activation function.
Proposed neural network architecture model
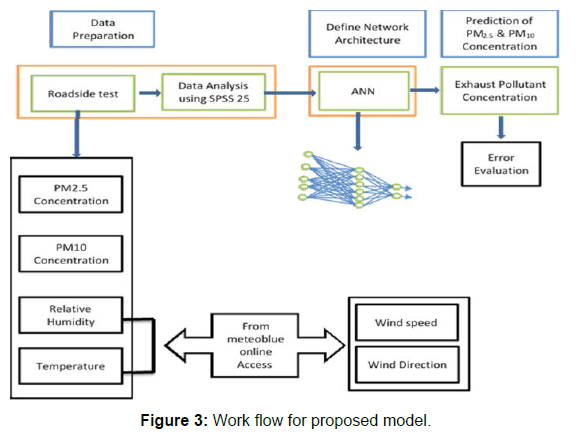
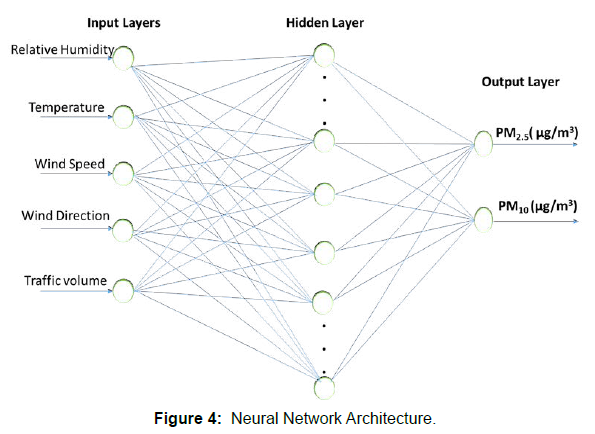
In this proposed model, a Multilayer Perceptron (MLP) is selected as the basis of the ANN models to predict mass concentrations ofPM2.5 and PM10with respect to the input data. The MLP is the often-used ANN model architecture applied for supervised learning problems [20] and has found to perform well for applications like the prediction of air pollutant concentrations [21]. The method used to train on a set of input-output variables and learn to model the correlation between those inputs and outputs. The training involves fine-tuning the parameters or the weights and biases of the model in order to diminish error. Back propagation method is used to make those weight and bias modifications relative to the error and the error itself can be measured in a variety of ways, including root mean squared error (RMSE), Mean absolute error (MAE), Mean square error (MSE), and correlation coefficient (R) [22]. In this study, a MLP containing three single layers (one input layer, one hidden layer, one output layer) was used for all ANN models developed. The details of the model is shown in (figures 3 and 4).
Input variable selection
Selecting the input variable is the crucial steps in ANN model development. Hence, the input selection procedure considers the significance of the input that should be justified using an Adhoc approach based on a prior knowledge considering the state of the problem and available data. Road transport emissions are interrelated to the volume of traffic, vehicle type, road gradient, weather condition, etc. [24]. Generally, the input variables are traffic volume, hourly average temperature 2 m above ground, relative humidity 2 m above ground, wind speed 10 m above ground, wind direction 10 m above ground PM concentrations are used to develop the model.
In this work, among various types of ANN approaches, the feedforward learning algorithm is used. In developing the ANN model, the available data set was divided into two sections, one to be used for training of the network (70% of the data), 15% for testing and 15% for validation of the network. Experimental results obtained from the field measurement are used to train, validate and test the ANN model. Using Sigmoid Symmetric activation function via Levenberg Marquardt and scaled conjugate gradient descent algorithm technique, the predictive value is compared with the measured value. Finally, the results obtained from the neural network based on their coefficient of correlation (R) between the targets and the output values, show which algorithm works better in ANN.
Data quality assurance
To get quality data, the accuracy of the monitoring tool and methods of data collections has their own effect. To assure this, the data collector continuously supervised the instrument on the spot. The accuracy of the monitor was crosschecked periodically, with the same monitor borrowed from Ministry of Forest, Environment and Climate Change. In addition, to confirm accuracy of the meteorological data additional weather data are mined from meteoblue.
Evaluating performance of the model
Performance of the ANN models was evaluated through the following statistical performance indicators; the Root Mean Square Error (RMSE), the Mean absolute Error (MAE), Mean Square Error (MSE), and correlation coefficient (R) defined as follows :-
The RMSE was mainly used in the development process of the ANN model and represents residual errors, which gives a global perspective of dissimilarity between the observed and predicted values [19].

Mean absolute error measures the deviation of predicted versus the measured value where all individual differences have equal weight without considering their direction [19].

MSE is a calculated measure the average of the squares of the errors that is; the average scores between the prediction and actual values [19].

The correlation coefficients (R) are often used in the linear regression to know how strong is the relationship between the predicted and actual values [20].

Where Cm is the measured value at a given time i, 𝐶𝑝 is a predictparticle concentrations value at the time i and N is the total number of observations, respectively.
Results and Discussion
The monitoring result indicates that the hourly concentrations of bothPM2.5 and PM10emissions vary from site to site. It shows variation with respect to traffic volume and weather condition. The daily average PM concentrations of the two particles measured at15 sites in Addis Ababa is represented as shown in figure 5.
The average daily mean concentrations of PM10lies between 54.21 (±5.81) to 247.36 (±37.32) μg/m3. In most of the sites, the average PM10concentrations were under both Ethiopia and AQI limit value of 150 μg/m3 24 hours mean. However, except one site, on average, almost all measured values were more than 2.2 times higher than the WHO limit value of 50 μg/m3. The daily averagePM2.5 concentrations of the selected area were lies between 39.59 (±4.13) to 85.34 (±11.86) μg/m3. However, in all sites, the mean concentrations ofPM2.5 were higher than AQI (35 μg/m3), and WHO (25 μg/m3) 24 hours mean limit value. In addition, the difference is almost on average, 2.2 times higher than with WHO and 1.6 times higher than AQI target value. These indicate that the level ofPM2.5 measured far exceeds the two emissions standard mean limit value. This is because of the non-functionality of an emission controlling system, fuel quality, lack of controlling program, high traffic chocked; road quality, age, and mileage of vehicles are the main reason [21].
Currently, the urban area is polluted due to high vehicular exhaust emissions, thus highly alleged for a possible negative effect on human health like asthma and other respiratory diseases, especially for more susceptible groups of the population, such as old age, children and people with other health’s problems [22].
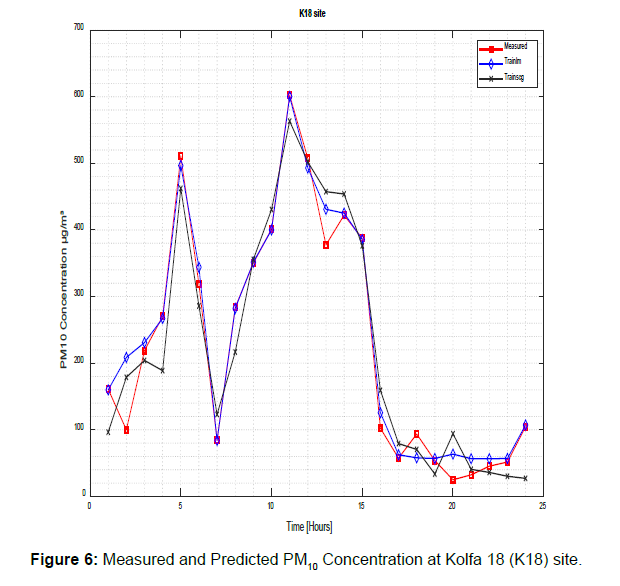
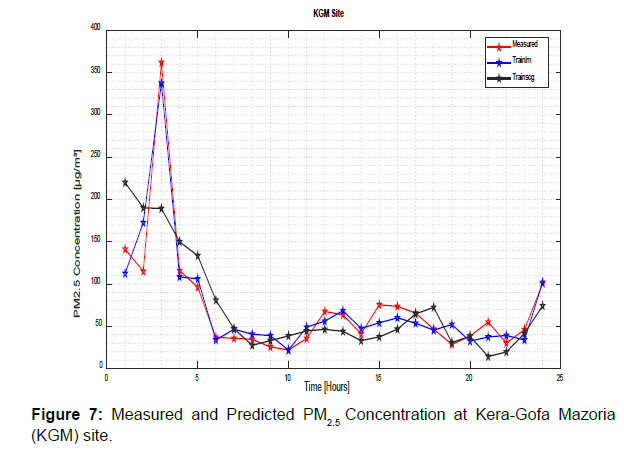
Using the ANN model, prediction was performed for all sites by using the two training methods Levenberg Marquardt and scaled conjugate Gradient training function was used to provide optimization between the two models. As a result, the ANN predictions for the target value of the exhaust emissions concentrations versus the measured data were associated. The predicted versus measured values for the two particles emissions concentrations are shown in figure 6 and 7.
Figure 6 shows that the measured versus predicted PM10concentrations using Levenberg Marquardt algorithm (Trainlm) as a training function obtained R-value 0.9881 and using scaled conjugate Gradient (Trainscg) training functions R-value 0.9642 at K18 site.
Similarly, Figure 7 shows that the measured & predictedPM2.5 concentration for Trainlm and Trainscg methods, and the obtained R-value were 0.9111 and 0.7338 at KGM site.
Both PM exhaust emission concentrations increased at peak traffic density. However, relative humidity, temperature, wind direction, and wind speed have an effect on the concentrations of particulate matter.
Using the two methods to provide optimization between the created artificial neural network models for all 15 sites the measured exhaust emissions data, and model output data will be correlated. As show table 1 evenberg Marquardt algorithm has better prediction performance results than Scale Conjugates Gradient methods.
| Name of the Sites | Obtained R Value | |||
|---|---|---|---|---|
| Levenberg Marquardt | Scaled conjugate Gradient | |||
| PM10 | PM2.5 | PM10 | PM2.5 | |
| Ayer Tena Square | 0.9553 | 0.9512 | 0.8949 | 0.8454 |
| Jemo Michael Intersection | 0.9318 | 0.923 | 0.8971 | 0.7001 |
| Kaliti Maseltegna | 0.9262 | 0.9365 | 0.863 | 0.8226 |
| Kera-Gofa Mazoria | 0.9671 | 0.9658 | 0.9111 | 0.7338 |
| Kolfa 18 | 0.9881 | 0.9631 | 0.9642 | 0.844 |
| Lafto-Mebrate | 0.9737 | 0.9613 | 0.942 | 0.8908 |
| Megenagna Diaspora Square | 0.9182 | 0.9397 | 0.9103 | 0.7114 |
| Meskel Square | 0.9561 | 0.9591 | 0.9253 | 0.929 |
| Menilik Square | 0.9313 | 0.9384 | 0.8956 | 0.8664 |
| Meskel Square -1 | 0.9749 | 0.9592 | 0.9406 | 0.867 |
| Ministry of education square | 0.9645 | 0.9469 | 0.9441 | 0.732 |
| National Theater | 0.9934 | 0.9757 | 0.9246 | 0.8451 |
| Torhyloch square | 0.9615 | 0.926 | 0.9827 | 0.9206 |
| Tulu Dimtu | 0.9645 | 0.9333 | 0.9662 | 0.8405 |
| Yekatit 12 Square | 0.9803 | 0.9466 | 0.9328 | 0.8003 |
Table 1: Obtained results from the model for 24 hour concentration.
Conclusions
This study shows that thePM2.5 & PM10emission concentration of Addis Ababa city is higher than the AQI & WHO limits value. Beside another research output, this study assured that Addis Ababa city vehicular pollution is higher through time.
ANN predictive models of vehicular exhaust emission are vitally important tools to fill the scarce with monitoring instruments. In addition, such research requiring enough data and financial demand, especially in developing country like Ethiopia is very difficult. In this study, the relationship betweenPM2.5 and PM10concentrations with meteorological variables (Relative humidity, temperature, wind speed, and wind direction) and traffic volume are correlated to predict the average 24 hours concentrations.
An ANN-based emission prediction model with Levenberg Marquardt algorithm versus scaled conjugate Gradient training function has been used in feed forward method. The arrangement of the layer is 5-6-1 (number of input layer-hidden layer-outputs layer nodes). The results show that Levenber Marquardt algorithm functions have a better coefficient of correlation and hence could be considered as an alternative option to evaluate the exhaust emission concentration.
Acknowledgements
We would like to thank Ecole Centrale Nantes, Campus France, Addis Ababa Road Traffic Management agency, Meteoblue, and Arba Minch University support this work in providing traffic data, meteorological data, and financial support.
References
- Garg BD, Cadle SH, Mulawa PA, Groblickin PJ, Laroo C, et al. (2000) Brake Wear Particulate Matter Emissions. Environ Sci Technol 34: 4463-4469.
- Penkała M, Ogrodnik P, Rogula-Kozłowska W (2018) Particulate Matter from the Road Surface Abrasion as a Problem of Non-Exhaust Emission Control. Envir 5: 9.
- https://www.ccacoalition.org/en/resources/state-global-air-2017-special-report-global-exposure-air-pollution-and-its-disease-burden
- Tefera W, Asfaw A, Gilliland F, Kumie A, Worku A, et al. (2016) Indoor and Outdoor Air Pollution- related Health Problem in Ethiopia: Review of Related Literature. Ethiop J Health Dev 30: 5-16.
- Alemayehu M, Alemu K, Sharma HR, Gizaw Z, Shibru A, et al. (2014) Household Fuel Use and Acute Respiratory Infections in Children Under Five Years of Age in Gondar city of Ethiopia. JEES 4: 77-85.
- Keil C, Kassa H, Brown A, Kumie A, Tefera W (2010) Inhalation exposures to particulate matter and carbon monoxide during Ethiopian coffee ceremonies in Addis Ababa: a pilot study. J Environ Public Health 2010: 213960.
- Getu Shikr (2010)Situation analysis and needs assessement (SANA) on the Libreville Declaration on Health and Environment Interlinkage country report, Ethiopia
- Hung-Lung C, Yao-Sheng H (2009) Particulate matter emissions from on-road vehicles in a freeway tunnel study. Atmos Environ4014-4022.
- https://www.euro.who.int/en/health-topics/environment-and-health/air-quality/publications/pre2009/who-air-quality-guidelines-for-europe,-2nd-edition,-2000-cd-rom-version
- Cirak B, Demirtas S (2014) An Application of Artificial Neural Network for Predicting Engine Torque in a Biodiesel Engine. Am. J. Energy Res 2: 74-80.
- Aydin M, Yavuz A, Sorusbay C (2018) Application of Artificial Neural Network to Predict Exhaust Emissions from Road Transport. Int J Sci Res 4: 13-22.
- https://worldpopulationreview.com/world-cities/addis-ababa-population
- http://www.ena.gov.et/en/index.php/environment/item/2719-amount-of-green-house-gases-increasing-in-addis-ababa
- Timmers VRJH, Achten PAJ (2016) Non-exhaust PM Emissions from electric vehicles. Atmos Environ 134: 10-17.
- Williams R, Kilaru V, Snyder E, Kaufman A, Dye T, et al. (2014) Air Sensor Guidebook. United states Environmental Protection Agency.
- https://www.meteoblue.com/fr/meteo/semaine/addis-abeba_%C3%89thiopie_344979
- Gardner MW, Dorling SR (1999) Neural network modelling and prediction of hourly NOx and NO2 concentrations in urban air in London.Atmos Environ 33: 709-719.
- Coudray N, Dieterlen A, Roth E, Trouvé G (2009) Density measurement of fine aerosol fractions from wood combustion sources using ELPI distributions and image processing techniques. Fuel 88: 947-954.
- Paas B, Stienen J, Vorländer M, Schneider C (2017) Modelling of Urban Near-Road Atmospheric PM Concentrations Using an Artificial Neural Network Approach with Acoustic Data Input. Envir 4: 26.
- Aydin M, Yavuz A, Sorusbay C (2018) Application of Artificial Neural Network to Predict Exhaust Emissions from Road Transport. Int J Sci Technol Res 4: 11.
- Baskin A (2018) Africa Used Vehicle Report. African Clean Mobility week.
- Habeebullah TM (2013) Health Impacts of PM10Using AirQ2.2.3 Model in Makkah. J Basic Appl9: 268-268.
Indexed at, Google Scholar, Crossref
Indexed at, Google Scholar, Crossref
Indexed at, Google Scholar, Crossref
Indexed at, Google Scholar, Crossref
Indexed at, Google Scholar, Crossref
Indexed at, Google Scholar, Crossref
Indexed at, Google Scholar, Crossref
Citation: Jida SN, Jean-François H, Chesse P (2022) Artificial Neural Network Modelling to Predict PM2.5 and PM10 Exhaust Emissions from On-Road Vehicles in Addis Ababa, Ethiopia. Environ Pollut Climate Change 6: 279. DOI: 10.4172/2573-458X.1000279
Copyright: © 2022 Jida SN. This is an open-access article distributed under the terms of the Creative Commons Attribution License, which permits unrestricted use, distribution, and reproduction in any medium, provided the original author and source are credited.
Share This Article
Recommended Journals
Open Access Journals
Article Tools
Article Usage
- Total views: 1757
- [From(publication date): 0-2022 - Apr 03, 2025]
- Breakdown by view type
- HTML page views: 1303
- PDF downloads: 454

