Research Article Open Access
Application of CPE-FAAS Methodology for the Analysis of Trace Heavy Metals in Real Samples using Phenanthraquinone Monophenyl Thiosemicarbazone and Triton X-114
Magda Akl A*, Magdy Bekheit M and Ibraheim Helmy
Faculty of Science, Mansoura University, Mansoura, Egypt
- *Corresponding Author:
- Magda Akl A
Faculty of Science, Mansoura University,
Mansoura, Egypt.
E-mail: magdaakl@yahoo.com
Received date: June 11, 2016; Accepted date: June 27, 2016; Published date: July 04, 2016
Citation: Akl MA, Bekheit MM, Helmy I (2016) Application of CPE-FAAS Methodology for the Analysis of Trace Heavy Metals in Real Samples using Phenanthraquinone Monophenyl Thiosemicarbazone and Triton X-114. J Anal Bioanal Tech 7:325. doi:10.4172/2155-9872.1000325
Copyright: © 2016 Akl MA, et al. This is an open-access article distributed under the terms of the Creative Commons Attribution License, which permits unrestricted use, distribution, and reproduction in any medium, provided the original author and source are credited.
Visit for more related articles at Journal of Analytical & Bioanalytical Techniques
Abstract
In the present study, a cloud point extraction method was used for the preconcentration and extraction of cadmium (II) and zinc (II) ions in different environmental samples. The zinc and cadmium ions formed hydrophobic complexes with phenanthraquinone monophenyl thiosemicarbazone (PPT). These complexes were extracted using Triton X-114 nonionic surfactant. The surfactant-rich phase was diluted with acidified methanol. Then, the concentrations of the metal ions were determined by FAAS. The experimental factors controlling the process of separation are investigated e.g., pH, complexing agent concentration, surfactant's concentration, temperature, and incubation time. The present CPE-FAAS procedure has been used to preconcentrate and determine Cd(II) and Zn(II) metal ions in natural water samples, drug samples and certified reference materials. The LODs for cadmium(II) and zinc(II) ions were 0.38 and 1.85 μg/L, respectively with a preconcentration factor of 100. The recovery % of the extracted Cd(II) and Zn(II), is greater than 90% and the relative standard deviation(RSD,%) is less than 5%.
Keywords
CPE; Zinc(II); Cadmium(II); Surfactants; FAAS
Introduction
Heavy metals in the environment are really increasing due to human activity, particularly mining process and heavy industry in the developing world. This has caused great accumulation of high concentrations of toxic heavy metals in natural waters [1].
Monitoring the presence of toxic trace metals in different matrices is of great importance in order to evaluate the exposure to these heavy metals in the environment. In this sense, cadmium is considered as one of the most toxic elements; it accumulates in humans body mostly in the kidneys and liver and is classified as a rampant toxic element with biological half-life time in the range of 10-30 years [2].The maximum allowable concentration of cadmium permitted by the American Environmental Protection Agency (US EPA) in standard drinking water is 10 μg L-1.
Zinc is considered as an essential micro-nutrient that has many biochemical functions in all living organisms [3]. Deficiency of zinc can lead to many disorders such as growth retardation, diarrhea, inefficient immunological defense, eye and skin lesions, delaying ofwound healing and other skin diseases [4].Excess amounts of zinc are harmful and can be toxic when exposures exceed the physiological needs.
Monitoring trace element levels in environmental samples might be considered a difficult analytical task, mostly because of the complexity of the matrix and the very low concentrations of these elements, which requires a prior preconcentration step followed by sensitive instrumental techniques[5].Many separation/preconcentration techniques have been developed for trace metal analysis such as solid phase extraction [6], liquid- liquid extraction [7], co-precipitation [8], column extraction [9], ion-selective electrode [10]and cloud point extraction (CPE) [11-16].
Cloud point extraction(CPE) has attracted a great attention because it complies with the “Green Chemistry” principle [17]. CPE is simple, highly efficient, cheap, rapid and of lower toxicity than those procedures using organic solvents.
Cloud point extraction (CPE) is based on the phase behavior of non-ionic surfactants in aqueous solutions. Non-ionic surfactants undergo phase separation upon raising the temperature or the addition of a salting-out agent [18,19]. This procedure has been successfully employed to extract and preconcentrate different trace metals from different samples [21-23].
In recent years, considerable attention has been paid to the use of chelating agents, containing sulphur and nitrogen in analytical chemistry, in separation, purification and estimation of metal ions [24]. The extensive application and rapid growth in the popularity of sulphur ligands is because of their outstanding property as potential donors to form stable and characterized complexes. In addition, the presence of nitrogen along with sulphur tends to reduce the solubility of the complexes, making the isolation of these complexes easier.
Among various organic chelating reagents containing S and N, thiosemicarbazones and their aromatic derivatives occupy a unique place. Thiosemicarbazones are a group of organic compounds prepared by condensing thiosemicarbazide with carbonyl compounds in the presence of few drops of glacial acetic acid. These organic reagents function as good complexing agents and form complexes with various metal ions through thionate Sulphur atom and hydrazine nitrogen atom binding sites.
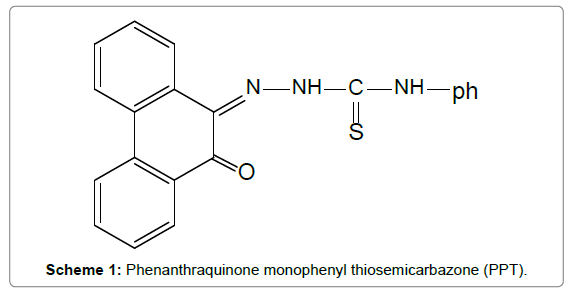
Phenanthraquinone monophenyl thiosemicarbazone (PPT) reacts with different metal ions such as Ni(II), Zn(II), Cu(II), Cd(II) and Pb(II) to form hydrophobic colored complexes. These metal ions were further determined in media of diverse origin by FAAS and/or ultraviolet-visible (UV-Vis) spectrophotometry [25-28].
In the present work, CPE method has been used for the preconcentration of zinc and cadmium after the formation of hydrophobic complexes with phenanthraquinonemono phenyl thiosemicarbazone (PPT). These complexes were simply extracted using Triton-X114 nonionic surfactant followed by FAAS determination. The analytical conditions for the preconcentration, extraction and FAAS determination of the analytes were investigated. The proposed combined CPE-FAAS methodology was successfully used for the analysis of zinc(II) and cadmium(II) in water, drug and certified samples.
Experimental
Instruments
A Perkin-Elmer 2380 air-acetylene atomic absorption spectrometer has been used for the determination of Cd(II) and Zn(II) concentrations. To measure the pH of sample solutions, a digital pH meter was used.
Chemicals
All the chemicals used in the presented study are of analytical-reagent grade. Double distilled water (DDW) was used through. Zinc stock solution (1000 mgL-1) was prepared by dissolving 2.089g ZnCl2 in 100 ml of water with the addition of 2 ml of concentrated HCl and dilution to 1 L with bidistilled water. Cadmium stock solution (1000 mgL-1) was prepared by 2.03 g of CdCl2.2.5 H2O in 1L DDW. Triton X-144 was obtained from Sigma. To prepare a 1% (v/v) Triton X-114 stock solution, 1 mL of Triton X-114 is dispersed in 5mL ethyl alcohol and completed with 100 ml DDW.
Phenanthraquinone monophonyl thiosemicarbazone, PPT was synthesized as previously reported [26]. A 10-2 mol. L-1 solution of PPT was prepared by dissolving 0.357 gm of phenanthraquinone monophenyl thiosemicarbazone (PPT) in 100 ml of acetone.
Analytical procedure
An aliquot of 20 ml of aqueous solution that contains 3μg mL-1of metal ions, 2×10⁻⁴mol. L-1 of PPT and 0.05% (v/v) of Triton X-114 at pH 6 was prepared (Scheme 1). This mixture was shaken for 1 minute and left to stand for 20 minutes in water bath at 60°C. Centrifugation at 3500 rpm for 10 minutes was performed to achieve separation of the two phases.Upon cooling in an ice bath for 15 minutes, the surfactant-rich phase became viscous and the mother aqueous phase was smoothly separated.The micellar phase is dissolved in 0.2 mL of acidified methanol and aspirated directly to the flame to determine the concentration of the investigated metal ions.
Calibration curves were constructed in the concentration ranges 0.40-2.0 mg/l and the concentrations of the investigated metal ions were determined by FAAS at specified wave lengths for each analyte.
For determination of zinc(II) in pharmaceutical samples, two commercial drug samples were selected viz., Vitamax plus and Totavit tablets. The samples were brought into solution using the procedure previously described in the literature[28].
Results and Discussion
Cloud point extraction (CPE)
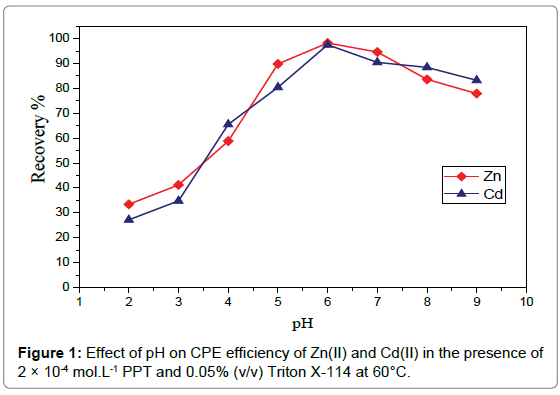
Effect of pH: The pH is a very important parameter for both the coacervation of the micelles and the complexation of the ligand with the metal ions. The influence of pH on analytes extraction was investigated by performing a number of CPE experiments and varying the pH of sample solution over a wide range (2 -9) using 3μg mL-1of Zn(II) and 3μg mL-1 of Cd(II) in the presence of 2×10⁻⁴molL-1PPT and 0.05% (v/v) Triton X-114. As it can be seen from Figure 1, the maximum recovery was achieved at pH 6.
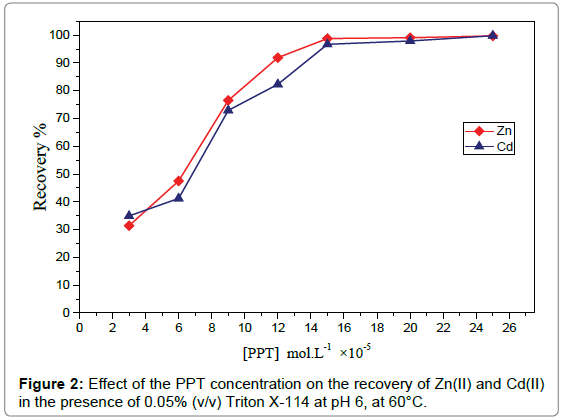
Effect of PPT concentration: The CPE efficiency depends on the hydrophobicity of the ligand and the complex formed. So, in order to evaluate the role of PPT in CPE of Zn(II) and Cd(II), similar CPE experiments were performed by adding different concentrations of PPT to a suitable concentration,3μg mL-1of Zn(II), 3μg mL-1 of Cd(II) and 0.05% (v/v) Triton X-114 at pH6.Figure 2 shows that, at low PPT concentration, the recovery of the analytes is low because the amount of ligand required for complexation of all the amount of the analytes is insufficient. Then, the recovery significantly increases by increasing PPT concentration till maximum recovery was attained at 1.5×10⁻⁴mol. L-1 PPT. The recovery of the analytes remains constant upon the use of higher concentrations of the chelating agent. So, 2×10⁻⁴molL-1PPT was selected for the subsequent work.
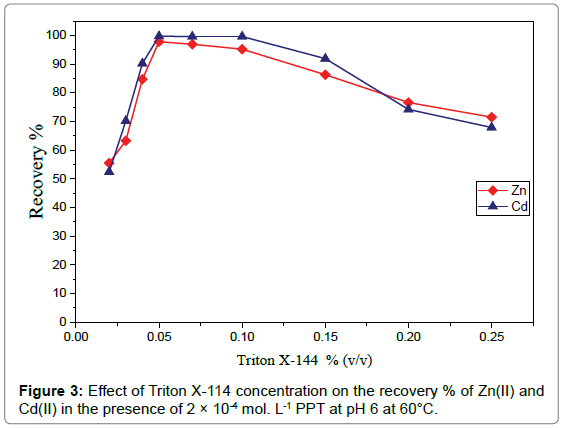
3 Effect of triton X-114 concentration: The effect of Triton X-114 concentration on the extraction efï¬ï¿½ciency of 3μg mL-1of Zn(II) and 3μg mL-1 of Cd(II) in the presence of 2×10⁻⁴molL-1 PPT at pH 6 was studied in the concentration range of 0.02-0.25% (v/v). In Figure 3, the results showed that, at low surfactant concentration the recovery of the analytes is poor because there are few surfactant molecules to entrap the ligand-metal complexes quantitatively [29]. Then, the recovery sharply increases by increasing the concentration of Triton X-114. The highest recoveries were obtained with 0.05% (v/v) Triton X-114. By increasing the surfactant concentration above 0.1% the recovery starts to decrease gradually.
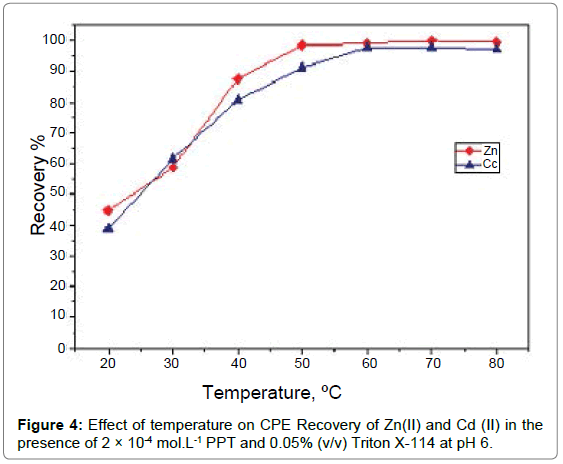
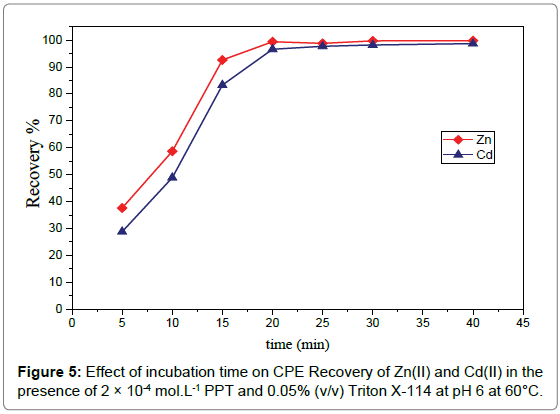
4Effect of temperature and incubation time: Like the other parameters, temperature and duration of the CPE procedure seem to play significant roles. Raising the incubation temperature above the cloud point temperature is an important factor for obtaining satisfactory extraction and enhancing CPE efficiency in a reduced incubation time. A series of experiments was performed to investigate the effect of temperature on the CPE method under the previous optimum conditions of pH, PPT concentration and Triton X-114 concentration over a wide range of temperatures (20-80°C) through 20 minutes’ incubation time. The data in Figure 4 shows that maximum recovery was obtained at range (50-80°C). The enhanced recovery at high temperature is related to the dehydration between hydrogen bonds that oc cur by increasing temperature and decrease amount of water in surfactant rich phase hence the volume of the phase decrease leading to enhancing the recovery. The effect of the incubation time, on the other hand, was investigated within the ranges 5-60 min. The results, Figure 5, illustrate that an equilibration time of 20 min was quite adequate to achieve quantitative extraction of cadmium(II) andzinc(II) ions [30].
Effect of centrifugation time and rate: For the best efficiency of the method, it is required to preconcentrate trace amount of metal ions with high sensitivity and in a short time. To test the influence of centrifugation time on the method sensitivity, CPE has been carried out for a series of experiments, in which an aliquot of 10 ml of aqueous solution containing 3μg mL-1of Zn(II) and 3μg mL-1 of Cd(II) in the presence of 2×10⁻⁴mol. L-1PPT and 0.05% (v/v) of Triton X-114 at pH 6 has been incubated at 60°C for 20 minutes and centrifuged at various rates(1500-4500 rpm) and for different time periods(5-20 min). The best conditions for sample centrifugation were 10 min at 3500 rpm.
Effect of foreign ions: Because of the high selectivity attributed to flame atomic absorption spectrometry, the only source of low sample recovery must be the preconcentration step. This problem may be attributed to the fact that cations may react with ligand and anions may form stable complex with metal ions and resulting in a decrease in extraction efficiency (Table 1).Therefore studying the effect of foreign ions was carried out using 3μg mL-1of Zn(II) and 3μg mL-1 of Cd(II) in the presence of an excess amount of PPT (5 ×10⁻⁴mol.L-1). The effect of almost foreign ions, even those which formed colored complexes with PPT such as Cu+2, Ni+2 and Pb+2, interference could be eliminated.
| Foreign ion | Concentration (mg. L-1) | Recovery % | |
|---|---|---|---|
| Zn(II) | Cd(II) | ||
| Hg+2 | 20 | 100 | 96.9 |
| Ni+2 | 10 | 100 | 97.7 |
| Co+2 | 20 | 97.9 | 98.4 |
| Cr+3 | 5 | 98.9 | 99.3 |
| Fe+3 | 10 | 99.8 | 98.5 |
| Cu+2 | 10 | 98.2 | 97.6 |
| Pb+2 | 10 | 99.7 | 99.2 |
| Ba+2 | 20 | 99.8 | 98.4 |
| Mn+2 | 20 | 100 | 96.8 |
| Bi+3 | 20 | 100 | 97.3 |
| Al+3 | 20 | 100 | 98.1 |
| Na+ | 230 | 98.8 | 97.9 |
| SO4- | 480 | 99.5 | 99.8 |
| Cl- | 177.5 | 97.9 | 99.6 |
| NO2- | 230 | 98.7 | 97.8 |
| NO3- | 310 | 98.1 | 100 |
| CO3-- | 300 | 97.2 | 96.8 |
| C2O4-- | 440 | 97.9 | 100 |
| CH3COO- | 295 | 98.8 | 98.5 |
Table 1: Effect of interfering ion on the recovery of Zn(II) and Cd(II) in the presence of 2× 10⁻⁴ PPT and 0.05 % (v/v) Triton X-114(n=5).
Analytical characteristics
To evaluate the reproducibility of the method, 20 mL of model solution containing metal ions (n=10) was used. The relative standard deviation (RSD, %) as precision of the method (RSD, %) was 1.86 and 3.06%, for Cd(II) and Zn(II), respectively (Table 2). The LODs based on three times the SD of the blank for cadmium(II) andzinc(II) ions were 0.38 and 1.85 μg/L, respectively (n=10). The regression equations and optimum concentration ranges for the metal ions are shown in Table 2.
| Analyte | Correlation coefficient | Linear range, mg/L | Regression equationa | RSD, % |
|---|---|---|---|---|
| Cd | 0.9997 | 0.40–1.50 | A=0.0471C | 1.86 |
| Zn | 0.9999 | 0.50–2.00 | A=0.0367C–0.00049 | 3.06 |
Table 2:Analytical characteristics of the calibration curves of the analytes.
To verify the accuracy and applicability of proposed CPE procedure, two reference standard materials (lead-zinc sulphide ore-OCrO (COD 161-96) and stream sediment SARM 52) were analyzed. The results are given in Table 3. There is no significant difference between the results obtained by the proposed method and the certified results. The relative standard deviation (as a precision) is less than 5%.
| ElementOre No. | Cd2+ | Zn2+ |
|---|---|---|
|
No. 1a |
|
|
|
( ), ppm |
0.950 |
120 |
|
|
±0.001 |
±1.70 |
|
m, ppm |
0.950 |
122.0 |
|
S |
0.02 |
2.4 |
|
|
0.00 |
1.86 |
|
RSD |
2.1 |
1.75 |
|
No. 2b |
|
|
|
( ), ppm |
ND |
1.25 |
|
|
|
±0.05 |
|
m, ppm |
- |
1.320 |
|
S |
- |
0.06 |
|
|
- |
2.50 |
|
RSD |
- |
4.30 |
 ): experimental value, (m) true value;
  : for P=0.05 and n=5 (4 degree of freedom)=2.78, from Ref.[29]. RSD; %: Relative standard deviation.
Table 3: Statistical evaluation for analysis of some certified reference samples after CPE (n=5). Comparison of experimental mean ( ) with true value (m) by
 test.
test.
Statistical analysis of the results in Table 3 indicate that the preconcentrated samples are not subject to any systematic error i.e., accurate.
Applications
Water analysis: Various water samples from different origins(Tap water, Nile river and sea water samples) were spiked with different amounts of cadmium and zinc and CPE procedures were employed for determination of the recovery of the analytes in these water samples, Table 4. The results of the present CPE method for Cd(II) and Zn(II) are in good comparison with those gained upon using the well-known APDC/MIBK solvent extractionmethod (SE), Table 5.
| Water sample | Cd(II) added (μg/ml) | Zn(II) added (μg/ml) | Recovery % | |
|---|---|---|---|---|
| Zn(II) | Cd(II) | |||
| Tap water (Our laboratory) |
5.00 | 5.00 | 98.9 | 99.1 |
| 10.00 | 10.00 | 98.8 | 99.7 | |
| Nile water (Mansoura city) |
5.00 | 5.00 | 99.3 | 98.5 |
| 10.00 | 10.00 | 99.7 | 99.3 | |
| Sea water (Ras El-Barr city) |
5.00 | 5.00 | 98.7 | 99.5 |
| 10.00 | 10.00 | 98.6 | 98.6 | |
Table 4: Recovery of Cd(II) and Zn(II) in different water samples(n=5).
| Sample | Cloud point extraction (PE) | Solvent extraction (SE) | ||||
|---|---|---|---|---|---|---|
| Cd(II), mgl-1 |
Zn(II), mgl-1 |
RSDs, % | Cd(II), mgl-1 |
Zn(II), mgl-1 |
RSDs,% | |
| Tap water (Our Lab Mansoura City) |
0.30 | 185 | 1.0-5.0 | 0.32 | 186.0 | 2.0-3.9 |
| Waste water (Meat Anter, Talkha) |
0.6 | 80 | 2.0-4.0 | 0.62 | 82.0 | 1.2-4.0 |
| Nile River water (Sherbin City) |
0.13 | 26 | 1.5-4.8 | 0.14 | 25.5 | 1.5-4.5 |
| Lake water (Manzalah) |
0.15 | 158 | 1.0-5.0 | 0.16 | 160 | 2.0-4.5 |
| Sea water (Ras Elbar city) |
0.12 | 30.0 | 2.0-4.0 | 0.11 | 31.5 | 1.0-5.0 |
Table 5: Determination of Cd(II) and Zn(II) in mgl-1 in natural water samples by the present cloud point extraction (CPE) and the standard APDC/MIBK solvent extraction methods (SE) (n=5 for both methods).
Analysis of pharmaceutical samples: Cloud point extraction followed by FAAS determination was applied to determine zinc in some commercialzinc containing pharmaceutical samples. The experimental results agreed well with the given reported values, Table 6.
| Sample | ( ) | m | S |  |
RSD, % |
|---|---|---|---|---|---|
| No. 1a |
14.95 |
15.0 |
0.05 |
1.5 |
4.2 |
| No. 2b |
15.02 |
15.0 |
0.02 |
1.95 |
2.8. |
Table 6: Statistical evaluation for analysis of some pharmaceutical vitamin samples after CPE (n=5).Comparison of experimental mean ( ), mg/capsule with true value (ï�), by
 test.
test.
Application to synthetic mixtures:An aliquot of 10 ml of aqueous sample solution containing different compositions of foreign metal ions(Co(II), Ni(II), Hg(II) and Bi(III), Cr(III) and Pb(II), different amounts of the analytes, 2×10⁻⁴mol L-1of PPT and 0.05% (v/v) of Triton X-114 at pH 6. The CPE procedures were performed under the previously mentioned optimum conditions and the recovery of the analytes were determined. The results obtained in Table 7 shows high extraction recovery of the analytes from samples containing different synthetic mixtures.
| Synthetic mixtures composition (μg/ml) | Zn(II) added (μg/ml) | Zn(II) found (μg/ml) | RSD % |
Cd(II) added (μg/ml) |
Cd(II) found (μg/ml) | RSD, % |
|---|---|---|---|---|---|---|
| Co+2(5μg/ml)+Ni+2(5μg/ml) | 2.00 | 2.97 | 0.81 | 2.00 | 2.94 | 0.88 |
| 5.00 | 4.96 | 1.25 | 5.00 | 4.89 | 1.11 | |
| Hg+2 (5μg/ml)+Pb+2(5μg/ml) | 3.00 | 2.87 | 0.48 | 3.00 | 2.93 | 0.37 |
| 5.00 | 4.94 | 1.03 | 5.00 | 4.87 | 0.67 | |
| Co+2(3μg/ml)+Ni+2(3μg/ml)+Cr+3(3μg/ml) | 3.00 | 2.91 | 0.41 | 3.00 | 2.97 | 1.34 |
| 5.00 | 4.95 | 0.70 | 5.00 | 4.90 | 1.08 | |
| Hg+2(3μg/ml)+Pb+2(3μg/ml)+Bi+3(3μg/ml) | 3.00 | 2.92 | 1.05 | 3.00 | 2.87 | 0.93 |
| 5.00 | 4.89 | 1.27 | 5.00 | 4.90 | 0.58 |
Table 7: Cloud point extraction of Cd(II) and Zn(II) from synthetic mixtures(n=3).
Conclusion
In the present study, a simple, low cost and reliable combined cloud point extraction-FAAS methodology using theTriton-X114 nonionicsurfactant has been used successfully for the determination of cadmium and zinc in water, vitamin and certified samples. The analytical characteristics of the proposed procedure (LOD, Recovery, % and RSD,%) are obtained. The limit of detection of cadmium and zinc gained is in good comparison or superior to the cloud point procedures reported in literature. Two certified reference materials were used to verify the accuracy of the proposed method.
References
- JaricZ, Visnjic-Jeftic G, Cvijanovic Z, Gacic L, Jovanovic S, et al. (2011) Determination of differential heavy metal and trace element accumulation in liver, gills, intestine and muscle of sterlet (Acipenserruthenus) from the Danube River in Serbia by ICP-OES. Microchemical Journal 98: 77-81.
- Davis C, Wu P, Zhang X, Hou X, Jones BT (2006) Determination of cadmium in biological samples. Applied Spectroscopy Reviews 41: 35-75.
- Ferreira HS, dos Santos WN, Fiuza RP, Nóbrega JA, Ferreira SL (2007) Determination of zinc and copper in human hair by slurry sampling employing sequential multi-element flame atomic absorption spectrometry. Microchemical Journal 87: 128-131.
- Scherz H, Kirchhoff E (2006) Trace elements in foods: zinc contents of raw foods-a comparison of data originating from different geographical regions of the world. Journal of Food Composition and Analysis 19: 420-433.
- Gundogdu C, Duran HB, SenturkElci L, Soylak M (2007) Simultaneous preconcentration of trace metals in environmental samples using amberlite XAD-2010/8-hydroxyquinoline system. ActaChimicaSlovenica 54: 308.
- Ansari R, Kazi TG, Jamali MK, Arain MB, Sherazi ST, et al. (2008) Improved extraction method for the determination of iron, copper, and nickel in new varieties of sunflower oil by atomic absorption spectroscopy. J AOAC Int 91: 400-407.
- Chand R, Watari T, Inoue K, Kawakita H, Luitel HN, et al. (2009) Selective adsorption of precious metals from hydrochloric acid solutions using porous carbon prepared from barley straw and rice husk. Minerals Engineering 22: 1277-1282.
- Kagaya S, Takata D, Yoshimori T, Kanbara T, Tohda K (2010) A sensitive and selective method for determination of gold(III) based on electrothermal atomic absorption spectrometry in combination with dispersive liquid-liquid microextraction using dicyclohexylamine. Talanta 80: 1364-1370.
- Soylak M, Tuzen M (2008) Coprecipitation of gold(III), palladium(II) and lead(II) for their flame atomic absorption spectrometric determinations. J Hazard Mater 152: 656-661.
- Hu Q, Yang X, Huang Z, Chen J, Yang G (2005) Simultaneous determination of palladium, platinum, rhodium and gold by on-line solid phase extraction and high performance liquid chromatography with 5-(2-hydroxy-5-nitrophenylazo)thiorhodanine as pre-column derivatization regents. J Chromatogr A 1094: 77-82.
- Gupta VK, Goyal RN, Sharma RA (2009) Comparative studies of ONNO-based ligands as ionophores for palladium ion-selective membrane sensors. Talanta 78: 484-490.
- da Silva MAM, Frescura VLA, Curtius AJ (2001) Determination of noble metals in biological samples by electrothermal vaporization inductively coupled plasma mass spectrometry, following cloud point extraction. SpectrochimicaActa Part B: Atomic Spectroscopy 56: 1941-1949.
- Dalali N, Javadi N, Agawal YK (2008) On-line incorporation of cloud point extraction in flame atomic absorption spectrometric determination of silver. Turkish Journal of Chemistry 32: 561-570.
- Fan Z, Bai F (2007) Determination of trace amounts of silver in various samples by electrothermal atomic absorption spectrometry after sample preparation using cloud point extraction. Atomic Spectroscopy-Norwalk Connecticut 28: 30.
- Ghaedi M, Shokrollahi A, Niknam K, Niknam E, Najibi A, et al. (2009) Cloud point extraction and flame atomic absorption spectrometric determination of cadmium(II), lead(II), palladium(II) and silver(I) in environmental samples. J Hazard Mater 168: 1022-1027.
- Manzoori JL, Abdolmohammad-Zadeh H, Amjadi M (2007) Ultra-trace determination of silver in water samples by electrothermal atomic absorption spectrometry after preconcentration with a ligand-less cloud point extraction methodology. J Hazard Mater 144: 458-463.
- Mortada WI, Ali AAZ, Hassanien MM (2013) Mixed micelle-mediated extraction of alizarin red S complexes of Zr (IV) and Hf (IV) ions prior to their determination by inductively coupled plasma-optical emission spectrometry. Analytical Methods 5: 5234-5240.
- Anastas P, Eghbali N (2010) Green chemistry: principles and practice. ChemSoc Rev 39: 301-312.
- Lindqvist O (1995) Environmental impact of mercury and other heavy metals. Journal of power sources 57: 3-7.
- Magos L, Carson BL, Ellis HV, McCann JL (198) Toxicology and Biological Monitoring of Metals in Humans Including Feasibility and Need. Lewis Publishers, Chelsea, Michigan. Wiley Online Library 7: 328.
- Ferrer R, Beltran J, Guiteras J (1996) Use of cloud point extraction methodology for the determination of PAHs priority pollutants in water samples by high-performance liquid chromatography with fluorescence detection and wavelength programming. Analyticachimicaacta 330: 199-206.
- Garcia Pinto C, Perez Pavon JL, Moreno Cordero B (1995) Cloud point preconcentration and high-performance liquid chromatographic determination of organophosphorus pesticides with dual electrochemical detection. Analytical Chemistry 67: 2606-2612.
- Frankewich RP, Hinze WL (1994) Evaluation and optimization of the factors affecting nonionic surfactant-mediated phase separations. Analytical chemistry 66: 944-954.
- Ali MA, Livingstone S (1974) Metal complexes of sulphur-nitrogen chelating agents. Coordination Chemistry Reviews 13: 101-132.
- Saxena R, Ahmad S (2010) Synthesis and characterisation of transition metal complexes of 2, 6-diacetylpyridine bis (S-methyl isothiosemicarbazone). Oriental Journal of Chemistry 26: 1507.
- Akl MA (2001) Spectrophotometric and AAS determinations of trace zinc(II) in natural waters and human blood after preconcentration with phenanthraquinonemonophenylthiosemicarbazone. Anal Sci 17: 561-564.
- Akl MA, Khalifa ME, Ghazy SE, Hassanien MM (2002) Selective flotation-separation and spectrophotometric determination of cadmium using phenanthraquinonemonophenythiosemicarbazone. Anal Sci 18: 1235-1240.
- Akl MA (2006) An improved colorimetric determination of lead(II) in the presence of nonionic surfactant. Anal Sci 22: 1227-1231.
- Khalifa ME, Akl MA, Ghazy SES (2001) Selective flotation-spectrophotometric determination of trace copper (II) in natural waters, human blood and drug samples using phenanthraquinonemonophenylthiosemicarbazone. Chemical and pharmaceutical bulletin 49: 664-668.
- Miller JC, Miller JN (1986) Statistics for analytical chemistry. Ellis Horwood Limited, England, pp:43-192.
--
Relevant Topics
Recommended Journals
Article Tools
Article Usage
- Total views: 11064
- [From(publication date):
August-2016 - Nov 21, 2024] - Breakdown by view type
- HTML page views : 10242
- PDF downloads : 822

