Application of a Blood-based Dynamic Genome Signature: How MAS5/RMA/PLIER Normalization Batches Affect Measured Gene Expression Profiling Stability in Clinical Diagnosis
Received: 18-Dec-2017 / Accepted Date: 08-Jan-2018 / Published Date: 10-Jan-2018 DOI: 10.4172/2161-0681.1000333
Abstract
Objective: A number of studies compare the microarray normalization methods MAS5 (Microarray Suite Version 5), RMA (Robust Multi-array Average) and PLIER (Probe Logarithmic Error Intensity Estimate) with respect to the rate at which genes of interest are identified. Here we evaluate and compare the stability of the measured gene expression when identical or technical replicate arrays are analyzed in batches of differing sizes and composition. These variations in measured gene expression have implications for clinical applications, which have requirements that differ significantly from those of research applications.
Methods: We evaluated the samples from data set E-MTAB-1532, available on ArrayExpress, a public repository of microarray data using the MAS5, RMA, and PLIER methods. We then evaluated a sample run as triplicate arrays and compared results among the different normalization methods.
Results and conclusion: Our study found that for some applications MAS5 is superior to the other methods, although the MAQC (Micro Array Quality Control) project, which extensively evaluated the performance of the platforms, reached a different conclusion.
Keywords: Microarray normalization methods; Microarray suite version; Robust multi-array average; Probe logarithmic error intensity estimate; Microarray; Gene expression; Microarray quality control project
Introduction
More than two thousand years ago during the Age of Warring States in China, Sun Tzu, the Chinese philosopher and general, recognized the uncertainties of war and concluded that only methodical “Measurement, Estimation, Calculation and Balance of chance (probabilities)” can lead to victory. These steps are still necessary in the modern world of genomic molecular biology where quantities are minute and measurements bound by fundamental uncertainties.
In previous publications, we described the methods we employed for analyzing and identifying gene panels obtained from peripheral blood samples predictive of various diseases and medical conditions [1,2]. In this paper we will describe in more detail the normalization steps that we found helpful to increase the level of repeatability in our experiments. This increased repeatability should be useful in clinical applications where disease models represented by gene expression profiles need to be stable and consistent.
Much has been written on the relative merits of different normalization methods, but most studies to date approach the problem from the biological point of view. That is, most studies set out to assess how many genes can be identified as differentially expressed or to determine gene network(s) that can be identified from correlated gene expression profiles [3,4].
MicroArray/Sequencing Quality Control (MAQC) is an effort to develop, standardize and validate procedures for microarray analysis of gene expression [5,6]. However, the goals of the project are necessarily broad to suit a wide spectrum of research efforts on various tissue types.
Our specific research purpose in past publications has been to detect disease signatures in peripheral blood samples. To this end we needed to examine microarray data normalization from a different perspective: We need to identify those genes which can return reliable and consistent measurements in replicate experiments during system validation and which therefore warrant further analysis. If measured gene expression level changes are a result of normalization methods and/or specific analysis procedures, such added “noise” may mask an actual biological effect. By specific analysis procedure, we mean the exact number and composition of the set of microarrays that are analyzed together to perform normalization and not merely the mathematical method being used (i.e., PLIER or RMA). This analysis “context” effect is one of the major differences between MAS5 and RMA, which normalize each array by explicitly relying on the data from the other arrays normalized at the same time. Published papers usually note the normalization method that was used, but when RMA or PLIER are used, the context may not always be made clear. For example, the authors may not state the number of arrays used or whether disease states are balanced or adjusted to simulate real-life distribution.
In this study we use exact duplicate data files to compare the estimated measured gene expression levels obtained by the three normalization methods, MAS5, RMA, and PLIER, offered in the Gene Expression Console software provided by Affymetrix. We compare these methods when samples are processed in different batch sizes and with a disease/control ratio of 50% (unbiased gene discovery scenario) and 1% (to simulate diseases with a low prevalence). We also compare the results from technical replicates (same blood draw, multiple arrays run on different days).
Materials and Methods
We used a 200-sample data set from E-MTAB-1532, available from the Array Express repository at http://www.ebi.ac.uk/arrayexpress/experiments/E-MTAB-1532/.
We also used three technical replicates from a 10-array experiment, run over 2 days, 3 weeks apart. (Private internal experiment and data)
We ran Affymetrix Expression Console with batches of arrays according to details described below. The normalization on each batch was performed using MAS5, RMA and PLIER (Affymetrix Expression Console 1.4.1.46) in turn. We compared the results from the exact same sample data file across the different batches and normalization options. The evaluation of the stability of the measured gene expression is shown by MA plots. Tables were also generated listing count of probe sets within a range of variability tolerance with reference ± 1.1- fold and ± 1.3-fold limits.
Sample and Study Design
E-MTAB-1532 200-sample data set
From the 100 available blood samples taken from patients with colorectal (CRC) cancer in this publicly shared data set, we selected a single CRC subject, Sample (060), as our “reference sample” to be compared across batches and normalization methods (Table 1). We then repeated the analysis, with other subjects serving as “reference” for both CRC and controls, and obtained very similar results. (Data not shown)
Batch 1: 20 sample balanced set: The reference CRC sample was combined with another 9 CRC samples and 10 control samples for a “balanced” 20-sample set. This method of sampling attempts to remove experimental bias to achieve a balanced composition and simulates a small “research” batch.
Batch 2: 20 sample unbalanced set: In this batch, only the reference sample is a CRC subject, the other 19 samples are taken from the control group. This method of sampling simulates “real-life” conditions, in that CRC is a low prevalence disease and most of the subjects are likely to be non-CRC.
Batch 3: 100 sample balanced set: This method is similar to Batch 1 sampling, with additional samples added for a total of 50 CRC and 50 control subjects.
Batch 4: 100 samples unbalanced set: This method is similar to Batch 2 sampling, but with a composition that approaches real-life low-prevalence disease (CRC prevalence in the average population is <1%). Additional subjects are added for a total of 99 control subjects.
Technical replicates data set
This is a 10-array titration experiment using 4 samples: A, B, C, and D. Samples A and D were run in triplicate; samples B and C were run in duplicate (Table 2). Samples from other, unrelated projects were also run concurrently (as is often the case in a busy laboratory).
One blood draw from subject “A” was separated into three aliquots and hybridized to individual microarrays. The first two replicates, A1 and A2, were run on the same day together with 11 other arrays, while the third replicate, A3, was run three weeks later with three other arrays.
The data files were processed in three different batches:
Batch 1R: All arrays run on day 1: All 13 arrays that were run in the laboratory on the same day, including the two replicates, A1 and A2 were processed together
Batch 2R: All arrays run on day 2: All 4 arrays including the third replicate, A3, were processed together. The other three arrays were also part of this titration experiment.
Batch 3R: by project: Only the 10 arrays which were part of this titration experiment were processed together. All other arrays unrelated to the titration experiment were excluded.
Results
E-MTAB-1532 batches
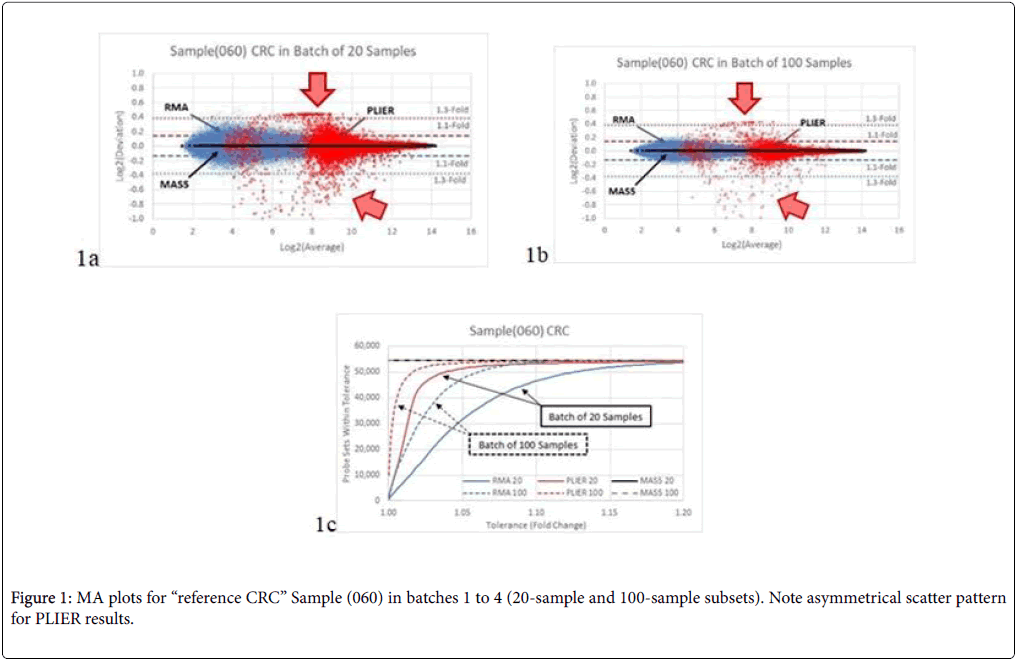
In Figure 1a, we compared the results for the reference Sample (060) when analysed in Batches 1 and 2 (20-sample set). The differences between batches are attributable only to the composition of the other 19 samples in the batch and its effect on the method of analysis. The scatter from the PLIER analysis shows an asymmetrical pattern (red data points) limited to about 1.3-fold in one direction and exceeding 2- fold in the other direction (1 unit on the Log2 scale). The RMA analysis produced a smaller, symmetrical scatter pattern which is mostly within 1.3-fold (blue data points). MAS5 yielded identical results (black data points) between the two batches, with zero scatter through the entire range for all probe sets.
When the batch size was increased to 100 samples in Batches 3 and 4 (Figure 1b), the results were generally similar, but with reduced scatter: RMA results are now mostly within 1.1-fold. The count of probe sets as a function of fold-change scatter is plotted in Figure 1c.
Technical replicates batches
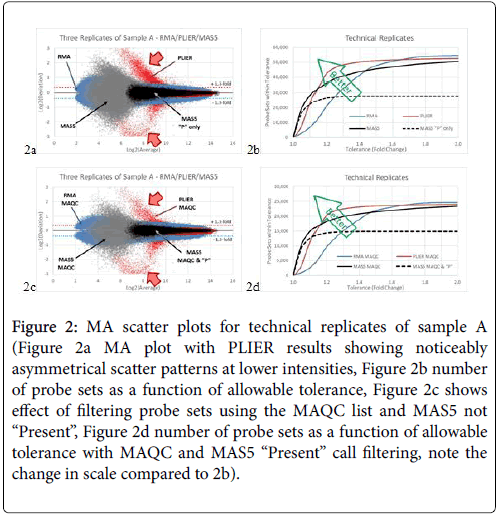
In the 10-array experiment, we compared the results from all three replicates A1, A2, and A3 from Batches 1R, 2R, and 3R. The maximum positive and negative deviations are plotted against the average in Figure 2a. The results from the PLIER analysis show the largest scatter, again with an asymmetrical pattern (red data points). RMA analysis (blue data points) produced the smallest scatter of mostly 2-fold or less (1 unit on the Log2 scale). MAS5 results (grey data points) were inbetween, with scatter reaching 4-fold (2 units on the Log2 scale). When we filtered the MAS5 results using the “Present” only probe sets, the scatter is reduced to about 1.3-fold as shown in Figure 2a. The count of probe sets versus fold-change scatter is plotted in Figure 2b. We then filtered the data using the list of probe sets published by the MAQC consortium as the most reliable. In general, scatter patterns remain similar but with about half of the total probe set number (Figures 2c and 2d).
Figure 2: MA scatter plots for technical replicates of sample A (Figure 2a MA plot with PLIER results showing noticeably asymmetrical scatter patterns at lower intensities, Figure 2b number of probe sets as a function of allowable tolerance, Figure 2c shows effect of filtering probe sets using the MAQC list and MAS5 not “Present”, Figure 2d number of probe sets as a function of allowable tolerance with MAQC and MAS5 “Present” call filtering, note the change in scale compared to 2b).
Observations
For Sample (060) in the E-MTAB-1532 data set, only MAS5 achieved the expected perfect result of the exact same gene expression levels for all batches (Figure 1). RMA results showed moderate scatter, while PLIER results showed a peculiar pattern with wide, asymmetrical scatter at lower intensities, which taper rapidly for higher intensity probe sets. The number of samples in the batch had a noticeable effect on the overall scatter of the results in both RMA and PLIER analyses.
The results from the technical replicates show similar trends. However, because the arrays are replicates, MAS5 results now show some scatter, which is wider than RMA at low intensity. PLIER still exhibits asymmetrical and large scatter at the low end, tapering to less scatter than RMA at the high end. Remarkably, while MAS5 underperformed both RMA and PLIER for most of the range, there are more probe sets with variability of less than 1.1-fold using MAS5 analysis (Figure 2c).
Typically, each probe set in the Affymetrix GeneChip arrays is complementary to a specific transcript within the target gene. The Perfect Match (PM) probe is composed of 11 to 16 base sequences exactly complementary to the target transcript and will therefore bind perfectly. The mismatched (MM) probe has the same sequence of bases, except that the middle base is intentionally substituted with the complementary base of the PM to measure non-specific binding (because mismatch should disturb binding to the specified transcript). Each probe pair in a probe set is considered as having a potential “vote” in determining whether the measured transcript signal is specific (PM>MM) and labelled “Present” or non-specific (MM>PM) and labelled “Absent”. The “Present” call feature of MAS5 effectively filters out less reliable, non-specific results with wide scatter. This Present/Absent call function uses the perfect-match and mis-match probe differential to estimate the reliability of the signal, reliability which is ignored by RMA and PLIER normalization.
In this study we found MAS5 to be the most stable normalization method for profiling gene expression in peripheral blood samples, as this method can reliably report gene expression levels that vary between technical replicates by less than 1.1-fold. As variations in gene expression differences obtained from tissue biopsies are expected to be 2-fold or greater, PLIER and RMA do perform better, as was reported by the MAQC consortium. However, both PLIER and RMA analyses can benefit from using the “Present” call feature of the MAS5 method of analysis, in which probe sets with ambiguous hybridization will be automatically filtered out, resulting in reduced scatter and improved detection of actual biological effects.
It may be observed here that for practical diagnosis in clinical studies, patient presentation and diagnoses are unexpected and uncontrolled. For mRNA gene signature studies, the individual patients’ gene profile measurements have been taken under the defined chronergy of clinical laboratories. That is, patients seeking a clinical test for the disease of interest arrive randomly in no particular order, together with patients with requests for other diagnoses. In research studies by contrast, subjects are processed sequentially and all subjects have the same disease of interest. These differences create a subtle batch effect in the research situation that is different from the real-life situation. Thus the average of the research batch can be quite different from the average of a clinical batch. This batch effect is often overlooked, but it is central to the issue discussed here on two levels. This raises certain important questions: First, in the clinical situation do we batch similar tests together? or as the patients come to the lab? Second, do we batch in the same proportion of disease/control as in real-life or in 50/50 proportion as during research.
Because RMA is a global normalization method, which uses the signals from all the arrays in a batch, the measured gene expression for any single array will not be perfectly stable and will vary with the batch components. For best repeatability, experimental notes should include the number and identity of all companion arrays processed in the same batch. There is a trade-off, however, between more stable results with a larger number of arrays and the longer computer processing time this would require. It may even be good practice to set aside a specific batch of arrays that can be used to act as a “constant background”. Again, the extra processing time required may be a factor that reduces the practicality of this approach.
We also noted an asymmetrical scatter pattern in the PLIER results when evaluating “balanced” sets of equal number of CRC and control subjects as against “realistic” sets with a single CRC and many control subjects, as would be the case for low-prevalence diseases.
MAS5 circumvents these issues and achieves the most reproducible results while allowing maximum flexibility in the batching of arrays. The downside of MAS5 is that some genes may be overlooked because their signals are not sufficiently stable, and analysis in this case may benefit from RMA and PLIER methods. However, for detecting disease signatures from peripheral blood samples stability and reproducibility are more important priorities, and MAS5 would therefore be the preferred normalization method. Considering that disease onset usually involves many different signaling pathways and numerous genes, a failure in data mining to identify some contributory but unstable genes is not crucial to disease diagnosis.
To compensate for inter-array and reagent lot variabilities we analysed the data as specific gene-pairs or combinations of specific gene-pairs. The desired gene-pair is defined as a “primary” gene with high correlation to the feature of interest or disease state combined with a companion “suppressor” gene with very low correlation to the feature but high correlation to the “primary” gene with the pair achieving an increased correlation [7,8]. We believe this kind of gene pairing achieves a useful degree of self-normalization that overcomes such unavoidable manufacturing and experimental variabilities. Because there is a very large number of possible pairings and an even larger number of pair combinations, these specific gene pairs need to be evaluated using the method we presented in our previous paper [2].
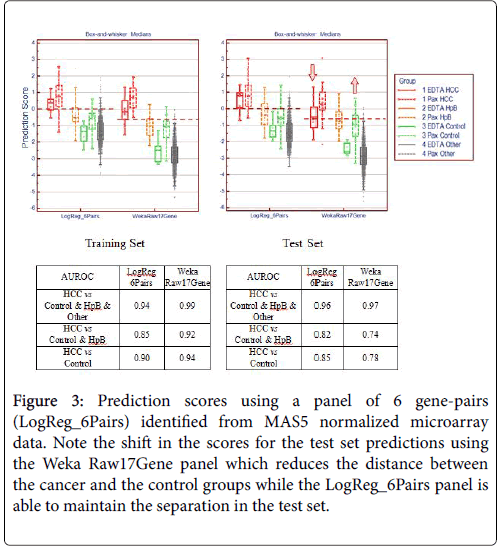
In order to verify the success of this technique of gene pairing, we conducted several experiments. As described in our previous paper [2], we performed a series of technical replicates using 4 replicates across 7 different batches of microarrays. We also combined microarray data from samples using EDTA (BD Vacutainer) and PAXgene (PreAnalytiX) collection tubes. These two types of tubes employ very different stabilization chemistry and the resultant gene expression profiles are vastly different because of the high globin mRNA content from PAXgene tubes. The combination of MAS5 and gene-pair analysis was able to identify a collection tube-agnostic gene panel for hepatocellular carcinoma that successfully predicted with high accuracy, achieving an AUROC of 0.96 in an independent test set with a mixture of HCC, non-HCC cancer, chronic hepatitis-B, and symptom-free “normal” subjects (Figures 3 and 4).
Figure 3: Prediction scores using a panel of 6 gene-pairs (LogReg_6Pairs) identified from MAS5 normalized microarray data. Note the shift in the scores for the test set predictions using the Weka Raw17Gene panel which reduces the distance between the cancer and the control groups while the LogReg_6Pairs panel is able to maintain the separation in the test set.
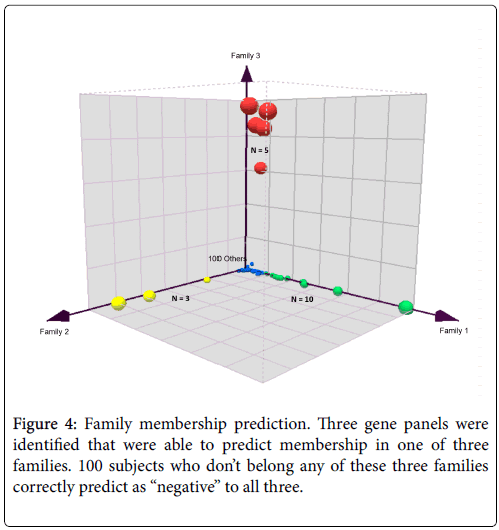
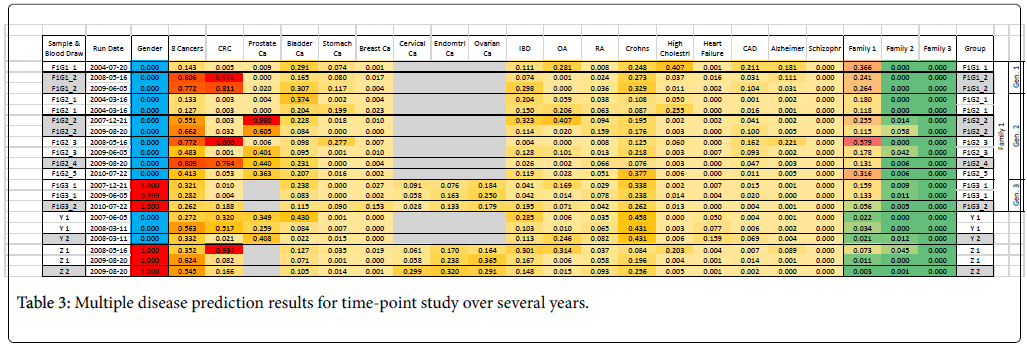
We also conducted a long-term follow-up study with repeated blood draws from subjects over a period of several years (Table 3). Some of the blood draw aliquots were stored and re-run after a year to verify stability. Three members of one family over three generations are included in this study; the two generation subjects lived together and a third generation subject lived separately. We found that the family signature was weakest in the third generation, and it may be hypothesized that the gene expression may be characteristic of living or dietary conditions rather than characteristic of family genetics or genomics. Overall, however, the predictions were fairly consistent.
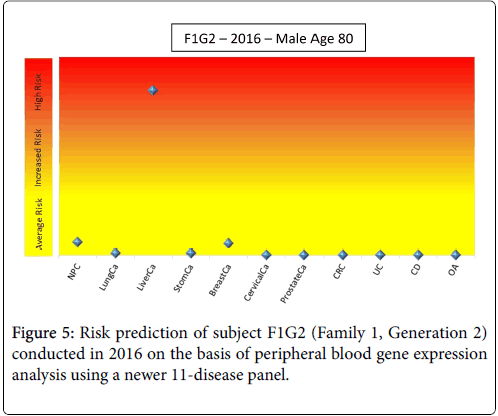
Only subjects F1G1 and F1G2 (Family 1, Generation 1 and 2) showed a consistently high risk for some kind of cancer (8-cancer panel, CRC, prostate cancer). A few years after the end of this study, subject F1G2 developed cancer (subject is unwilling to specify but indicated it was not any of the cancers on the panel). A new profile was obtained in the middle of 2016 and the disease risks were re-evaluated using a newer set of 11 disease panels (Figure 5). This profile showed that subject F1G2 has a relatively high risk for liver cancer; the risks of other diseases including seven tumors, inflammatory bowel diseases (Crohn’s Disease and Ulcerative Colitis) and Osteoarthritis (OA) were close to average risk population.
Discussion and Conclusion
The choice or selection of microarray normalization technique becomes important in the integration of molecular genetic diagnostics into clinical medical practice. The interrogation of the blood [2] and bodily-fluid-borne [9,10] cellular and non-cellular (i.e., exosomal and non-vesicular plasma) components may allow for timely interventional targeting not only of occult neoplasms but also of diseases with inflammatory, infectious and degenerative etiologies. The mRNA, lncRNA and miRNA transcriptome profiles in some disease entities have already been addressed in the literature, including: gliomas [11-14], head and neck cancer [15], lung cancer [16], breast cancer [17], renal carcinoma [18], hepatocellular carcinoma [19], prostate [20] and colorectal cancer [21] as well as rheumatoid and osteoarthritis [22], schizophrenia [23] and Alzheimer's dementia [24].
Currently pathological examination is based on tissue biopsy and research has also explored methods that focus on detection of circulating abnormal cells (i.e., circulating tumor cells) and genomic fragments (i.e., circulating tumor DNA, exosomes). By contrast, in our work we measure the dynamic mRNA gene expression of blood cells, which by reflecting interactions between circulating blood cells and the body’s cells, tissues and organs, may mirror the current state of a body’s health or disease. Recently, mRNA gene expression changes have also been shown to correlate with the traditional Chinese medicine classification of Yin/Yang deficient or balanced states [25].
In conclusion, mRNA gene expression profiles from whole peripheral blood samples tend to track the activity of the immune system and therefore reflect the general health of a subject. This will be a changing, dynamic situation better captured with genomics technology than with the static DNA sequence-based profiles which predict propensity to develop any particular disease. By the very nature of this ever-changing landscape, mRNA gene profiling can be useful in the detection of the early stages of a developing condition. Gene profiling may also prove to be useful to monitor treatment response and to assess the progress of a disease. However, the very nature of this changing profile necessitates a high-precision, high-stability measurement system. Part of these requirements can be met with the adoption of MAS5 normalization rather than the more commonly accepted RMA and PLIER methods.
Acknowledgments
We would like to thank Sam Xiong and Isolde Prince for their editorial assistance.
Conflict of Interest
No conflict of interest is declared by any author.
References
- Xu Y, Xu Q, Yang L, Ye X, Liu F, et al. (2013) Identification and validation of a blood-based 18-gene expression signature in colorectal cancer. Clin Cancer Res 19: 3039-3049.
- Chao S, Cheng C, Liew CC (2015) Mining the dynamic genome: A method for identifying multiple disease signatures using quantitative RNA expression analysis of a single blood sample. Microarrays 4: 671-689.
- Irizarry RA, Bolstad BM, Collin F, Cope LM, Hobbs B, et al. (2003) Summaries of Affymetrix GeneChip probe level data. Nucleic Acids Research 31: e15.
- Lim WK, Wang K, Lefebvre C, Califano A (2007) Comparative analysis of microarray normalization procedures: effects on reverse engineering gene network. Bioinformatics 23: i282-i288.
- MAQC Consortium (2006) The MicroArray Quality Control (MAQC) project shows inter- and intraplatform reproducibility of gene expression measurements. Nat Biotechnol 24: 1151-1161.
- Shippy R, Fulmer-Smentek S, Jensen RV, Jones WD, Wolber PK, et al. (2006) Using RNA sample titrations to assess microarray platform performance and normalization techniques. Nat Biotechnol 24: 1123-1131.
- Horst P (1941) The role of predictor variables which are independent of the criterion. Soc Sci Res 48: 431-436.
- Smith RL, Ager, JW Jr, Williams DL (1992) Suppressor variables in multiple regression/correlation. Educ Psychol Meas 52: 17-29.
- Danielson KM, Rubio R, Abderazzaq F, Das S, Wang YE (2017) High throughput sequencing of extracellular RNA from human plasma. PLOS ONE 12: e0164644.
- Cheng L, Sun X, Scicluna BJ, Coleman BM, Hill AF (2014) Characterization and deep sequencing analysis of exosomal and non-exosomal miRNA in human urine. Kidney Int 86: 433-444.
- Rao SA, Srinivasan S, Patric IR, Hegde AS, Chandramouli BA, et al. (2014) A 16-gene signature distinguishes anaplastic astrocytoma from glioblastoma. PLOS ONE 9: e85200.
- Luo JW, Wang X, Yang Y, Mao Q (2015) Role of micro-RNA (miRNA) in pathogenesis of glioblastoma. Eur Rev Med Pharmacol Sci 19: 1630-1639.
- Kiang MY, Zhang XQ, Leung KK (2015) Long non-coding RNAs: The key players in glioma pathogenesis. Cancers 7: 1406-1424.
- MatjaÅ¡iÄ A, Tajnik M, BoÅ¡tjanÄiÄ E, Popović M, Matos B, et al. (2017) Identifying novel glioma-associated noncoding RNAs by their expression profiles. Int J Genomics 23: 12318.
- Zaatar AM, Lim CR, Bong CW, Lee MM, Ooi JJ, et al. (2012) Whole blood transcriptome correlates with treatment response in nasopharyngeal carcinoma. J Exp Clin Cancer Res 31: 76-83.
- Bang MS, Kang K, Lee JJ, Lee YJ, Choi JE, et al. (2017) Transcriptome analysis of non-small cell lung cancer and genetically matched adjacent normal tissues identifies novel prognostic marker genes. Genes Genom 39: 277-284.
- Zhou M, Zhong L, Xu W, Sun Y, Zhang Z, et al. (2016) Discovery of potential non-coding RNA biomarkers for predicting the risk of tumor recurrence of breast cancer patients. Scientific Rep 6: 31038.
- Pflueger D, Sboner A, Storz M, Roth J, Compérat E, et al. (2013) Identification of molecular tumor markers in renal cell carcinomas with TFE3 protein expression by RNA sequencing. Neoplasia 15: 1231-1240.
- Hayes NC, Chayama K (2016) MicroRNAs as biomarkers for liver disease and hepatocellular carcinoma. Int J Mol Sci 17: 280.
- Martens-Uzunova ES, Jalava SE, Dits NF, van Leenders GJ, Møller S, et al. (2012) Diagnostic and prognostic signatures from the small non-coding RNA transcriptome in prostate cancer. Oncogene 31: 978-991.
- Sabates-Bellver J, Van der Flier LG, de Palo M, Cattaneo E, Maake C, et al. (2007) Transcriptome profile of human colorectal adenomas. Mol Cancer Res 5: 1263-1275.
- Woetzel D, Huber R, Kupfer P, Pohlers D, Pfaff M, et al. (2014) Identification of rheumatoid arthritis and osteoarthritis patients by transcriptome-based rule set generation. Arthritis Res Ther 16: R84.
- Li X, Teng S (2015) RNA sequencing in schizophrenia. Bioinformatics Biol Ins 9: 53-60.
- Han G, Wang J, Zeng F, Feng X, Yu J, et al. (2013) Characteristic transformation of blood transcriptome in Alzheimer's Disease. J Alzheimer's Dis 35: 373-386.
- Yu R, Liu D, Yang Y, Han Y, Li L, et al. (2017) Expression proï¬ling-based clustering of healthy subjects recapitulates classiï¬cations deï¬ned by clinical observation in Chinese medicine. J Genet Genomics 44: 191-197.
Citation: Chao J, Chaban G, Cheng C, Piarar S, Liew CC, et al. (2018) Application of a Blood-based Dynamic Genome Signature: How MAS5/RMA/PLIER Normalization Batches Affect Measured Gene Expression Profiling Stability in Clinical Diagnosis. J Clin Exp Pathol 8: 333. DOI: 10.4172/2161-0681.1000333
Copyright: ©2017 Chao J, et al. This is an open-access article distributed under the terms of the Creative Commons Attribution License, which permits unrestricted use, distribution, and reproduction in any medium, provided the original author and source are credited.
Share This Article
Recommended Journals
Open Access Journals
Article Tools
Article Usage
- Total views: 4467
- [From(publication date): 0-2018 - Apr 26, 2025]
- Breakdown by view type
- HTML page views: 3630
- PDF downloads: 837


