Anti-Symmetry of First Upper Molar in Domestic Goats
Received: 07-Sep-2017 / Accepted Date: 22-Nov-2017 / Published Date: 30-Sep-2017 DOI: 10.4172/2332-2608.1000251
Abstract
Developmental instability theory suggests that variation in some body areas can partially reflect the ability to buffer development from key environmental and genetic perturbations. Developmental stability is defined as the ability of organisms to withstand genetic or environmental disturbances during development. Support for this approach comes mainly from assessment of fluctuating asymmetry - that is deviations from symmetry of body features that are symmetric at the population level. In order to compare developmental instability in domestic goats, we sampled 22 adult skulls. Length of upper molars (from M1 to M3), for each side, on their occlusal aspect, was measured and bilaterally compared using standard methods. Left-right differences in first upper molar (M1), which were not size-dependent, presented a platykurtic distribution. There was thus evidence of directional asymmetry towards the left side in M1.
Keywords: Bilateral symmetry; Capra; Developmental instability; Fluctuating asymmetry; Jugal teeth
Introduction
Developmental stability (DI) is defined as the ability of organisms to withstand genetic or environmental disturbances during development [1]. As DI reflects the capacity of organisms to produce an optimum phenotype despite perturbations during development, its appraisal can be used to evaluate these stresses [1], which can be of environmental or genetic origin [1].
Fluctuating asymmetry (FA) is frequently used to appraise DI [1]. Given that the two sides of a bilaterally symmetrical trait are produced by the same gene complexes and develop under similar environmental conditions, any deviation from symmetry will express the inability of the organism to correct developmental errors, i.e., its level of developmental stability. FA within a population is widely estimated by the differences between the right and left sides of organisms [1]. Asymmetry of an individual is measured as the right minus the left value (L-R) of a bilaterally paired trait [2]. Low levels of FA are often seen as indicators of overall quality or general health condition of individuals. The idea behind this concept is that individuals of low quality cannot control their development precisely, and consequently develop different phenotypes on both sides more often [3].
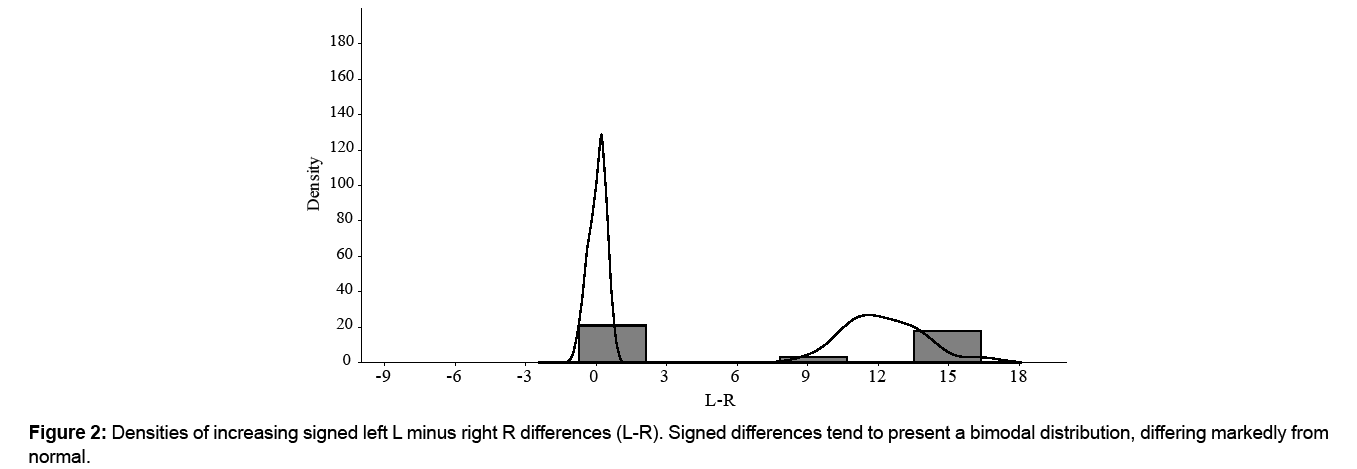
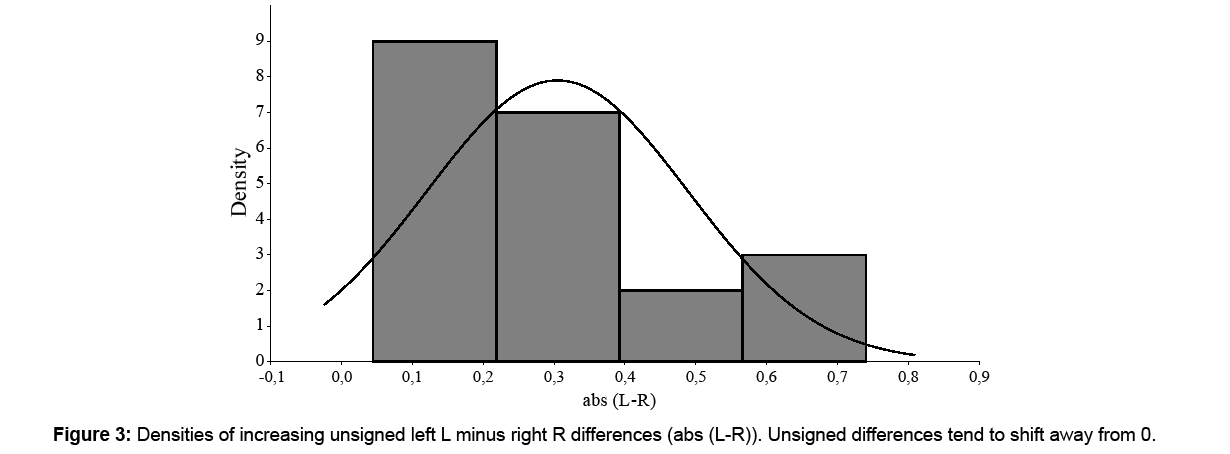
FA needs to be distinguished from two other types of asymmetry: directional asymmetry (DA) and antisymmetry (AS) [1,2]. DA occurs when one side of a bilateral character is systematically larger than the other, and therefore the mean of left (L) and right (R) sides (L-R) presents a normal distribution of the population which will be different from zero [1,4]. Unlike FA, these asymmetry types are considered inappropriate for the estimation of developmental stability, due to their presumed heritable component [4]. The small random deviations in FA result in a normal or leptokurtic distribution of asymmetry around a mean of zero [2]. A common procedure for testing FA is to use a goodness-of-fit test to evaluate whether signed differences come from a normal distribution [5]. FA is expected to be normally distributed with a mean of 0 [5]. Normal distributions are not expected in traits exhibiting AS, size-dependent or size-dependent AS [5]. A good mathematical review of asymmetries is in FA and AS cannot be separated statistically with high power [5]. The distribution of signed differences (L-R) tends to be bimodal [5], and that of unsigned (absolute), [L-R], shows a shifting away from 0 [5]. AS is characterized by a platykurtic or bimodal distribution of the signed differences of left and right, with a mean of zero [6]. Thus, (L-R) distributions with a negative kurtosis (platykurtic) are generally considered indicative of AS [7].
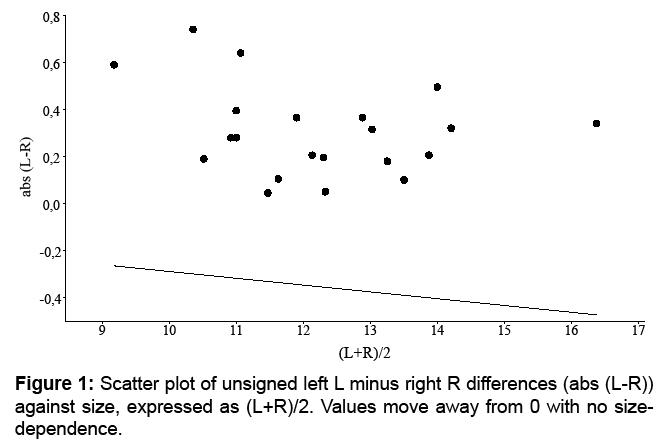
Moreover, asymmetry can vary with size. To determine it, measures of asymmetry can be plotted against trait size [5] in many cases the measure of asymmetry being the unsigned difference [5]. The scatter plot can be used to determine whether there is an increase in asymmetry as size declines or the inverse [5]. Hence, the mean value of unsigned residuals from the linear regression of unsigned asymmetry against trait expression increases as expression declines in FA, whereas these changes are subtle or absent in AS. Size in this research has been considered as (L+R)/2. Rowe et al. [5] nevertheless suggest “that visual inspection of datasets may be more powerful than statistical tests for initial detection of departures from FA”.
Many studies have revealed FA in biological forms, fewer have revealed DA and still fewer AS [6]. AS is, however, probably much more common than what is believed [5]. An explanation of this could be that because weak AS can be very difficult to distinguish from FA, previous studies have mistaken AS for FA. The aim here was to use the three upper molars (M1 to M3) in goats in order to assess whether asymmetry is present on some of the pieces and, if so, which kind.
Materials and Methods
Measurements and statistics
A sample of 22 skulls of domestic goats of unknown sex and body condition were studied. All animals were considered adults (at least second molar erupted). Only non-damaged teeth were considered. Length of each first (M1), second (M2) and third (M3) molar of each skull, for each side, on their occlusal aspect, using a digital calliper precise to 0.01 mm.
Averaged signed differences (L-R) were obtained individually for each piece and for each specimen. Although subtracting the measurement of the right side of a trait from that of the left side forms the basis of the analysis, accurately quantifying asymmetries is not simple. The measurement of FA is complicated by the fact that its magnitude and distribution are the same as the magnitude and distribution of measurement error [2]. Therefore, in order to establish that real differences in symmetry rather than just measurement error were being reported, it was imperative to establish that the measures of FA explained a statistically significant proportion of the observed total variance between the sides [2]. For this, measurement error or measure repeatability (the component of the overall variance due to imprecision of measurements) was calculated by measuring all specimens twice in two temporally separated sessions and error analyzed by a two-waymodel NPANOVA (as M2 and M3 presented a not normal distribution, W=0.953, p=0.003 and W=0.952, p=0.004, respectively, the parametric test ANOVA was not considered suitable), including each molar length separately as dependent variables, and side (S), and replica (R) as factors. The ratio of the S-by-R mean square provided an F-test of whether between-side variation in estimated asymmetry (“signal”) was significantly greater than could be accounted for by measurement error (“noise”). Euclidean distances were considered for this test. Average values of measurements were then used in statistical analyses. A Mann-Whitney U test was performed to corroborate whether signed differences L-R were statistically different from 0, and the Shapiro-Wilk W test was applied to know the normality of distribution. Correlation of [L-R] to (L+R)/2 was undertaken with Spearman rs test.
All statistics were performed using the PAST software [8].
Ethics statement
This study was carried out in corpses from animals which deceased naturally for causes not related to the purpose of this study and under no circumstance were they euthanized. No Ethics Committee agreement was therefore considered to be necessary. Causes of death were always unknown.
Results
Asymmetry measurements for M1 were shown to be highly repeatable, indicating a very low influence of error on measurements. In other words, the between-sides variation in estimated asymmetry for M1 was significantly larger (F=0.019056, p= 0.8932) than within-replicas variation due to measurement error (F=0.000173, p= 0.992). For M2 and M3, however, this signal:noise indicated that the measurement errors (F=0.019925, p=0.886, and F=0.000177, p=0.987, respectively) were larger than the amount of FA (F=0.031779, p=0.864, and F=0.007831, p=0.933, respectively), and they were therefore considered unsuitable for estimating asymmetries and were consequently not used for further analyses. Then, for each specimen the M1 average was obtained. The average of replicated measures within M1 was 12.2 ± 1.61 mm and 12.2 ± 1.67 mm for left and right teeth, respectively.
Signed averaged (L-R) gave a mean ± SD of 0.05 ± 0.36 mm (Table 1), which represents around 2.6% of trait length. Distribution was normal (W=0.963, p=0.581) with a negative kurtosis (-0.332). At the 0.05 significance level, (L-R) did not differ significantly from zero (U=168, p=0.162). There was no correlation of [L-R] with (L+R)/2 (rs=0.198, p=0.388) (Figure 1), and therefore no size-correction was considered necessary. A visual inspection of the histogram of (L-R) showed a tendency towards a bimodal distribution (Figure 2) and that of [L-R] a shift away from 0 (Figure 3).
| Min | -0.74 |
| Max | 0.64 |
| Mean | 0.05 |
| Std. error | 0.078 |
| Variance | 0.13 |
| Stand. dev | 0.361 |
| Median | 0.18 |
| Skewness | -0.458 |
| Kurtosis | -0.332 |
| Geom. mean | 0 |
Table 1: Main descriptive values for M1 signed left-right differences on lengths of occlusal aspect. Linear values expressed in mm. Negative value of kurtosis indicates platykurtosis of the trait (e.g., antisymmetry).
Discussion
Our analysis reveals a deficit of symmetrical individuals in the sample analyzed, in which the degree of asymmetry was not a function of size. Which kind of asymmetry?
As signed averaged (L-R) presented no significant differences from 0, DA – that is, fixed asymmetry - could be rejected. AF could also be rejected because distribution was not leptokurtic. The negative kurtosis and the tendency towards a bimodal (L-R) distribution, and the shifting of [L-R] distribution away from 0 would indicate a clear AS of M1 – that is, random asymmetry.
Moreover, the plotting of differences against size indicated no correlation. If AS detected is not size-dependent, it is not size-dependent costly, and rather it may be viewed as functionally insignificant and thus it does not occur as a signalling trait (that is, with no selective attention).
The cause of this AS pattern in goats as a measure of development precision remains open to debate and is worthy of being analyzed carefully. Our previous hypothesis is that it reflects a random laterality in chewing function in goats, e.g., right- and left-chewers equally frequent in this species.
One can argue that our data are biased. However, given the high magnitude of asymmetric variation, bilateral differences are unlikely to be confused by other factors, such as imprecise measurement, bias wear…. Imprecise measurements can be discarded, as none appeared related to the signal measurement errors. In any case, since imprecise measurements would introduce only random errors, that would amplify apparent FA, not create AS [8,9]. Moreover, measurement error appeared not to be strong enough to bias FA estimation and reduce statistical power.
Funding
The authors received no financial support for the research, authorship, and/or publication of this article.
Acknowledgements
The authors are grateful for the help of Josué Sabaté for allowing his private collection of White Rasquera skulls to be studied. The rest of the skulls are stored in the bone collection of the Department of Animal Science of the University of Lleida.
References
- Auffray JC, Debat V, Alibert P (1999) Shape asymmetry and developmental stability. In: Mark JCM, Chaplain AJ, Singh GD, editors. On growth and form: spatio-temporal pattern formation in biology. John Wiley and Sons Ltd: 309-324.
- Tomkins JL, Andrews S (2001) Fluctuating Asymmetry. Encyclopedia of Life Sciences: 1-5.
- Galeotti P, Sacchi R, Vicario V (2005) Fluctuating asymmetry in body traits increases predation risks: tawny owl selection against asymmetric woodmice. Evolutionary Ecology 19: 405-418.
- Lens L (2002) Fluctuating asymmetry as an indicator of fitness: can we bridge the gap between studies? Biological reviews of the Cambridge Philosophical Society 77: 27-38.
- Rowe L, Repasky R, Palmer R (1997) Size-dependent asymmetry: fluctuating asymmetry versus antisymmetry and its relevance to condition-dependent signaling. Evolution 51: 1401-1408.
- De Coster G, Dongen SV, Malaki P, Muchane , Exposito AA, et al. (2013) Fluctuating Asymmetry and Environmental Stress: Understanding the Role of Trait History. PLoS ONE 8: 1-9.
- Tuyttens FAM, Maertens L, Poucke VE, Nuffel VA, Debeuckelaere S (2005) Measuring fluctuating asymmetry in fattening rabbits: A valid indicator of performance and housing quality? Journal of Animal Science 83: 2645-2652.
- Hammer Ø, Harper DAT, Ryan PD (2001) Past: Paleontological Statistics Software Package for Education and Data Analysis 4: 1-229.
- Klingenberg CP (2015) Analyzing fluctuating asymmetry with geometric morphometrics: concepts, methods and applications. Symmetry 7: 843-934.
Citation: Casanova PMP (2017) Anti-Symmetry of First Upper Molar in Domestic Goats. J Fisheries Livest Prod 5: 251. DOI: 10.4172/2332-2608.1000251
Copyright: © 2017 Casanova PMP. This is an open-access article distributed under the terms of the Creative Commons Attribution License, which permits unrestricted use, distribution, and reproduction in any medium, provided the original author and source are credited.
Share This Article
Recommended Journals
Open Access Journals
Article Tools
Article Usage
- Total views: 3311
- [From(publication date): 0-2017 - Jan 15, 2025]
- Breakdown by view type
- HTML page views: 2646
- PDF downloads: 665


