Research Article Open Access
Anthropometric Status of Adolescent Girls of Rural India
Kankana De*Vidyasagar University, Medinipur, West Bengal, India
- *Corresponding Author:
- Kankana De
Vidyasagar University, Medinipur
West Bengal, India
Tel: 9474714273
E-mail: dekankana@gmail.com
Received date: December 28, 2016; Accepted date: January 05, 2017; Published date: January 10, 2017
Citation: De K (2017) Anthropometric Status of Adolescent Girls of Rural India. J Tradit Med Clin Natur 6:205.
Copyright: © 2017 De K. This is an open-access article distributed under the terms of the Creative Commons Attribution License, which permits unrestricted use, distribution, and reproduction in any medium, provided the original author and source are credited.
Visit for more related articles at Journal of Traditional Medicine & Clinical Naturopathy
Abstract
A community based cross sectional study was carried out among adolescent girls in the age group of 10-19; the study was done on 1009 girls. Among study 85.2% are menarcheal girls and this study shows that girls experience highest menarche at age of 12 years, 16.3% girls suffers from CED I, This study shows that 4.1% girls belongs to CEDIII. It shows that 30.2% experience menarche at 12-12.9 years. The overall means, standard deviations of Height and weight of the adolescent girls were 150.01 cm (4.81) and 44.06 kg (5.70) respectively. Among all circumferential measurements mean Hip Circumference is highest (84.85) cm (6.57) and among skin folds Triceps skinfold is 8.98 mm (2.03) Mean height increases 7.54 cm progressively from 10 to 19 years, 8.76 kg weight increases from 10 to 19 years.
Keywords
Adolescence growth; Anthropometric; Adipose tissue;Menarche
Introduction
Adolescence growth and nutritional status are heavily influenced by the sexual maturation process, and thus cannot be accurately assessed without knowledge of the degree of sexual maturation [1], up to 37% of total bone mass. Nutrition influences growth and development throughout infancy, childhood and adolescence; it is, however, during the period of adolescence that nutrient needs are the greatest [2]. It creates lasting effect on the growth, development and physical fitness of a person. It is well recognized worldwide that anthropometric measurements are indispensable in diagnosing under nutrition. Currently, it is estimated that there are about 69.7 million adolescent girls constituting about 7.0% of the total population. Physical growth at adolescence occurs earlier and is more rapid than during preadolescence. Chronic energy deficiency in adolescents results in short stature and lean body mass and is associated with deficiencies in muscular strength and working capacities. A community based cross sectional study was carried out amongst adolescent girls in the age group of 10-19; the study was done on 1009 girls. This study done on Salboni block which is large block of Paschim Medipur. Among 1009 girls 896 girls are menarcheal. To collect data Anthropometric measurement was taken; this study was made in the year 2010 (Table 1).
| Dependent variable | 10 year (n=100) Mean (SD) | 1 years (n=100) Mean (SD) | 12years (n=100) Mean (SD) | 13years (n=100) Mean (SD) | 14 years (n=100) Mean (SD) | 15 years (n=100) Mean (SD) | 16 years (n=100) Mean (SD) | 17 years (n=100) Mean (SD) | 18 years (n=100) Mean (SD) | 19 years (n=100) Mean (SD) | F |
|---|---|---|---|---|---|---|---|---|---|---|---|
| Height | 146 | 148.07 | 149.82 | 150.44 | 151.53 | 152.18 | 152.48 | 152.8 | 153.15 | 153.55 | 33.28* |
| (cm) | 1 (4.94) | (3.76) | (3.82) | (3.76) | (4.41) | (4.41) | (3.52) | (4.78) | (4.98) | (4.41) | |
| Weight | 38.86 | 41.63 | 42.06 | 43.3 | 45.08 | 45.99 | 46.53 | 46.86 | 47.35 | 47.62 | 48.021* |
| (kg) | (4.65) | (5.29) | (4.25) | (4.09) | (4.03) | (3.92) | (4.45) | (3.63) | (4.45) | (3.64) |
Table 1: Anova table show age wise increase anthropometric variables of adolescent.
Materials and Methods
The study area was Salboni Block which is 25 km away from Medinipur town. Subjects are 10-11 year’s adolescent girl. The study were done on 1009 girls For this study different types of anthropometric measurements were taken like Weight, Height, Chest Circumference, Waist Circumference Hip Circumference etc. Height is measured through Anthropometric rod, by weighing machine. Weight is taken by skinfold Caliper skin folds are measured. Structured questionnaires were followed to know details of socio-economic status. Height was measured to the nearest 0.1 cm and weight to the nearest 0.5 kg. Each subject was weighed with minimum clothing and no footwear.
Height
Height is a major indicator of general body size and skeletal length. It is important in screening disease or malnutrition of weight, the subject back as straight as possible on the floor with heel together so that weight of the subject was distributed evenly on both the feet. The subject’s was as straight as possible with arms relaxed and hanging side by side of the trunk and palms were facing thigh. Each subject was asked to inhale deeply and maintain fully erect position without altering the load on the heels and the beam passes vertically between the buttocks and touching the back head.
Weight
Body weight is the most commonly recorded anthropometric variables weight is composite measure of total body size. Each subject was requested to stand without any support on weighing machine placed on the floor. The participants were requested to remove their shoes prior to their measurement and wear minimum light clothing when they were on the weighing machine which was checked from time to time to set zero.
Circumferences
Circumferences are important measurements that record the size of cross-sectional and circumferential dimensions of the body. Circumferences used alone, in combination with skinfold measurement taken at the same location or in combination with other circumference are measures of growth and can provide indices of nutritional status and level of fat pattering. During later childhood, Adolescence enter into Adulthood, circumference of the limbs together with skinfold measures of subcutaneous adipose tissue thickness at corresponding levels can provide cross-sectional areas of adipose tissue or the areas of underlying “muscles plus bone”. Ratios between selected circumferences and with skinfolds of the trunk and limbs can provide indices of pattering adipose tissue and muscles.
Mid upper arm circumference
For this purpose each subject was requested to stand erect with the arm hanging freely at the sides of the trunk and the palms is flexed to 90° with palm facing thighs. Prior to taking this measurement the midpoint of the upper arm was marked and was used to measure mid upper arm circumference. To locate midpoint the subject elbow was flexed to 90° with palm facing superiorly.
Chest circumference
Chest Circumference was measured at the level of nipple on the anterior aspect of the thorax which correspondence approximately to the fourth inters coastal space. The fourth inter coastal space is just inferior of the fourth costosternal joints; the measurement was space is just inferior of the fourth costosternal joints. The measurement was made in horizontal plane by standing in front of subject but slight to left side.
Minimum waist circumference
Waist Circumference is an index of deep adipose tissue and it is related to fat free mass, the subject stands erect with abdomen relaxed, the arms at sides and feet together.
Maximum hip circumference
Hip Circumference is a measurement of external pelvic size that reflects the amount of adipose tissue in the region. Subjects were requested to stand erect with arms at the sides and feet together. The measurement was recorded squatting at the left sides of the subject to get the clear vision of greatest or maximum extension of buttocks posterior. The steel tape was placed around the buttocks in a horizontal plane at the level without compressing the skin and measurement was taken.
Statistical Analysis
Data were entered in Microsoft excel 2007 and was analyzed using SPSS 19.0. Descriptive statistics and chi square test were used wherever required, to test statistical significance. Statistical significance was set at p<0.05.
Results
This study indicates that high value anthropometric character experience early menarche. Body fat from skinfolds gives a more direct estimate of body fat mass (Heitmann) especially more so on children and adolescents [3] and may be used in field studies.
Adolescence is the most crucial phase of growth from birth to maturity, In this period a sudden and rapid acceleration of physical growth and development takes place(tanner) The present analysis revealed the overall (all aged combined) and age wise distributions in different adiposity and body composition profiles of Bengalee adolescent girls (Poppleton and Brown, Sandler et al.). Among study 85.2% are menarcheal girls and this study shows that girls experience highest menarche at age of 12 years,16.3% girls suffers from CED I, this study shows that 4.1% girls belong to CEDIII (Table 2). The overall means, standard deviations of Height and weight of the adolescent girls were 150.01 cm (4.81) and 44.06 kg (5.70) respectively and among skin folds triceps skinfold, biceps skinfolds will increase with age which shown in Table 3 which proves adolescent growth spurt (Table 3). According to Table 1 mean height increases 7.54 cm progressively from 10 years to 19 years, 8.76 kg weight increases from 10 to 19 years. Age wise change anthropometric variables has shown significant relation with other variables. Table 4 represents that menarcheal girls anthropometry is higher than premenarcheal.
| BMIcategory | Frequency | Percentage |
|---|---|---|
| CEDIII | 41 | 4.1 |
| CEDII | 39 | 3.9 |
| CEDI | 164 | 16.3 |
| Normal | 761 | 75.4 |
| overweight | 4 | 0.4 |
Table 2: Table shows frequency of nutritional status of study group.
| Variable | 10 year | 11 year | 12 year | 13 year | 14 year | 15 year | 16 year | 17 year | 18 year | 19 year | F |
|---|---|---|---|---|---|---|---|---|---|---|---|
| Triceps Skinfold (mm) |
6.75 (1.44) |
8.18 (1.53) |
8.27 (1.26) |
8.54 (1.47) |
8.94 (1.75) |
9.32 (1.75) |
9.52 (2.02) |
9.72 (2.2) |
10.06 (1.91) |
10.34 (2.2) |
37.9* |
| Biceps Skinfold (mm) |
5.03 (1.008) |
5.42 (1.223) |
5.63 (1.304) |
5.7 (1.17) |
5.98 (1.21) |
6.22 (1.33) |
6.4 (1.33) |
6.5 (1.56) |
6.62 (1.49) |
7.46 (1.98) |
26.51* |
Table 3: Anova table show age wise increase anthropometric variables of adolescent.
| Variable | 10 years | 11 years | 12 years | 13 years | 14 years |
|---|---|---|---|---|---|
| Height(cm)(post Menarcheal) | 146.13(5.08) | 148.34(3.83) | 150.12(3.87) | 150.68(3.80) | 151.37(4.40) |
| Premenarcheal | 145.88(4.84) | 147.45(3.58) | 148.65(3.46) | 148.61(2.99) | 153.32(4.39) |
| Combined | 146.01(4.94) | 148.07(3.76) | 149.82(3.82) | 150.44(3.70) | 151.53(4.41) |
| Weight(kg)(Postmenarcheal) | 41.71(4.16) | 43.42(3.92) | 43.39(3.32) | 44.16(3.47) | 45.75(3.34) |
| Premenarcheal | 36.01(3.15) | 37.46(5.75) | 36.72(3.27) | 37.00(2.56) | 37.38(3.34) |
| Combined | 41.71(4.16) | 41.63(5.29) | 42.06(4.25) | 43.30(4.09) | 45.08(4.03) |
| BMI(kg/m2)postmenarcheal | 19.53(1.7) | 19.72(1.56) | 19.25(1.3) | 19.44(1.32) | 19.98(1.41) |
| Premenarcheal | 16.93(1.37) | 17.20(2.46) | 17.20(2.46) | 16.76(1.19) | 15.87(6.53) |
| Combined | 18.23(2.03) | 18.96(2.19) | 18.72(2.19) | 19.12(1.57) | 19.65(1.76) |
Table 4: Age wise comparison of postmenarcheal and remenarcheal of anthropometric variable.
Overall Data Estimation
Age (years) (10-19) years: Range; Sample size (n): 1009; Age wise distribution: 100 girls in every age group; Postmenarcheal girls: 896.
In this cross-sectional study it is not known whether girls with earlier onset of menarche had higher body mass and body fat mass than the other girls prior to menarche, or whether these differences were constituted partially or completely after menarche. In this study Table 4 shows that menarcheal girls have higher weight, height, BMI in comparison with to premenarcheal Girls. According to overall study 42 of 10-19 years are CED I undernutrient.164 girls suffer from CED II (Tables 4 and 5). 5.87 % of Percent Body Fat is increasing from 10 years to 19 years. Anthropometric variables have a significant relation with age; Table 6 representes comparison age with present study (Table 5).
| Model | Unstandardized Coefficients | Standardized Coefficients | t | Sig. | 95.0% Confidence Interval for B | |||
|---|---|---|---|---|---|---|---|---|
| B | Std. Error | Beta | Lower Bound | Upper Bound | ||||
| 1 | (Constant) | -14.031 | 1.998 | -7.021 | 0.000 | -17.953 | -10.110 | |
| Height(cm) | 0.054 | 0.015 | 0.090 | 3.542 | 0.000 | 0.024 | 0.084 | |
| Weight(kg) | 0.062 | 0.015 | 0.108 | 3.982 | 0.000 | 0.031 | 0.092 | |
| MUAC(cm) | 0.475 | 0.026 | 0.468 | 18.494 | 0.000 | 0.424 | 0.525 | |
| TSF(mm) | 0.146 | 0.038 | 0.102 | 3.881 | 0.000 | 0.072 | 0.219 | |
| BSF(mm) | 0.212 | 0.048 | 0.113 | 4.451 | 0.000 | 0.118 | 0.305 | |
| Chest circumference(cm) | 0.046 | 0.010 | 0.112 | 4.450 | 0.000 | 0.026 | 0.066 | |
| Waist circumference(cm) | 0.0640 | 0.013 | 0.141 | 5.015 | 0.000 | 0.039 | 0.090 | |
| Hip circumference(cm) | -0.044 | 0.012 | -0.099 | -3.776 | 0.000 | -0.066 | -0.021 | |
Table 5: Multivariate regression analysis of different anthropometric variables.
| Output | Wellens and Malina | Claessens et al. | Bhadra | Present study |
|---|---|---|---|---|
| Median | 12.94 | 12.81 | 12 | 12.11 |
| Mean | 12.91 | 12.75 | 12.04 | 12 |
| SD | 1.25 | 1.16 | 1 | 1.37 |
| 10thPercentile | 11.31 | 11.36 | 10.80 | 10 |
| 90thPercentile | 14,48 | 14.11 | 13.40 | 14 |
| Range | 7.56-17.03 | 8.22-15.89 | 9.80-14.20 | 8-17 |
Table 6: Comparison of descriptive statistics for me narcheal age (retrospective method) of Bengali girls and reference girls.
De represents that 40% girls are under nutrient in respect to MUAC (mm) [4]; Giuseppina 308 girls experience menarche in between 12- 12.9 years (Table 6) [5]. Age at menarche has positive correlation with chest circumference, waist circumference, and hip circumference. In study 6, Haboubi and Rizwana have higher anthropometric variables which influence early menarche [6].
Discussion
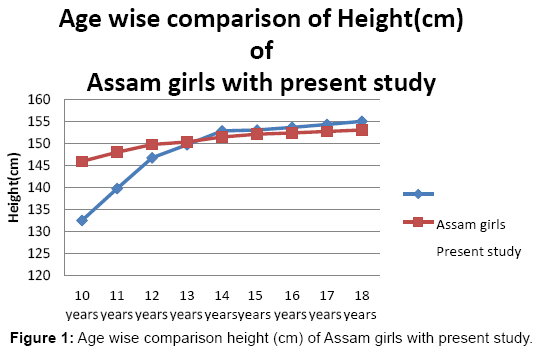
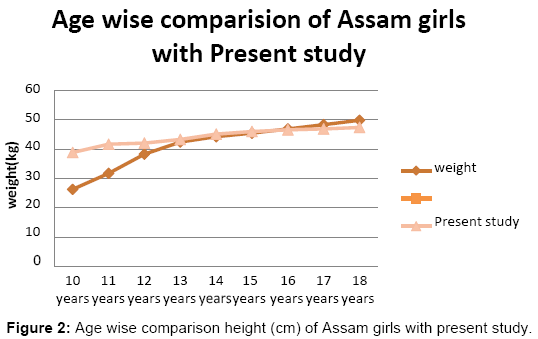
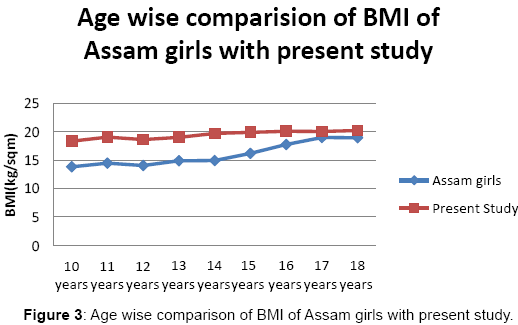
In present it is observed that age wise mean value of anthropometric measures are increasing which shows growth spurt in Adolescence period. The overall means, standard deviations of Height and weight of the adolescent girls were 150.01 cm (4.81) and 44.06 kg (5.70) respectively. Among skin folds Triceps skinfold is 8.98 mm (2.03) According to Table 1 mean height increases (7.54 cm) progressively from 10 to 19 years, 8.76 kg weight increases from 10 to 19 years, regular positive age trend was also found in all the skinfolds measurements. Figures 1-3 represent comparisons between rural people of Assam and rural adolescent girls of Salboni West Bengal which show at age of 13- 19 years mean weight Height coincide each other [7-9].
Conclusion
The menarcheal age of the present sample was lower than the most of previous studies conducted among the bengalee Hindu girls Kolkata. The average age at menarche of this population is going down rapidly in 1920 and moderately in 1950s and currently a possible stability in age at menarche among the adolescent. Secular trend in age at Menarche shows general improvement of nutrition status and living condition and better health services, health services provide counselling services (e.g. Anwesha Clinic) which provide knowledge about reproductive health, hygiene. During past century there has is secular trend towards an earlier state of menarche on set of menarche in developed countries, with a decline of 2-3 months per Europe and United States. General improvement in health and education has been suggested downward trend in menarche.
References
- Agarwal KN, Tripathi AM, Sen S,Kaliyar GP (1999) Physical growth and adolescence. IndPaediatr 11:93-97.
- Beghin I, Cap M, Dujardin B (1988) A Guide to Nutritional Assessment. WHO, Geneva, Switzerland.
- Brabin L, Brabin BJ (1992)The cost of successful adolescent growth and development in girls in relation to in relation to iron and vitamin A status. Am J ClinNutr 55:955-958.
- De Onis M, Habicht JP (1996) Anthropometric reference data for international use: recommendations fromWHO Expert Committee. Am J ClinNutr 64: 650-658.
- Giuseppina D (2000) Nutrition in Adolescence. PediatrRev 21: 32-33.
- Haboubi J, Rizwana B (2009) A Comparison of the Nutritional status of adolescents from the selected schools of south India and UAE: A Cross-sectional study. Indian J Com Med 34:108-111.
- Kalhan M, Vashisht B, Kumar V, Sharma S (2010) Nutritional status of adolescent girls of rural Haryana. Internet J Epidemiol 8: 1.
- Kanade AM, Joshi SB, Rao S (1999)Undernutrition and adolescent growth among rural Indian boys. IndianPediatr 36: 145-156.
- Seema C, Mishra CP, Shukla KP (2003) Nutritional status of adolescent girls in rural area of Varanasi. Indian J PrevSoc Med 34: 1-2.
Relevant Topics
- Acupuncture Therapy
- Advances in Naturopathic Treatment
- African Traditional Medicine
- Australian Traditional Medicine
- Chinese Acupuncture
- Chinese Medicine
- Clinical Naturopathic Medicine
- Clinical Naturopathy
- Herbal Medicines
- Holistic Cancer Treatment
- Holistic health
- Holistic Nutrition
- Homeopathic Medicine
- Homeopathic Remedies
- Japanese Traditional Medicine
- Korean Traditional Medicine
- Natural Remedies
- Naturopathic Medicine
- Naturopathic Practioner Communications
- Naturopathy
- Naturopathy Clinic Management
- Traditional Asian Medicine
- Traditional medicine
- Traditional Plant Medicine
- UK naturopathy
Recommended Journals
Article Tools
Article Usage
- Total views: 5612
- [From(publication date):
February-2017 - Apr 02, 2025] - Breakdown by view type
- HTML page views : 4605
- PDF downloads : 1007


