Analytical Method Development and Validation of Trazadone Hydrochloride in Bulk and Solid Dosage Form Using Uv Spectrophotometer And Uhplc Method
Received: 02-Aug-2022 / Manuscript No. jabt-22-73538 / Editor assigned: 04-Aug-2022 / PreQC No. jabt-22-73538(PQ) / Reviewed: 18-Aug-2022 / QC No. jabt-22-73538 / Revised: 22-Aug-2022 / Manuscript No. jabt-22-73538(R) / Published Date: 29-Aug-2022
Abstract
A new simple , accurate , rapid and precise isocratic , ( ultra-high performance liquid chromatography) ,( UHPLC ) method was developed and validated for determination of trazodone in bulk drug and tablet dosage form .analytical tech UV detector and column with 100 mm x 4.6 mm i.d . And 2.5 µm particle size methanol’s 60 with OPA (60: 40 v/v) PH were used as the mobile phase for the method. The detection wavelength was 249 mm and flow rate were 0.7ml/min .in the developed method. The retention time of trazodone were found to be 4.641 min .the method was validated according to the regulatory guidelines with respect to specificity, precision, accuracy, linearity, and robustness, etc
Keywords
Trazodone HCL; UHPLC; UV spectroscopy; Validation; Method development
Introduction
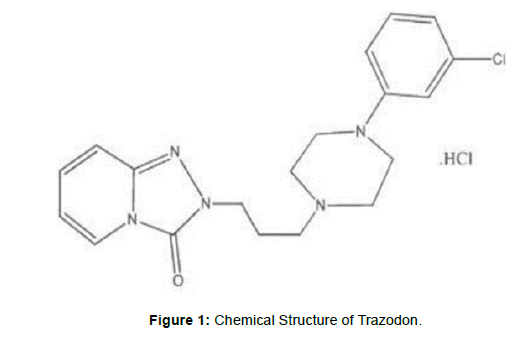
Trazodone, chemically designed as (2-3[4-(3-Chlorophenyl) piperazin -1-yl] propyl} 2h, 3h, -[1, 2, 4 triazolo [4, 3 - a ] pyriclin -3 - one (fig: 1). category of anti- depressant [1]. (Figure 1) (Table 1) According to the information collected from literature method the determination of trazodone HCL out of this method only one method is in UHPLC.
| Fig No | Column used | Mobile phase, Flow Rateand Wavelength | Inj. Vol. | Observation | Conclusion |
|---|---|---|---|---|---|
| 1 | Agilent C18 (100 ×4.6mm, 2.5μ) |
Methanol + 0.1% (OPA)Water (80+20 %v/v), 249nm, Flow rate 0.7mL | 20µl | Sharp Peaks were not obtained | Hence rejected |
| 2 | Agilent C18(100 ×4.6mm, 2.5μ) | Methanol + (0.1% (OPA pH3.0 Water (50+50 %v/v), 249nm, Flow rate 0.7mL | 20 μl | Sharp Peaks were not obtained | Hence rejected |
| 3 | Agilent C18 (100 ×4.6mm, 2.5μ) | Methanol + 0.1% OPA pH3.0)Water (60+40 %v/v), 249nm, Flo rate 0.7mL | 20 μl | Sharp Peaks were obtained | Hence selected |
Table 1: Different Trials of Chromatographic Condition
The determination of trazodone HCL in tablet dosage form we describe a simple accurate, sensitive and validated UHPLC method of trazodone with total run time 10 minutes for the determination of trazodone.
Materials and Methods
Standards Drugs
Trazodone HCL of purity 99% w/w procured from Zydus Cadila Health Care ltd. gift sample
Apparatus
The analysis of drugs was carried out on Agilent (110) software system UV detector. Equipped with reverse phase (Agilent) C18 column (4.6 id x 100 mm: 2.5 μm). A 20 μl injection loop and UV absorbance detector and running UV analyst software.
Preparations of Standard Solutions
Accurately weight and transfer 5mg Trazodone working standard into 10 ml volumetric flask as about diluent Methanol completely and make volume up to the mark with the same solvent to get 500μg/ml standard (stock solution) and 15 min sonic ate to dissolve it and the resulting stock solution 0.1ml was transferred to 10 ml volumetric flask and the volume was made up to the mark with mobile phase Methanol: Water (0.1% OPA prepared in (MEOH 60+40 Water v/v) solvent.
Sample Solution Preparations
Weight 20 trazodone tablets and calculate the average weight, accurately weight and transfer the sample equivalent to 5mg of trazodone into a 10 ml volumetric flask and diluent was added to make up the volume solicited for 10 min with occasional swirling the above solution was filter through 0.45 ml of this solution diluted up to 100 ml with diluent.
Optimized chromatographic conditions
• Equipment: ultra-high performance liquid chromatography.
• Column: C18 (4.6 x 100mm) 2.5 μm
• Mobile phase: methanol: orthophosphoric acid (60: 40)
• Flow rate: 0.7 ml /min
• Wavelength: 249 nm
• Injection volume: 20 ml
• Run time: 10 min
Preparation of orthosphosphoric acid (PH: 3.2)
0.1% OPA (orthophosphoric acid) makes volume 100 ml volumetric flask, the volume was adjusted to PH 3.2
Method Validation
Analytical method validation was carried out as per ICH method validation guidelines to follow parameters such as precision, accuracy, linearity, robustness, LOD, and LQD, repeatability etc.
Precision
The method was established by analyzing various replicates standards of trazadone all the solutions was analyzed thrice in order to record any intra- day and inter-day variation in the result that concluded repeatability of the retention time and expressed as mean and % RSD calculated from the data obtained.
Accuracy
The accuracy of analytical method is the closeness of test results obtained by that method to the true value. Accuracy many often the expressed as percent recovery by the assay of known added amount of analyte the accuracy of an analytical method is determined by applying the method to analyzed samples to which known amounts of analyte have been added .
Linearity
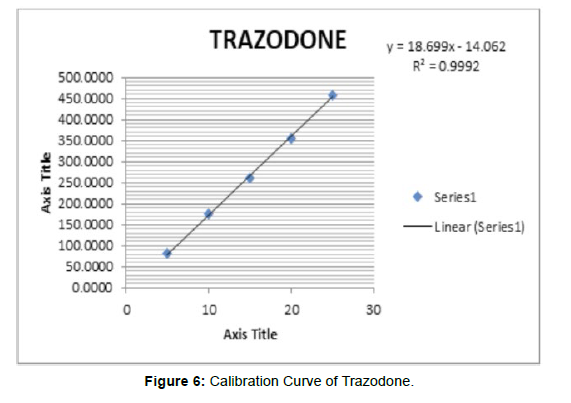
The linearity of the analytical method is determined by mathematical treatment of test results obtained by analysis of samples with analyte concentrations across the claimed range. Area is plotted graphically as a function of analyte concentration.
Limit of detection and limit of quantification
Detection and quantification limits were determined through dilution method using S/N approach by injecting a 20 ml sample. LOD was considered as the minimum concentration with a signal to noise ratio of at least (3 S/N). LOQ was minimum concentration with signal to noise ratio of at least (10 S/N)
Robustness
The mobile phase composition was changed in (±1 ml/min) proportion in the mobile phase composition and flow rate was (±1 ml/ min-1) the changed in detection wavelength.
Repeatability
Precision of the system was determined. Peak areas were measured and % RSD was calculate
Result and Discussion
UV Spectroscopy
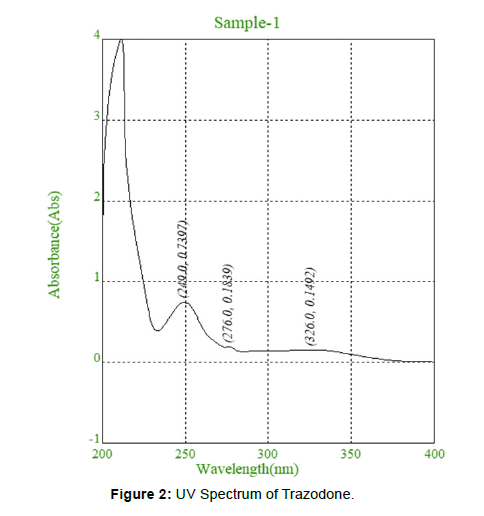
UV absorption of 10 μg/mL solution of Trazodone in methanol was generated and absorbance was taken in the range of 200-400 nm. λ max [2]. (Figure 2)
Sample preparation
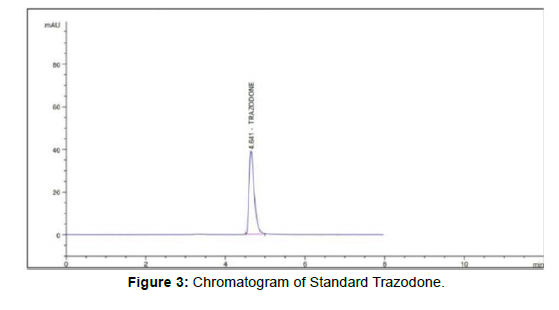
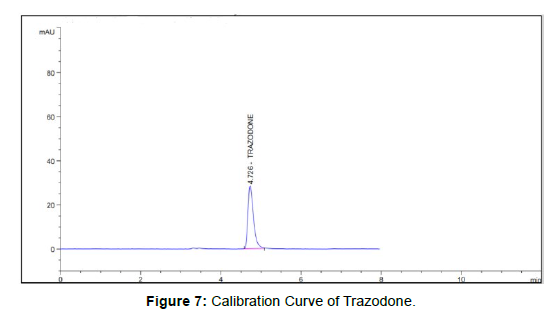
The mobile phase of MEOH + 0, 1% (OPA) water, PH =3.0, water in proportion of 60:40v/v) flow rate 1.0 ml gave adequate retention at 4.641min [3]. (Figure 3)
Method Validation
Precision
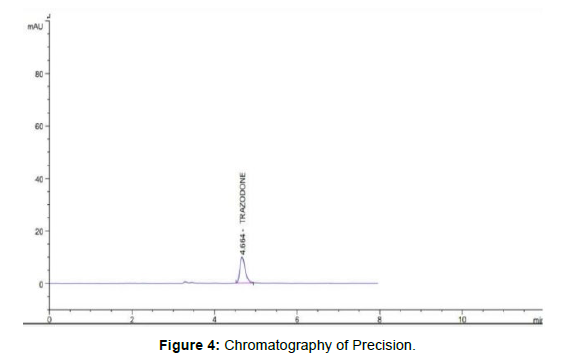
Intraday and interday precision for trazodone which shows the high precision % amount in between 5% to 30% indicates to analytical method that concluded [4]. (Figure 4) (Table 2, 3)
| Drug | Concn(µg/ml | Intraday Precision | Inter day Precision | ||||
|---|---|---|---|---|---|---|---|
| Mean± SD | %Amt Found |
%RSD | Mean± SD | %Amt Found |
%RSD | ||
| TRZ | 5 | 82.01±0.63 | 5.14 | 0.76 | 80.83±0.97 | 5.08 | 1.20 |
| 15 | 279.62±0.35 | 14.96 | 0.13 | 267.33±1.15 | 15.06 | 0.43 | |
| 25 | 465.82±5.31 | 25.68 | 1.14 | 463.77±3.46 | 25.57 | 0.75 | |
Table 2: Result of Intraday and Inter day Precision for Trazodone
| METHOD | Drug | Conc (µg/ml) |
Interday Precision | Intraday Precision | ||
|---|---|---|---|---|---|---|
| Mean± SD | %Amt Found | Mean± SD | %Amt Found | |||
| UV | Trazodone HCL | 20 | 0.2558±0.96 | 101.54 | 0.2585±0.96 | 102.40 |
| 30 | 0.4084±1.26 | 66.77 | 0.4016±0.00 | 99.84 | ||
| 40 | 513.1957±1.26 | 73.88 | 0.5492±0.06 | 73.13 | ||
Table 3: Result of Intraday and Inter day Precision for UV
Accuracy
Average recoveries studies preformat different level of concentration (80%, 100 %, 120%) the 5 recovery was formed to be within the limit 98 % to 100 %, the method is accurate [5]. (Table 4, 5)
Drug |
Sr no | Level (%) | Amt take n (µg/ml) | Amt added (µg/ml) | Amt . found ±S.D | Amt recovered mean ±S.D | % recovery mean ±S.D |
|---|---|---|---|---|---|---|---|
| TRZ | 1 | 80% | 5 | 4 | 9.9 ± 0.038 | 4.09±0.038 | 102.23 ± 0.94 |
| 2 | 100% | 5 | 5 | 10.03 ±0.042 | 5.03 ± 0.042 | 100.58 ± 0. 83 | |
| 3 | 120% | 5 | 6 | 11.08 ±0.015 | 6.08 ± 0.015 | 101.33 ± 0.25 |
Table 4: Result of Recovery Data for Trazodone
METHOD |
Level (%) | Amt. taken (ug/ml | Amt. Added (ug/ml |
Absorbance Mean* ± S.D. |
Amt. recovered Mean *±S.D. | %Recovery Mean *± S.D. |
|---|---|---|---|---|---|---|
| 80% | 10 | 8 | 17.92 ±0.04 | 7.92±0.04 | 98.95 ±0.47 | |
| UV | 100% | 10 | 10 | 19.82 ±0.02 | 20.58±0.02 | 98.18 ±0.25 |
| 120% | 10 | 12 | 21.94 ±0.02 | 11.94±0.02 | 99.97 ±0.13 |
Table 5: Recovery Studies Trazodone for UV method
Linearity
Linearity of trazodone was observed in the range of 5-25μg/ ml, and UV 10-50μg/ml, detection wavelength used was 249 nm the calibration curve yielded correlation coefficient (r2) 0.9992 and 0.9992 for trazodone respectively [6]. (Figure 5) (Table 6, 7)
Sr no |
concentration (µg/mg) | Area of trazodone |
|---|---|---|
| 1 | 5 | 80.9380 |
| 2 | 10 | 175.8961 |
| 3 | 15 | 262.8816 |
| 4 | 20 | 355.2099 |
| 5 | 25 | 458.8400 |
Table 6: Linearity of Trazodone
Sr. No. |
CONC. | AVG ABS |
|---|---|---|
| 1 | 10 | 0.1125 |
| 2 | 20 | 0.2667 |
| 3 | 30 | 0.4087 |
| 4 | 40 | 0.5202 |
| 5 | 50 | 0.6916 |
Table 7: Linearity of UV
Repeatability
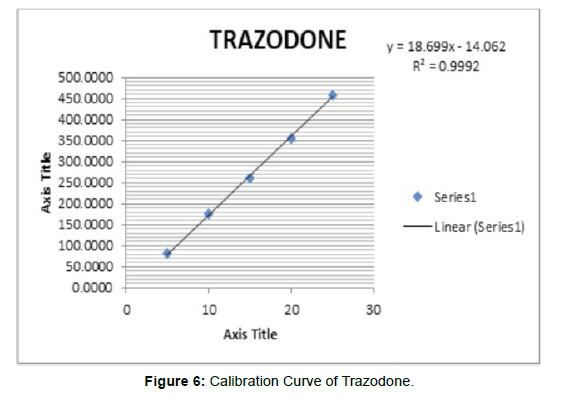
Repeatability studies trazodone was found to be, the %RSD was less than 2, which shows high percentage amount found in between 100% to 102% indicates the analytical method that concluded [7]. (Figure 6) (Table 8)
| Sr no | Concentration of trazodone (mg/ml) | Peak area | Amount found (mg ) | % amount found |
|---|---|---|---|---|
| 1 | 15 | 270.268 | 15.18 | 101.18 |
| 2 | 15 | 268.910 | 15.18 | 101.18 |
| 3 | Mean | 269.59 | 15.18 | 101.18 |
| 4 | SD | 0.02 | 0.02 | 0.02 |
| 5 | %RSD | 0.20 | 0.20 | 0.20 |
Table 8: Repeatability Studies on Trazodone
LOD and LOQ
• The LOD of trazadone was founded to be 0.1605 (μg/ml) analytical methods concluded.
• The LOQ of trazodone was found to be 0.4866 (μg/ml) analytical methods that concluded.
Robustness
The changes were did flow rate ( 1ml/min -1) PH of mobile phase composition and wavelength % RSD for peak area calculated which should be less than 2% the result shown analytical method concluded [8]. (Figure 7) (Table 9)
Parameters |
Conc.(µg/ml) | Area (mean +SD) | %RSD |
|---|---|---|---|
| MP composition(59ml+41ml) Methanol + 0.1%water with OPA |
15 | 342.9188+0.41953 | 0.12 |
| MP composition(61ml+39ml) Methanol + 0.1% (OPA)water with OPA |
15 | 343.89+02+0.94 | 0.27 |
| Wavelength change 248nm | 15 | 371.4+0.25 | 0.07 |
| Wavelength Change 250nm | 15 | 311,48+1.73 | 0.56 |
| Flow rate change(0.6ml) | 15 | 392.89+2.29 | 0.12 |
| Flow rate change(0.8ml) | 15 | 298.09+0.33 | 0.11 |
Table 9: Result of robustness study of trazodone
Conclusion
The presented project work was planned to developed simple, accurate, precise, and cost effective UHPLC method or quantification of TRAZADONE HCL by ASSAY METHOD in husk as API and to explore its applicability for marked formulation. The above study gives the analysis of trazodone hydrochloride by using UHPLC methods and UV spectroscopic methods. Fig 1, Chemical Structure of Trazodon.
The proposed method was highly sensitive, reproducible, reliable, rapid, robust and specific therefore, this method can be employed in quality control to estimate the amount of trazodone, hydrochloride in bulk and in pharmaceutical dosage forms.
Acknowledgement
Thanking for P.S.G.V.P Mandal College of pharmacy for providing the facilities and financial support in project work.
References
- Shewale MS, Siddheshwar S, kolhe M (2020) Method Development and Validation of Trazodone HCL. Int j anal exp modal anal 12: 1395-1403.
- Ravishankar P, Gowthami S, Rao GD (2014) A Review on Analytical method development. IJRPB 2: 1183.
- Rao JS, Rambabu R, Vidhyadhara S, Ram J (2014) Method Development and Validation of Trazodone Hydrochloride by RP-HPLC. World J Pharm Res Vol 3: 1395.
- Gindy AEE, Farouk M, Aziz OAE, Abdullah EA (2009) Stability Indicating Assay of Trazodone Hydrochloric Using High Performance Liquid Chromatography. Res J Appl Sci 5: 2028-2034.
- Kumar RS, Manjunatha DH, Shaikh SMT, Seetharamappa J, Harikrishna K (2006) Sensitive Extractive Spectrophotometric Methods for the Determination of Trazodone Hydrochloride in Pharmaceutical Formulations. Chem Pharm Bull (Tokyo) 54: 968-971.
- Rai R, Gogate S, Soni P, Omray LK (2018) Validated RP-HPLC Method for the Estimation of Trazodone Hydrochloride in Marketed Formulation. Asian Journal of Pharmaceutical Sciences 7: 39-47.
- Pai NR, Pusalkar DA (2012) Development and Validation of liquid chromatographic method for Trazodone hydrochloric, J Chem Pharm Res 4: 1657-1664.
- Salama FM, Attia KAM, Said RAM, El-Olemy A, Abdel-Raoof AM (2017) Spectrophotometric Methods for the Determination of Trazodone Hydrochloride in Presence of its Alkaline Degradation Product. Inoorginal Int J Sci 4: 5-11.
Indexed at, Google Scholar, Crossref
Citation: Prakash CP, Patil SA, Pawar SP (2022) Analytical Method Development and Validation of Trazadone Hydrochloride in Bulk and Solid Dosage Form Using Uv Spectrophotometer and Uhplc Method. J Anal Bioanal Tech 13: 474.
Copyright: © 2022 Prakash CP, et al. This is an open-access article distributed under the terms of the Creative Commons Attribution License, which permits unrestricted use, distribution, and reproduction in any medium, provided the original author and source are credited.
Share This Article
Open Access Journals
Article Usage
- Total views: 2108
- [From(publication date): 0-2022 - Apr 26, 2025]
- Breakdown by view type
- HTML page views: 1609
- PDF downloads: 499

