Analysis of Start, End and Length of the Growing Season and Number of Rainy Days in Semi-Arid Central Refit Valley of Oromia State, Ethiopia
Received: 26-Jun-2018 / Accepted Date: 14-Jul-2018 / Published Date: 23-Jul-2018 DOI: 10.4172/2329-8863.1000386
Keywords: Growing season; Number of rainy days; Climate variability; Seasonal rainfall; Dry spell occurrence
Introduction
Agriculture is the backbone of the Ethiopian economy. It is also the source of income for about 80% of the labor force in Ethiopia [1-4]. However, Ethiopian agriculture is dominated by small holder farmers with an average per capita land holding of less than a hectare. The production system mainly depends on rain fed system and low input including fertilizer and pesticides used. The major source of water for low productivity agriculture in Ethiopia is natural rainfall. Assessing seasonal rainfall characteristics based on past records is essential to evaluate drought risk and to contribute to development of drought mitigation strategies.
From different reports early onset of the rainy season leads to crop germination, since most farmers sow in dry soil. If a long dry spell follows, the seedlings die a “false start” [5-7] and often lead to be reshown. According to Segele and Lamb [8] reports, the major causes of agricultural failure in rift valley of Ethiopia are frequent dry spells of about 10 days length, as well as a shorter growing period due to replanting or late onset and/or early cessation of rain. Reliable estimation of onset, cessation of rain and length of growing season could help optimize agricultural productivity strategies in semi-arid areas [9].
Ethiopia is among the most vulnerable countries in Africa due to its great reliance on climate-sensitive agriculture [10-13]. Factually, strong links have been observed between climate variability and the overall performance of Ethiopia’s economy, reflected by high correlation between rainfall and gross domestic product (GDP) fluctuations. Climate variability, particularly rainfall variability and associated droughts, have been major causes of food insecurity and famine in Ethiopia [13-15]. To recap, characterization of rainfall indices, onset, cessation, length of growing period and number of rainy days is very important where the livelihood of people depend on agriculture and agriculture in turn depends on rainfall pattern [16]. Therefore, the main objectives of this paper are to explore the start, end and length of growing season and number of rainy days in the past year of Melkassa, Mieso and Adami Tulu areas in semi-arid CRV of Oromia state, Ethiopia.
In Ethiopia, agriculture remains the most important sector of the economy. The contribution agriculture to the national economies through food supply, employment creation, export earnings, etc., is enormous [17,18], but it is predominantly rain fed. Therefore, changes in rainfall conditions have a direct and immediate impact on the performance of agricultural sector as well as on the country’s total GDP [18,19]. As reported by Awulachew et al. [20], natural rainfall is the main source of water for crop production as irrigation covers only 5% of the cultivated land in the country. According to the study of Hagos et al. [21], the impact of rainfall variability on the Ethiopian economy, and found that rainfall variability in the country led to a production deficit by 20% and grinding of poverty rates by 25% which cost the economy over one-third of its growth potential.
Ethiopia is a large complex country, with complex patterns of rainfall and livelihoods [22]. Between the mid-1970’s and late 2000’s, Belg and Kiremt rainfall, based on quality-controlled station observations, decreased by 15-20 percent across parts of southern, southwestern and southeastern Ethiopia [23] and resulted reduced production in other areas. The main growing season of rainfall and annual maximum and minimum temperature exhibited a slight increase in the Central low land of Oromia state in Ethiopia and this reveals that there is high variability of climate aspects in region, which signals the likely impact of this variability on crop production by increasing the probability of occurrence of dry spell particularly in the study areas [24]. Therefore, the main objective of this paper to address the seasonal rainfall variability and the occurrence dry spell at the semi-arid central rift valleys of Oromia in respect of crop production.
Materials and Methods
Descriptions of the study areas
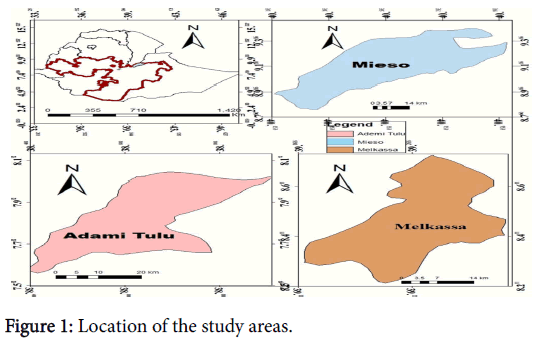
The areas under the study were located in central semi-arid rift valley of Oromia state, Ethiopia. The first study site was Melkassa near to Adama about 115 km from Addis Ababa. The second study site Adami Tulu located at 160 km to south east of Addis Ababa. The third study site Mieso located to the east of Addis Ababa at about of 300 km. The areas is known by fluctuated diurnal and daily temperature and erratic rainfall which is characterized by drought prone areas. The soil type at the study site is a well-drained silty clay loam soil largely developed from volcanic parent material. Crops grown in the area include maize (Zea mays L.), sorghum (Sorghum bicolor), teff (Eragrostis teff) and other cereals, pulses, and oil crops (Table 1 and Figure 1).
| Station | Geographical Coordination | Data Periods | Duration of the Data Set | ||
|---|---|---|---|---|---|
| Latitude(N) | Longitude(E) | Altitude(m) | |||
| Melkassa | 8°24 | 39°12 | 1550 | 1977-2013 | 36 |
| Mieso | 8°48 | 40°9 | 1470 | 1973-2012 | 39 |
| Ademi Tulu | 7°52 | 38°43 | 1640 | 1973-2012 | 39 |
Table 1: Description of meteorological stations and rainfall database of the three stations used in the analyses.
Data sources and quality assessment
The past climate of the three study areas found in the semi-arid Central Rift Valley (CRV) of Ethiopia was characterized using ground observation data that were recorded at MARC (1977-2013), ATARC (1973-2012), and Mieso (1973-2012) meteorological stations. The whole dataset did not have more than 10% missing values. The characterization focused on determination of occurrence of dry spell and the variability of seasonal rainfall using procedures described by Stern et al. [25]. INSTAT software v3.37 was used for analysis of the daily rainfall data. The data series was also examined for homogeneity using the cumulative deviation method and no heterogeneity was detected. Some missing and the outlier data were estimated using INSTAT+v3.37 first order Markov-chain simulation model Stern and Knock. The main reason for choosing this model to fill the missing daily rainfall, minimum and maximum temperature data is that it does not overstate the result and gives a more accurate model to each of the study areas as has been explained by NMSA [26].
Analysis of start, end and length of the growing season
The beginning of the rainy season can be defined as the first occurrence of at least 20 mm rainfall totaled over 3 consecutive days [25]. This potential start can be a false start if an event, dry spell, occurs afterwards, as a dry spell of 9 days in the next 21 days. This paper also adopted this approach and the earliest start of season (SOS) was defined as the first occasion when the rainfall accumulated within a 3-day period was 20 mm. Since the study areas exhibit a mono modal rainfall pattern (long rains during April-September), April 1st was taken as the earliest possible planting date for the study area. Accordingly, the potential starting date of the growing season was defined as the first occasion from April 1st that has at least 20 mm rainfall within a 3-day period. An experimental evidence revealed the choice of 50% ETo as the threshold for water availability, for the crop water stress becomes severe when the available water drops below half of the crop water demand (<0.5 ETo). Hence, the minimum required rainfall amount of a particular date of onset should be at least half of the amount of evapotranspiration (ETo) of that particular date.
The end of the season (EOS) was determined from rainfall-reference evapotranspiration relationship. The end of the season is the end of rainy season plus the time required to evapotranspire 100 mm of stored soil (Vertisols) water [25]. There was humid period, when ETo was less than the rainfall at the study areas. So, surplus stored soil water was available to continue the growing season beyond the end of the growing season or end of rains? The rainy season was assumed to end after 1st September when 5-day cumulative rainfall was less than 0.5 of the ETo. At the EOS the reference evapotranspiration was 5.5 mm day-1, 5.5 mm day-1 and 5.6 mm day-1 at Mieso, Melkassa and Adami Tulu, respectively. Therefore, the end of the growing season was extended by 18 days (100 mm/5.5 mm day-1), 18 days (100 mm/5.5 mm day-1) and 18 days (100 mm/5.6 mm day-1) at Mieso, Melkassa and Adami Tulu respectively.
Length of the growing season (LGS) is a key factor in deciding on the maturity of cultivars to be grown in dissimilar rainfall regimes [27]. Therefore, LGS was considered as the period from the start of the rain to the cessation of the growing season. It was calculated by subtracting the date of the beginning of the rainy season from the date of end of the growing season [28].
Analysis of probability of occurrence of dry spells
For each meteorological station (Mieso, Melkassa and Adami Tulu) the daily rainfall data were fitted to a simple Markov chain model. The chance of rain was assessed both when the previous day was dry, i.e., the chance that a dry spell would continue, and also when the previous day was rainy, i.e., the chance that a rainy spell would continue, which is known as a Markov chain. The probability of dry spell lengths of 5, 7, 10 and 15 days during the growing season were determined from the Markov chain model to obtain an overview of dry spell risks during the crop growing season and provide a viable decision aid to various practitioners. Dry spells lengths of 5 to 15 days were selected in order to accommodate both drought sensitive and drought tolerant cultivars during the growing season. The following expressions were used in Markov chains analysis of dry spell in the study areas [29]:
Pd=Fd/n----------- Equation 1
Pw=Fw/n----------- Equation 2
Pww=Fww/Fw----------- Equation 3
Pdd=Fdd/Fw----------- Equation 4
Pwd=1-Pdd----------- Equation 5
Pdw=1-Pww----------- Equation 6
where Pd is the probability of day being dry and Fd is number of dry day, Pw is the probability of day being wet, Fw is the number of wet days and n is the number of observation, Pww is the probability of wet day followed by another wet days, Fww is the number of wet days followed by other wet day, Pdd is the probability of dry day followed by another dry day, and Fdd is number of dry day followed by another dry day during the growing season.
Results and Discussion
Start of the growing season (SOS)
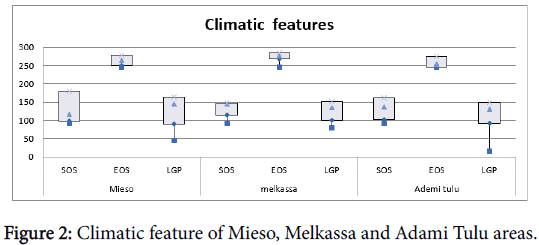
Results of analysis of rainfall data at the three stations indicate that the growing season starts on May 26 at Mieso and Adami Tulu areas and on May 27 at Melkassa area with a corresponding coefficient of variation of 31.3, 22.2, and 24.5% (Table 2 and Figure 2). These dates correspond to 148th and 149th days of the year (DOY) at Mieso and Adami Tulu, and Melkassa areas, respectively. This indicates that the start of the growing season is late by a day at Melkassa area compared to the other two areas in the Central Rift Valley of Ethiopia. Nevertheless, the values of the coefficient of variation recorded at the three stations indicate the existence of high variability particularly at Mieso area.
| Seasonal Rainfall Features | Minimum | Quartile 1 (25%ile) | Quartile 2 (Median) | Quartile 3 (75%ile) | Maximum | Mean | S.D (±) | C.V (%) |
|---|---|---|---|---|---|---|---|---|
| Mieso | ||||||||
| TSRF(mm) | 137.2 | 302.38 | 416.15 | 596..8 | 716.2 | 438 | 168 | 38.4 |
| Melkassa | ||||||||
| TSRF(mm) | 347.7 | 510.4 | 593.7 | 648.2 | 754.8 | 577.5 | 106 | 18.4 |
| Adami Tulu | ||||||||
| TSRF(mm) | 36.3 | 351.12 | 412.75 | 505.55 | 710.5 | 430.84 | 143 | 33.2 |
Table 2: Descriptive statistics of important seasonal rainfall characteristics at Mieso, Melkassa and Adami Tulu weather stations. TSRF=total seasonal rainfall.
The start of the season (SOS) rainfall in Mieso, Melkassa and Adami Tulu areas varied from September 11th (257 DOY) to April 1st (92 DOY), July 21st (202 DOY) to April 1st (92 DOY) and August 13th (227 DOY) to April 1st (92 DOY), respectively. The mean starting of growing season in Mieso, Melkassa and Adami Tulu has very high standard deviation (SD) of 46, 33 and 36 days, respectively, indicating that the SOS is not stable because the recorded standard deviations are out of the ranges suggested by Reddy. The higher standard deviation of the SOS suggests that pattern could not be understood and thus, decision pertaining to crop planting related activities will be with high risk.
The probability of occurrence of SOS once in four years (25% percentile) corresponds to 102, 126 and 113 DOY at Mieso, Melkassa and Adami Tulu areas, respectively. Whereas the probability of occurrence of SOS twice in four years (50%ile) corresponds to 137, 152 and 155 and three times in four years also corresponds to 191, 177 and 180 DOY for Mieso, Melkassa and Adami Tulu, respectively.
Therefore, earlier planting than on 102th, 126th and 113th DOY is possible in Mieso, Melkassa and Adami Tulu once out of four years’ time. Also, earlier planting than 191th (July 7), 177th (June 24) and 180th (June 27) DOY is possible in three years every four years’ time respectively. Moreover, the reliable planting date of maize and other cereal crops at and around Mieso, Melkassa and Adami Tulu ranges between 137-155 DOY (May 15 to June 2).
End of the growing season (EOS)
The end date of the season (EOS) falls on September 14th at Mieso, October 1st at Melkassa, and September 11th at Adami Tulu areas with coefficient of variation of 5.7%, 4.7% and 4.9%, respectively. The results indicate that the season comes to an end early at Adami Tulu area, followed by Mieso, while it is longer at Melkassa. The end dates of the season correspond to 259th, 275th and 256th DOY for Mieso, Melkassa, and Adami Tulu areas, respectively.
The results of the rainfall analysis further indicate that there is a 25% chance once in four years that the end of the season will fall on 245th and 269th DOY at and around Mieso and Adami Tulu, and Melkassa areas, respectively. On the other hand, there is a 50% chance (twice in 4 years) for the end of the season to be on 255th, 277th, and 250th DOY at and around Mieso, Melkassa, and Adami Tulu areas, respectively. Also, the probability that the end of the season can be on 271th, 285th and 265th DOY for Mieso, Melkassa and Adami Tulu areas, respectively, is three times in four years or 75%. At all the probability levels considered, the end of the season is extended more at Melkassa compared to Mieso and Adami Tulu areas.
Seasonal total rainfall throughout the growing period
The seasonal rainfall of the record period at Mieso ranged from a minimum of 137.2 mm to a maximum of 716.2 mm with a mean value of 438 mm. This indicates the existence of high variability in seasonal total rainfall as was also indicated by the high coefficient of variation (38.4%) (Table 2). The total highest seasonal rainfall was recorded in the year 1987, while the lowest was recorded the following year, 1988.
At Melkassa station, the seasonal rainfall varied from 754.8 mm recorded in the year 2005 to 347.7 mm recorded in the year 2002. The mean seasonal total rainfall, on the other hand, was found to be 577.5 mm with a coefficient of variation of 18.4% (Table 2). This indicates the existence of relatively low variability at Melkassa station as compared to the other two stations. However, the fact that both the highest and lowest rainfall are recorded in recent years indicates the recently growing high variability of rainfall in the area.
The variation in seasonal total rainfall, as obtained from this study, is high in which it varied from 710.5 mm recorded in 1981 to 36.5 mm registered in 1987. The mean seasonal total rainfall was found to be 430.84 mm with relatively high coefficient of variability (33.2%) (Table 2), indicating the existence of high seasonal variability of rainfall at and around Adami Tulu area.
In general, the variability of seasonal rainfall at the study environs shows that there were the risk for crop and livestock production in rain fed agricultural system in past year.
Length of growing season (LGS) and number of rainy days
Results of the analysis indicated that the length of growing season for maize production in the main rainy season ranges from 12 to 192, 12 to 189 and 18 to 194 days at Mieso, Melkassa and Adami Tulu areas, respectively, with corresponding coefficient of variation of 44.5, 25.6, and 37.5% (Table 2). The results indicate that the variability in the length of the growing season, as indicated by the high CV, is very high at Meiso followed by Adami Tulu and Melkassa areas.
The results obtained send a clear message that the LGP at the three stations is highly variable and thus, needs a more caution on planning and adoption of rainwater water harvesting scheme, improving water use efficiency, selecting varieties that are drought tolerant or early maturing, and using tillage practices that conserve soil moisture. If these are not put in place, the sustainability of crop production and thus, the efforts of ensuring food security in the CRV of the country will be jeopardized.
Nevertheless, the results also confirm that maize varieties that require an LGP of up to 180 days can be produced with no risk in and around Mieso, Melkassa and Adami Tulu areas. However, varieties with more than 180 days cycle cannot be produced in the study areas using natural rainfall alone. On the other hand, growing maize varieties with 90 days cycle is also a waste of the growing period, for these 90 days are too short and result in wastage of 90 days of the growing period.
The mean number of rainy days at Mieso, Melkassa and Adami Tulu areas were 99, 97 and 97 with the CV of 14.9%, 10.3% and 6%, respectively. The rainy days varied from 92 to 165, 92 to 147 and 92 to 110 at Mieso, Melkassa, and Adami Tulu, respectively. This indicates that there is high variability in number of the rainy days in semi-arid CRV of Ethiopia with high risk for successful crop production and livestock rearing due to the likely effect on pasture production and water scarcity.
The early onset date suggests that crop cultivars of the longer maturity type could do better with the late onset date [27]. The issue of LGS requires further due attention in that one needs to know the type and level of risks of yield loss associated with cultivars of different maturity categories, requiring different amounts of water during a sequence of growth stages. It is only then that one can confidently pinpoint the most suitable maturity cultivars to be planted in seasons with different onset date scenarios [27]. According to Borrell et al. [30] pointed out that, such weather information guided farming can help in combining the genetic solutions into the management aspects, thus, providing farmers with a range of viable options to combat drought.
Probability of dry spell length occurrence
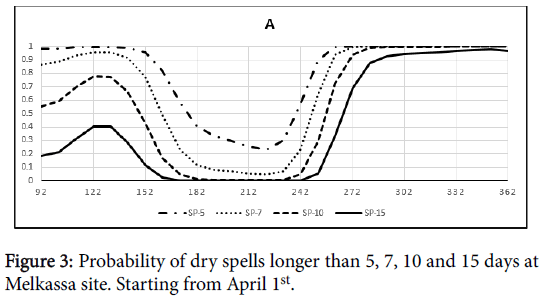
After the 182, 162 and 142 DOY, the probability of getting dry spell length of 5, 7 and 10 days is less than 50% at Melkassa site and drops to below 20% at the beginning of the peak period (June, July and August), which again gradually rises to 40% on 242, 252 and 262 DOY, respectively (Figure 3).
The probability of occurrence of a dry spell length of two weeks (15 days) during the growing season is below 15% which indicates the existence of less risk for drought resistant crops production [31].
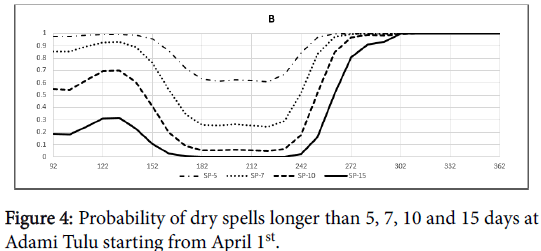
The probability of getting dry spell length of 5, 7 and 10 days on 1st dekadal of April in at Adami Tulu is less than 96, 85 and 60%, respectively. On the other hand, the probability of getting the same dry spell length on 1st dekadal of September falls to 80, 50 and 30% respectively (Figure 4).
During the 2nd dekadal of July, the probability of occurrence of dry spell length of 5, 7 and 10 days drops to 55, 27 and 5%, respectively, which indicates the instability of the growing season rainfall for sowing crops sensitive to water stress like maize, teff and other cereals. It shows that the chance of occurrence of dry spell length of more than 5, 7 and 10 days on 112 DOY is 40% which reduce to below 60, 40 and 20% at the end of June. This indicates that planting maize before 181 DOY has the failure probability of 50% before establishment.
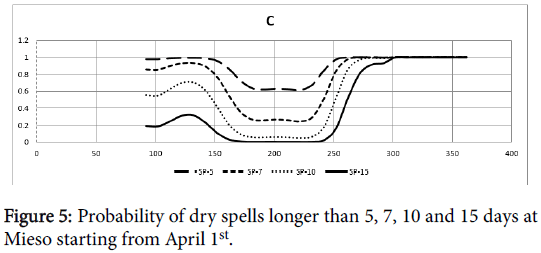
At begging of the growing season on 1st April at Mieso area, the probability of getting dry spell length of 5, 7 and 10 days is 97, 87 and 64% which gradually decreases to 87, 64 and 35% at the end of June, respectively. This implies that the risk of planting Maize before the third dekadal of May is above 50% (Figure 4). However, the probability of a week (7 days long) dry spell length is very low in peak periods.
After 1st dekadal of September, it increases histrionically from 64 to 96% in the 3rd dekadal of September, respectively. The probability of two week (15 day long) dry spell occurrence is found to be below 50% from April to end of September (Figure 5). This condition is inappropriate for maturity and harvesting of crops. However, crops whose cycle extends to October should be supplemented by irrigation.
Generally, for the study periods the probability of longer dry spells increases rapidly from first dekadal of September onwards. To take risks of longer dry spells and decide to plant during earliest months of the season, farmers should get access to irrigation and also other mechanisms that minimize the loss of moisture from the farm land. Likewise, selection of crop variety (drought escapers), cropping system, and tillage practices should be undertaken in order to minimize losses as a result of the dry spells. In this manner, planting earlier than the start of June is possible for the main rainy season at three sites. If a farmer cannot decide to take risks of longer dry spells after planting (called risk averse), it means that he has to wait until all the dry spell probabilities attain minimum values at the end of June or beginning of July.
Conclusion
Among the rainfall parameters, date of start and end of the rainy season, length of the growing season were found to be the most variable climate-related events. Taking April 1st as a starting date, the analysis showed that planting earlier, at three locations for maize, then April 24 (102 DOY), May 4 (126 DOY) and April 14 (113 DOY) are possible only once in every four years’ time for Mieso, Melkassa and Adami Tulu, respectively. The earliest possible end of the rains of the growing season is day 245 (September 1st) for Mieso and Adami Tulu, and September 24 (269 DOY) at Melkassa. The latest one is 271 (September 28), 285 (October 10) and 265 DOY (September 20) at Mieso, Melkassa and Adami Tulu, respectively. The mean LGS of the three stations in the study area in number of days is 111, 126 and 109. In order to adjust their farming practice, farmers need to use, under changing climate, seasonal climate outlook information ‘for successful crop production. The maximum number of rainy days at Mieso, Melkassa and Adami Tulu varies from 92 to 165, 92 to 145, and 92 to 110, respectively. The seasonal mean rainfall at Mieso, Melkassa and Adami Tulu is 438, 577.7 and 430.8 mm. The probability of occurrence of dry spell lengths of 5, 7, 10 and 15 days, at all the three stations, decreases from a maximum around April 1st to a minimum during the peak rainy months (June, July, and August) and then again increases starting from middle of September to April 1st.
References
- Bewket W, Conway D (2007) A note on the temporal and spatial variability of rainfall in the droughtâ€prone Amhara region of Ethiopia. International Journal of Climatology: A Journal of the Royal Meteorological Society 27: 1467-1477.
- IMF (International Monetary Fund) (2002) Ethiopian statistical Appendix Washington DC IMF country report no (02/214).
- World Bank Group (2002) Vietnam Country Assistance Strategy of the World Bank Group: 2003-2006. World Bank in Vietnam.
- Ati OF, Stigter CJ, Oladipo EO (2002) A comparison of methods to determine the onset of the growing season in northern Nigeria. International Journal of Climatology 22: 731-742.
- Raes D, Sithole A, Makarau A, Milford J (2004) Evaluation of first planting dates recommended by criteria currently used in Zimbabwe. Agricultural and Forest Meteorology 125: 177-185.
- Kipkorir EC, Raes D, Bargerei RJ, Mugalavai EM (2007) Evaluation of two risk assessment methods for sowing maize in Kenya. Agricultural and Forest Meteorology 144: 193-199.
- Segele ZT, Lamb PJ (2005) Characterization and variability of Kiremt rainy season over Ethiopia. Meteorology and Atmospheric Physics 89: 153-180.
- Mugalavai EM, Kipkorir EC, Raes D, Rao MS (2008) Analysis of rainfall onset, cessation and length of growing season for western Kenya. Agricultural and Forest Meteorology 148: 1123-1135.
- Hellmuth ME, Moorhead A, Thomas MC, Williams J (2007) Climate risk management in Africa: Learning from practice.
- NMA (National Meteorological Agency) (2007) Climate Change National Adaptation Program of Action (NAPA) of Ethiopia.
- Conway D, Schipper ELF (2011) Adaptation to climate change in Africa: Challenges and opportunities identified from Ethiopia. Global Environmental Change 21: 227-237.
- Rosell S (2011) Regional perspective on rainfall change and variability in the central highlands of Ethiopia, 1978–2007. Applied Geography 31: 329-338.
- Demeke AB, Keil A, Zeller M (2011) Using panel data to estimate the effect of rainfall shocks on small holders food security and vulnerability in rural Ethiopia. Climatic Change 108: 185-206.
- Perrin N, Mearns R, Kononen M, Kuriakose A, Agrawal A (2011) Costing adaptation through local.
- Sorecha EM, Bayissa B, Toru T (2017) Characterization of Rainfall Indices for Crop Production in Kersa District, Eastern Ethiopia: Farmers’ Advisory. Acad Res J Agri Sci Res 5: 134-139.
- Central Statistical Agency (2005) Statistical abstract of Ethiopia. Central Statistical Authority, Addis Ababa, Ethiopia.
- Food and Agriculture Organization of the United Nations (2006) The State of Food Insecurity in the World, Rome, Italy.
- Hassan R (2006) Impacts of climate change on Crop farming in Ethiopia. In: Measuring the economic impact of climate change on Ethiopian agriculture: Ricardian approach, CEEPA Discussion Paper No 21, CEEPA, University of Pretoria, South Africa.
- Awulachew SB, Erkossa T, Namara RE (2010) Irrigation potential in Ethiopia: Constraints and opportunities for enhancing the system. Unpublished Report to the Bill and Melinda Gates Foundation.
- Hagos F, Makombe G, Namara RE, Awulachew SB (2009) Importance of irrigated agriculture to the Ethiopian economy: Capturing the direct net benefits of irrigation, IWMI.
- Livelihoods Integration Unit (2010) The livelihoods atlas for Ethiopia.
- Funk C, Rowland J, Eilerts G, White L (2012) Famine early warning systems network: informing climate change adaptation series a climate trend analysis of Ethiopia.
- Edao Agere L (2017) Trend analysis of seasonal rainfall and annual temperature in semi-arid Central lowland of Oromia state, Ethiopia. Acad Res J Agri Sci Res 5: 509-513.
- Stern RD, Dennett MD, Dale IC (1982) Analysing daily rainfall measurements to give agronomically useful results. I. Direct methods. Experimental Agriculture 18: 223-236.
- NMA (National Meteorology Agency) (1996) Climatic and Agro climatic Resource of Ethiopia. National Meteorology Agency of Ethiopia Addis Ababa 1: 137.
- Mupangwa W, Walker S, Twomlow S (2011) Start, end and dry spells of the growing season in semi-arid southern Zimbabwe. Journal of Arid Environments 75: 1097-1104.
- Reddy GS, Bhaskar SR, Purohit RC, Chittora AK (2008) Markov chain model probability of dry, wet weeks and statistical analysis of weekly rainfall for agricultural planning at Bangalore. Karnataka Journal of Agricultural Sciences 21: 12-16.
- Borrell A, Oosterom EV, Graeme H, David J, Bob H (2003) Using science to combat drought: a case study of stay-green in sorghum. In: Stone R, Partridge I (eds.). Science for Drought. Proceedings of the National Drought Forum. pp: 120-123.
- Messay A (2006) The onset Ceasion and dry spell of small rainfall season (Belg) of Ethiopia National Meteorology Agency, Addis Ababa.
Citation: Edao AL, Kibert K, Mamo G (2018) Analysis of Start, End and Length of the Growing Season and Number of Rainy Days in Semi-Arid Central Refit Valley of Oromia State, Ethiopia. Adv Crop Sci Tech 6:386. DOI: 10.4172/2329-8863.1000386
Copyright: © 2018 Edao AL, et al. This is an open-access article distributed under the terms of the Creative Commons Attribution License, which permits unrestricted use, distribution, and reproduction in any medium, provided the original author and source are credited.
Share This Article
Recommended Journals
Open Access Journals
Article Tools
Article Usage
- Total views: 5341
- [From(publication date): 0-2018 - Dec 21, 2024]
- Breakdown by view type
- HTML page views: 4470
- PDF downloads: 871

