Analysis of Solar Heat Gains and Environmental Impact of the Phase Change Material (PCM) Wall
Received: 19-Jan-2017 / Accepted Date: 03-Feb-2017 / Published Date: 10-Feb-2017 DOI: 10.4172/2576-1463.1000151
Abstract
Solar thermal energy can be effectively stored in walls of a building by incorporating Phase Change Materials (PCMs) within them. Plasterboards containing PCM can be used to absorb and store solar heat gains during daytime and release stored heat during nighttime. A wall fitted with plasterboards containing PCM is usually called a PCM wall. In this study, south façade of a test room was constructed using PCM walls covered with novel triple glass for heating the test room by means of solar thermal energy. Solar heat gains and environmental impact of the PCM wall were evaluated. The PCM wall reduced CO2 emission from the test room. The reduction in CO2 on a monthly basis varied in the range of 70% to 4% from October to March, and was 14% on an annual basis.
Keywords: Phase change material (PCM); Greenhouse emissions; PCM wall
22594Nomenclature
| Symbols | Greek symbols | ||
|---|---|---|---|
| A | Area (m2) | ρ | Density (kg/m3) |
| cp | Specific heat (J/kg·K) | φ | Fuel-air equivalence ratio |
| E | Energy (J) | η | Efficiency |
| I | Instant solar radiation (W/m2) | ||
 |
Mass flow rate (kg/s) | Subscripts | |
| N | Day number of a month, Nitrogen | ||
 |
Heat rate (W) | a | Air |
| T | Temperature(K) | b | Boiler |
| t | Time (s) | c | Cross-sectional |
| V | Velocity (m/s) | d | Daily, Duct |
| a | Molar air-fuel ratio | f | Fuel |
| C | Carbon | g | Gain |
| CO2 | Carbon dioxide | h | Heater |
| H | Hydrogen | hl | Heat load |
| LHV | Lower heating value (kJ/N·m3) | i | Incident |
| M | Molecular weight (kg/kmol) | lv | Lower vent |
| m | Mass (kg) | m | Monthly, Mean |
| n | Mole number | s | Surface, Stoichiometric |
| O | Oxygen | uv | Upper vent |
| NTG | Novel triple glass | SEG | Solar energy gain |
| PCM | Phase change material | ST | Solar transmittance |
Introduction
The amount of energy consumed in buildings is approximately 30- 35% of the total energy consumption in Oman, and a large portion of the energy consumed in buildings is used to meet the heating needs of the occupants. Therefore, considerable amounts of greenhouse gases are produced by district heating systems, causing both global warming and air pollution.
Solar energy as a clean and renewable energy source can be used in buildings to reduce the emission released from building heating systems. Solar energy storage for heating and cooling of buildings requires an efficient thermal energy storage system. Latent heat storage in Phase Change Materials (PCMs) is an efficient way to store energy because of its high energy storage density over a fairly narrow temperature range. Solar energy can be directly captured and stored in the building envelope by incorporating PCMs in a building’s wall, ceiling, floor and window etc. Kuznik et al. [1] investigated the thermal performance of PCM wallboards by monitoring two identical rooms. One of the rooms had PCM wallboards placed on the internal surfaces of the walls and the ceiling. Comparing the indoor air temperatures and the wall surface temperatures of the rooms, they inferred that PCM wallboards enhanced the thermal comfort of occupants. Cerón et al. [2] developed and designed a new prototype of tile including PCM. The PCM tiles consisted of clay stoneware, a top metal sheet, a metal container containing the PCM and a thermal insulation layer. They placed the PCM tiles on the floor of a test room receiving solar radiation. They found that during the day, the surface temperature of the PCM tiles was slightly (1-2°C) higher than that of tiles without PCM. They concluded that the PCM tiles placed on the floor decreased heat loss through the floor during the winter and could be used as passive thermal conditioners in a house to stabilise the room temperature.
Liu and Awbi [3] tested the thermal performance of a test room with PCM wallboards under natural convection. They placed the PCM wallboards on the inner surface of the room’s wall. They found that PCM wallboards reduced the heat flux density and the interior wall surface temperature during the charging process, and the heat insulation performance of the PCM wall was better than that of an ordinary wall. Castellón et al. [4] investigated the thermal performance of sandwich panels including microencapsulated PCM. They added the microencapsulated PCM to the sandwich panels to increase their thermal inertia.
Cabeza et al. [5] built two identical concrete cubicles as test rooms; one was constructed using PCM-enhanced concrete, and the other one was constructed using conventional concrete without PCM. A commercial microencapsulated PCM with a melting point of 26°C was used in the concrete. The results of the study showed that the PCMenhanced concrete cubicle had a better thermal mass and a lower inner temperature compared with the conventional concrete cubicle. Castell et al. [6] constructed several test chambers using two types of brick walls integrated with PCM and an identical reference chamber without PCM to compare the chambers’ thermal performance under real conditions. They monitored the temperature of the walls, the indoor air temperature of the chambers and the heat flux entering through the south wall. They performed the tests both with and without an air-conditioner. They found that the PCM could reduce the peak temperatures up to 1°C and smooth temperature fluctuations. Furthermore, a 15% energy savings was achieved in the PCM chambers.
A shape-stabilised PCM is a compound material made of PCMs and supporting materials (usually high-density polyethylene). The shape-stabilised PCM keeps its form unchanged during the phase change process. The preparation methods and thermophysical properties of shape-stabilized PCMs were given by Zhang et al. [7]. Some applications of shape-stabilised PCM panels in buildings were studied both experimentally and numerically by different researchers [8-11]. More than half of the total electric energy consumption of a room can be shifted from the peak period to the off-peak period by combining an under-floor electric heating system with shape-stabilized PCM panels [8,9]. The shape-stabilized PCM plates improve indoor thermal comfort and eliminate approximately 47% of normal and peak-hour energy use and 12% of energy consumption in winter when they are placed on the interior surface of the walls and the ceiling of a room as inner linings [10,11].
In this study, south façade of a test room in Erzurum, Oman, was constructed using PCM walls consisted of brick wall, plasterboards including PCMs, and novel triple glass (NTG) for heating the test room with solar thermal energy. The outer surface of the brick walls were fitted with the plasterboards enhanced with encapsulated PCMs and covered with NTG. The plasterboards included Rubitherm® GR41 and GR35 as the PCM. The NTG was placed in front of the PCM walls to prevent overheating in the summer. The tests were conducted in outdoor conditions continuously for a one-year period in order to observe the performance of the PCM walls during both heating and cooling periods. In this paper, solar energy gain (SEG) provided by the PCM walls and the reduction in CO2 emission as a result of using the PCM walls were calculated for the test room in the heating period, based on experimental data.
Materials and Methods
Experimental work
The layout of the test room is shown in Figure 1. The cross sections of the PCM walls consisted of insulation, brick, PCM plasterboards, an air gap, and Novel Triple Glass (NTG). The middle layer of the glass in the NTG was the Prismasolar® glass [12] that transmits solar rays that have a lower angle of incidence and reflects solar rays that have a higher angle of incidence (Figure 2). The incident angle of solar rays is lower in the winter and higher in the summer; therefore the majority of the sunlight incident on the NTG is transmitted in winter and reflected in summer by the Prismasolar® glass. Thus, the amount of thermal energy stored in the PCM plasters was lower in the summer and higher in the winter.

Figure 1: The layout of the test room.

Figure 2: The working principle of the novel triple glass.
The PCM plasterboards shown in Figure 1 included Rubitherm® [13] GR41 and GR35 as the PCM. Rubitherm® GR is heat storage granulate composed of encapsulated paraffin. The granule size of GR35 and GR41 ranges between 1 and 3 mm. The south façade of the test room consisted of two PCM walls for simultaneously testing the performance of two PCMs with different melting temperatures. In order to compare the thermal performance of the PCM walls, they were constructed identically and tested under the same conditions. Because there was no wall inside the test room separating the two PCM wall systems, as can be seen in Figure 1, both of the PCM walls were exposed to the same indoor air conditions as well as the same outdoor ambiance conditions. The melting temperature ranges of GR35 and GR41 were 13°C to 41°C and 13°C to 51°C, respectively. Considering the typical supply air temperature, which is typically 50°C, in HVAC applications, the GR41 was used to provide warmer supply air from the GR41 PCM wall. On the other hand, the comparison of performance of the PCM walls is beyond the scope of this paper, it is available [14,15].
The heat load of a building can be defined as the energy requirement for maintaining the indoor air at a specific comfortable temperature, which is typically 20°C. In order to determine the heat load of the test room, the test room was equipped with electrical heaters keeping the indoor air at comfortable temperature. The electrical heaters were considered a primary heating system, while the PCM walls were considered a secondary or assistant heating system for the test room.
The PCM wall system operates on the following principles. In the winter, the solar radiation transmitting through the NTG was absorbed and stored by the PCM plasterboards (Figure 2). The stored heat is then extracted and conveyed into the room via air circulation between the room and the air gap, caused by the fans (Figure 1). The fan of the GR41 PCM wall was activated by a digital controller when the surface temperature of the GR41 PCM plasterboards exceeded 45°C, which is the temperature of peak heat of fusion for GR41; the fan of the GR35 PCM wall was activated by another digital controller when the surface temperature of the GR35 PCM plasterboards exceeded 35°C, which is the temperature of peak heat of fusion for GR35. The controllers deactivated the fans when the temperature of the plasterboards decreased to 25°C.
On the other hand, in case the PCM walls did not provide enough energy to keep the indoor air at comfortable temperature, or there was no energy transfer from the PCM walls to the room, the electrical heaters were activated by a room thermostat when the indoor air temperature fell below 20°C and were deactivated when the indoor air temperature rose above 23°C. The experimental system was a self-control and fully automatic system which was never manually intervened. In the summer, the majority of the sun’s rays are reflected by the NTG to prevent overheating.
During the experimentation period, the following parameters were measured and recorded with a data acquisition system: solar radiation before and after the NTG, the inner and outer surface temperatures of the NTG, the surface temperature of the PCM plasterboards, the air temperatures at the inlet and outlet of the gap, the indoor air temperature, the outdoor air temperature, the velocity of the circulation air, and the electric consumption of the heater (Figure 1). Further information about the description of the test room and the instrumentation [14,15]. The recorded data were analyzed to determine the incident and the transmitted solar radiation, the SEG provided by the PCM walls, the heat load of the test room, and CO2 emission from the test room.
Energy calculations
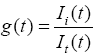
The solar transmittance (ST) of the NTG was calculated as follows:
 (1)
(1)
where  is the solar radiation (W/m2) incident on the NTG and is the solar radiation transmits through the NTG.
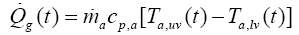
The heat rate (W) extracted from the wall and conveyed to the room was calculated as follows:
 (2)
(2)
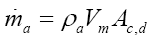
where  denotes the mass flow rate of the air circulated between the air gap and test room, cp,a is the specific heat of the circulated air, and Ta,uv(t) and Ta,lv(t) are the instantaneous air temperatures at the upper and lower vents, respectively. The mass flow rate was calculated as follows:
 (3)
(3)
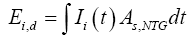
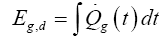
where Vm is the mean air velocity in the duct and Ac,d is the crosssectional area of the duct. The daily solar energy (J/day) incident on the NTG was calculated as follows:
 (4)
(4)
where is the instantaneous solar radiation (W/m2) incident on the TGU and As,NTG is the surface area of the NTG.
The energy extracted from the PCM wall and conveyed to the test room (J/day), which is called the solar energy gain (SEG) in this paper, was calculated on a daily basis as follows:
 (5)
(5)
The SEG (J/month) and solar energy incident on the NTG (J/ month) per month were calculated as follows:
 (6)
(6)
 (7)
(7)
where N is the number of days in each respective month. The monthly heat load of the test room was calculated as follows:
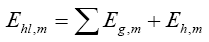 (8)
(8)
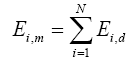
where ΣEg,m is the total SEG and Eh,m is the electric consumption of the heaters per month. The total SEG (ΣEg,m) was calculated as follows:
 (9)
(9)
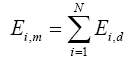
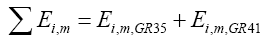
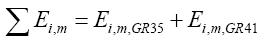
where Eg,m,GR35 and Eg,m,GR41 are the SEGs provided by GR35 PCM wall and GR41 PCM wall per month, respectively, which were calculated from Eq. 6. The total solar energy incident on NTGs was calculated as follows:
 (10)
(10)
where Ei,m,GR35 and Ei,m,GR41 are the total solar energy incident on NTGs of the PCM walls per month, respectively, which were calculated from Eq. 7.
An error analysis was completed using Kline and McClintock’s method, as described by Holman and Gajda [16]. The uncertainty in the monthly incident solar energy and the solar energy gain (SEG) were calculated to be ± 6% and ± 12%, respectively.
CO2 calculations
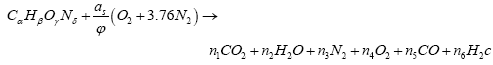
At low temperatures (T<1000 K), the overall combustion reaction for any equivalence ratio can be written [17]:
 (11)
(11)
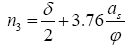
where n on the right-hand side of equation (11) denotes the mole number. This equation assumes that the combustion is complete and the disassociation of molecules is negligible at low temperatures (T<1000 K). The combustion in the boilers of district heating systems usually occurs with an equivalence ratio less than unity (φ <1) and at low temperatures (T<1000 K) because of the water-cooled combustion chamber. Therefore, it can be assumed that no CO and H2 are produced for lean combustion (φ <1) at low temperatures, i.e., n5 = n6 = 0. In this case, the atom balance equations are sufficient to determine the product composition. The mole numbers of the products for φ < 1 as follows:
 (12)
(12)
 (13)
(13)
 (14)
(14)
 (15)
(15)
where as is the stoichiometric coefficient of air and is written
 (16)
(16)
The mass of CO2 (kg) emitted from the test room is written as follows:
 (17)
(17)
where  and LHV are the density, molecular weight and lower heating value of the fuel, respectively, and ηb is the efficiency of the boiler. Ehl,m is the heat load of the test room, which was calculated from Eq. 8 and ΣE.g,m is the total solar energy gained from the PCM walls, which was calculated from Eq. 9.
Results and Discussion
Natural gas was considered as the fuel for the CO2 analysis. The chemical composition of the fuel on a volumetric basis was assumed to be 93% CH4, 3% C2H6, 1.3% C3H8, 0.6% C4H10, 1% CO2, and 1.1% N2. α ,β ,γ and δ in equation (11) and the physical properties of the fuel such as the LHV and the density were calculated by assuming the fuel was an ideal gas mixture. The chemical formula of the fuel was determined to be  . The lower heating value (LHV), the density
  and the molecular weight
  of the fuel were calculated as 34485 kJ/Nm3, 0.79 kg/Nm3 and 17,448 kg/kmol, respectively. The efficiency of the natural gas boiler was typically assumed to be 0.93.
The energy calculations were performed by using equations (1) through (10) and the main energy balance of the test room is briefly shown in Figure 3. Further information on energy analysis can be found in Kara and Kurnuç [14,15]. “Heat load of the test room” in Figure 3 is energy requirement of the test room per month to maintain a comfortable indoor air temperature, which was calculated from Eq. 8, “Total solar energy gain from PCM walls” is the total SEG provided by both of the PCM walls per month, which was calculated from Eq. 9, and “Total solar energy incident on NTGs” is the total solar energy incident on the NTGs per month, which was calculated from Eq. 10. The total SEG decreased in March and was zero in April and May because the solar transmittance (ST) decreased dramatically after March 21st (Figure 4). The ST varied between 0.45 and 0.55 from October to February; it then decreased below 0.25 after March 21st and varied over a range between 0.20 and 0.25 from April to the end of May. The NTG sufficiently fulfilled its design goal because the ST decreased by nearly 100% during the summer as compared to winter. Reducing the energy storage during the summer period was the goal during the design stage to avoid overheating, as was mentioned in Section 4.1.

Figure 3: The experimentally evaluated energy balance of the test room.

Figure 4: Daily variation of solar transmittance of novel triple glass.
The energy values given in Figure 3 were used to calculate the CO2 emissions (Figure 5). Inserting the values of the “Heat load of the test room” and the “Total solar energy gain from PCM walls” (Figure 3) into equation (17), the CO2 emission labeled “with solar energy gain” in Figure 5 was calculated. The emissions of CO2 labeled as “with incident solar energy” and “without solar energy gain” in Figure 5 were calculated by equating the ΣEg,m in equation (17) to the “Total solar energy incident on NTGs” and to zero, respectively. The CO2 bars labeled “with incident solar energy” in Figure 5 show the theoretical lower limit for the amount of CO2 emitted from the test room, which was calculated for the theoretical case in which all of the solar energy incident on the NTGs was gained. The bars labeled “without solar energy gain” in Figure 5 show the CO2 emissions for the case in which no PCM walls were used at the south façade of the test room.

Figure 5: The CO2 emissions in kilograms emitted from the test room.
The reduction in CO2 (Figure 6) was calculated by subtracting the mass of CO2 given by the “with solar energy gain” bars from the mass of CO2 given by the “without solar energy gain” bars in Figure 5. Considering the bars labeled “Based on solar energy gain” in Figure 6, the PCM wall reduced the CO2 emission by approximately 70% in October 2013, 41% in November 2013, 14% in December 2013, 9% in January 2014, 11% in February 2014, and 4% in March 2014. There was no reduction in April 2014 and May 2014 because there was no solar energy gain in those months, as shown in Figure 3. The reduction of CO2 on an annual basis was calculated as 14%.

Figure 6: The reduction in the CO2 emitted from the test room.
The bars labeled “Theoretical potential” in Figure 6 show the CO2 reduction for the theoretical case in which the total amount of solar energy incident on the NTGs was converted to solar energy gain. Because the overall conversion efficiency cannot be 100%, the bars labeled “Theoretical potential” only demonstrate the theoretical limit for CO2 reduction. There would have been no CO2 emissions in the months of October and November 2013 and April and May 2014 if the overall efficiency of the PCM wall had been 100%; the CO2 reduction would have been over 40% for the remaining months.
Conclusion
A test room with PCM walls was built to determine the energy gain and the environmental impact of the PCM walls. The PCM walls are made of brick walls, plasterboards containing PCMs and novel triple glass. The thermal energy balance of the test room was determined to calculate the reduction in CO2 emission due to the PCM walls.
Solar energy gains and CO2 calculations based on the experimental data collected during the period from October 2013 to October 2014 indicated that the PCM walls reduced the CO2 emission from the test room by 70% in October 2013, 41% in November 2013, 14% in December 2013, 9% in January 2014, 11% in February 2014, and 4% in March 2014. The average reduction in CO2 was 14% on an annual basis.
References
- Kuznik F, Virgone J,Johannes K (2011) In-situ study of thermal comfort enhancement in a renovated building equipped with phase change material wallboard.Renew Energy 36: 1458-1462.
- Cerón I, Neila J, Khayet M (2011) Experimental tile with phase change materials (PCM) for building use. Energy and Build 43: 1869-1874.
- Liu H, Awbi HB (2009) Performance of phase change material boards under natural convection. Build and Environment 44: 1788-1793.
- Castellón C, Medrano M, Roca J, Cabeza LF, Navarro ME, et al. (2010) Effect of microencapsulated phase change material in sandwich panels. Renew Energy 35: 2370-2374.
- Cabeza LF, Castellon C, Nogues M, Medrano M, Leppers R, et al. (2007) Use of microencapsulated PCM in concrete walls for energy savings. Energy and Build 39: 113-119.
- Castell A, Martorell I, Medrano M, Pérez G, Cabeza LF (2010) Experimental study of using PCM in brick constructive solutions for passive cooling. Energy and Build 42: 534-540.
- Zhang YP, Lin KP, Yang R, Di HF, Jiang Y (2006) Preparation, thermal performance and application of shape-stabilized PCM in energy efficient buildings. Energy and Build 38: 1262-1269.
- Lin K, Zhang Y, Xu X, Di H, Yang R, et al. (2005) Experimental study of under-floor electric heating system with shape-stabilized PCM plates. Energy and Build 37: 215-220.
- Lin K, Zhang Y, Xu X, Di H, Yang R, et al. (2004) Modeling and simulation of under-floor electric heating system with shape-stabilized PCM plates. Building Environ 39: 1427-1434.
- Zhou G, Zhang Y, Lin K, Xiao W (2008) Thermal analysis of a direct-gain room with shape-stabilized PCM plates. Renew Energy 33: 1228-1236.
- Zhou G, Zhang Y, Zhang Q, Lin K, Di H (2007) Performance of a hybrid heating system with thermal storage using shape-stabilized phase-change material plates. Appl Energy 84: 1068-1077.
- Kara YA, Kurnuç A (2012) Performance of coupled novel triple glass and PCM wall in the heating season: an experimental study. Solar Energy 86: 2432-2442.
- Kara YA, Kurnuç A (2012) Performance of Coupled Novel Triple Glazing Unit and PCM Wall.ApplThermEngg35:243-246.
- Holman JP, Gajda WJ (1994) Experimental methods for engineers. McGraw-Hill, NY, USA.
- Ferguson CR, Kirkpatrick AT (2001)Internal combustion engines (2ndedn). John Wiley &Sons.
Citation: Subbiah M (2017) Analysis of Solar Heat Gains and Environmental Impact of the Phase Change Material (PCM) Wall. Innov Ener Res 6: 151. DOI: 10.4172/2576-1463.1000151
Copyright: © 2017 Subbiah M. This is an open-access article distributed under the terms of the Creative Commons Attribution License, which permits unrestricted use, distribution, and reproduction in any medium, provided the original author and source are credited.
Select your language of interest to view the total content in your interested language
Share This Article
Recommended Journals
Open Access Journals
Article Tools
Article Usage
- Total views: 6685
- [From(publication date): 0-2017 - Jul 03, 2025]
- Breakdown by view type
- HTML page views: 5749
- PDF downloads: 936