Research Article Open Access
Analysis of Pressure Transient Tests in Naturally Fractured Reservoirs
Gamal Rezk M*
Gaza University, Cairo, Egypt
- *Corresponding Author:
- Gamal Rezk M
Assitant Professor, Gaza University
Cairo, Egypt
Tel.: +201002058903, +20227039306
E-mail: mohamedgamalrezk@gmail.com
Received Date: October 15, 2016; Accepted Date: October 19, 2016; Published Date: October 25, 2016
Citation: Gamal Rezk M (2016) Analysis of Pressure Transient Tests in Naturally Fractured Reservoirs. Oil Gas Res 2: 121. doi: 10.4172/2472-0518.1000121
Copyright: © 2016 Gamal Rezk M. This is an open-access article distributed under the terms of the Creative Commons Attribution License, which permits unrestricted use, distribution, and reproduction in any medium, provided the original author and source are credited.
Visit for more related articles at Oil & Gas Research
Abstract
Pressure transient tests in naturally fractured reservoirs often exhibit non-uniform responses. Different techniques can be used to analyze the pressure behavior in dual porosity reservoirs in an attempt to correctly characterize reservoir properties. In this paper, the pressure transient tests in naturally fractured reservoirs were analyzed using conventional semi-log analysis, type curve matching (using commercial software) and Tiab’s direct synthesis (TDS) technique. In addition, the TDS method was applied in case of a naturally fractured formation with a vertical hydraulic fracture. These techniques were applied to a single layer naturally fractured reservoir under pseudosteady state matrix flow. By studying the unique characteristics of the different flow regimes appear on the pressure and pressure derivative curves, various reservoir characteristics can be obtained such as permeability, skin factor, and fracture properties. For naturally fractured reservoirs, a comparison between the results semi-log analysis, software matching, and TDS method is presented. In case of wellbore storage, early time flow regime can be obscured that lead to incomplete semi-log analysis. Furthermore, the type curve matching usually gives a non-uniqueness solution as it needs all the flow regimes to be observed. However, the direct synthesis method used analytical equation to calculate reservoir and well parameters without type curve matching. For naturally fractured reservoirs with a vertical fracture, the pressure behavior of wells crossed by a uniform flux and infinite conductivity fracture is analyzed using TDS technique. The different flow regimes on the pressure derivative curve were used to calculate the fracture half-length in addition to other reservoir properties. The results of different cases showed that TDS technique offers several advantages compared to semi-log analysis and type curve matching. It can be used even if some flow regimes are not observed. Direct synthesis results are accurate compared to the available core data and the software matching results.
Keywords
Naturally Fractured Reservoirs; Pressure Transient Analysis; Vertical Fracture; Uniform Flux Fracture; Infinite Conductivity Fracture
Nomenclature
B: Formation volume factor, res bbl/stb
Ct: Total compressibility, psi-1
C: Wellbore storage coefficient, bbl/psi
CA: Shape factor
Cdw: Dimensionless wellbore storage
h: Total formation thickness, ft
Kf: Bulk fracture permeability, md
p: Pressure, psi
PD: Dimensionless pressure
PwD: Dimensionless bottom-hole pressure
Pint: Initial pressure, psi
Pwf: Bottom-hole pressure, psi
P?D: Dimensionless pressure derivative
P?wD: Dimensionless bottom-hole pressure derivative
ΔP: Pressure difference, psi
qt: Flow rate, stbd
re: Reservoir outer radius, ft
rw: Wellbore radius, ft
S: Skin factor
t: Test time, hr
tD: Dimensionless time
Xe: Half side of rectangle in x-axis, ft
Xf: Fracture half length, ft
ye: Half side of rectangle in y-axis, ft
Greek Symbols
λ: Interporosity flow parameter
ω: Dimensionless storage coefficient
μ: Viscosity, cp
φ: Porosity
Subscripts
b1: Beginning of first radial flow line
b2: Beginning of second radial flow line
BR: Bi-radial
D: Dimensionless
e: Outer boundary
e1: End of first radial flow line
f: Fracture
m: Matrix
L: Linear
o: Oil
PSS: Pseudosteady state
R: Radial
t: Total
Introduction
The analysis of pressure data received during a well test in dual porosity formation has been widely used for reservoir characterization. Conventional semi-log analysis and log-log type curve methods are the early techniques used to analyze pressure transient data. However, both methods need certain criteria to give accurate results, such as; all flow regimes must be identified in the pressure and pressure derivative plot. In case some flow regimes are not identified, type curve matching will give a non-uniqueness solution and is essential trial and error, and semi-log analysis cannot be completed. Tiab [1] used a new method to analyze pressure transient tests, called “Direct Synthesis Technique”. This method can calculate different reservoir paramters without type curve matching by using pressure and pressure derivative loglog plots. In 1994, Tiab [2] extended the work to vertically fractured wells in closed system. Engler and Tiab [3] developed direct synthesis method to analyze pressure transient tests in dual porosity formation without using type curve matching. They used analytical and empirical correlations to calculate the naturally fractured reservoir parameters. Jalal [4] discussed the analytical solutions of wells in dual porosity reservoirs with a vertical fracture. The direct synthesis method offers manys advatages in analyzing pressure transient tests.
The objective of this paper is to analyze pressure transient in naturally fractured reservoirs using: conventional semi-log analysis, type curve matching (using commercial software), and Tiab’s direct synthesis method to correctly characterize the reservoir properties. These techniques were applied to naturally fractured reservoirs, with and without hydraulic (vertical) fracture.
Properties of Dual Porosity Formation
The Dual porosity reservoir consists of primary and secondary porosity which are the matrix and fractures. Warren and Root [5] defined the fractured reservoirs by two key parameters, ω and λ. These dimensionless paramters are defined as follows:
The relative storativity,

The interporosity flow parameter,

Where the shape factor α, ft-2, depends on the matrix block geometry (horizontal slab or spherical matrix block). By assuming that the reservoir is infinite acting and producing a single phase, slightly compressible fluid with pseudosteady state matrix flow, the pressure solution is given by [6]:

Conventional semi-log analysis
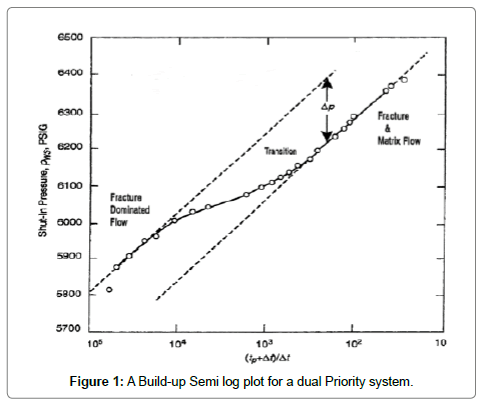
Naturally fractured reservoirs give two parallel semi-log straight lines in plot of drawdown and build-up tests as shown in Figure 1.
Permeability thickness product: The permeability thickness product of the total system (actually of the fractures as the matrix permeability can be neglected) can be calculated from the slope of the initial or final straight line, m.

1. The relative storativity ω can be calculated from the pressure difference, ΔP, between the initial and final straight lines when both of them can be identified.

2. By drawing a horizontal line through the middle of transition period to intersect with both semi-log straight lines, the times of intersection with the first and the second semi-log straight lines are donated by t1 and t2, respectively. The storativity ratio also can be determined as follows [7]:

3. The interporosity flow coefficient, λ, can be calculated by [8]:
For drawdown tests:

or

For build-up tests

or

Direct synthesis technique
Direct synthesis method uses a log-log plot of pressure and pressure derivative data versus time to calculate various reservoirs and well parameters. It uses the pressure derivative technique to identify reservoir heterogeneities. In this method, the values of the slopes, intersection points, and beginning and ending times of various straight lines from the log-log plot can be used in exact analytical equations to calculate different parameters as it is shown in the following procedures [6]: Infinite Acting Reservoir without Wellbore Storage
1. Fracture permeability: The fracture permeability, Kf, can be determined using early or late time infinite acting radial flow lines (only one of the two derivative segments needs to be observed)

2. Relative storativity: The ratio between minimum and radial pressure derivative values can be used in equation to calculate ω

The relative storativity can also be calculated by using the characteristic times as in the following equations:


Where te1 is the end time of the early infinite acting radial flow line, tb2 is the beginning time of the late infinite acting radial flow line and tmin is the minimum time.
3. The interporosity flow parameter: The interporosity flow parameter can be also obtained from the characteristic times as following:


Where ST is the product of the average bulk porosity (from cores or logs) and the average compressibility. λ can be also calculated from the minimum coordinates:

In case ω less than 0.05, late transition period unit slope straight line is well observed. The interporosity flow parameter can be calculated from:

Where tus,i the intersection of the transition period unit slope line with the infinite acting radial flow line.
4 Skin factor: The skin factor can be calculated from the early or late time radial flow pressure and pressure derivative data by using the following equations:


Where r1 is any point on the early horizontal radial flow line and r2 is any point on the late horizontal radial flow line.
Infinite Acting Reservoir with Wellbore Storage
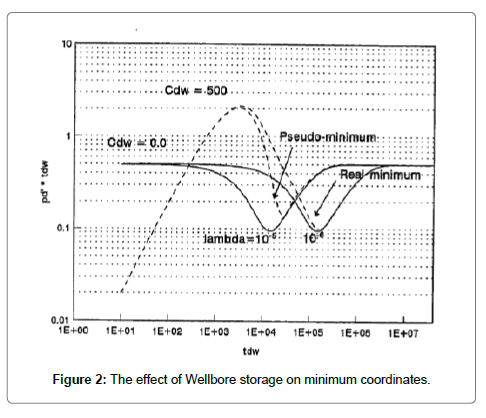
Wellbore storage effects can obscure early flow regimes on log-log plot of pressure and pressure derivative versus time. It is represented by early time unit slope straight line on the log-log plot. This unit slope period is followed by a peak on the pressure derivative curve as shown in Figure 2. The effect of wellbore storage can affect the minimum coordinates of the pressure derivative curve and cause the appearance of “pseudo-minimum” coordinates. Therefore, the effect of wellbore storage should be investigated prior to the analysis to know whether the observed minimum is the real minimum or the pseudo-minimum. For (tdw)min/(tdw)x ≥ 10, the wellbore storage doesn’t affect the minimum coordinates. [(tdw)x is the dimensionless time of the peak point, [6].
In case the minimum coordinates are not affected by wellbore storage, calculate the reservoir parameters using the following procedure [6]:
1-Determine the fracture permeability using the late time radial flow line.
2-Calculate the wellbore storage coefficient from the early time unit slope using the following equations:

Where t, Δp are any point on the unit slope line. (Δp=pi-pwf for drawdown and Δp=pws-pwf (Δt=0) for buildup tests)

The wellbore storage coefficient can also be calculated from the intersection time of the early time unit slope with the infinite acting radial flow line (ti).

3-Determine the ω and λ as outlined before.
4-Determine skin factor from the late time radial flow pressure and pressure derivative ratio.
If the minimum coordinates are influenced by wellbore storage, the interporosity flow parameter and the relative storativity can be calculated using the following equations:
Determine λ from the peak to minimum time ratio or from the peak to radial pressure derivative ratio:


(C: bbl/psi)


Calcualte ω from the peak to beginning of second radial flow line time ratio:

Case 1
This case presents an oil field in Iran. A build-up test is conducted on a well from naturally fractured reservoir. The average core permeability received from the Iranian oil company ranges from 4 to 6 md. The well was flowing for 72 hours with q=2300 STB/day before shut-in for a build-up test. The build-up data are given in Table 1. The following reservoir and well data are also known:
h=280 ft tP=72 hrs
rw=0.281 ft Bo=1.35 bbl/STB
q=2300 STB/day μ=0.68 cp
Pwf (Δt=0)=2881 psia φ=0.15
Ct=1.5*10-5 psi-1
| Δt, hr | Pws, psia | Δt, hr | Pws, psia | Δt, hr | Pws, psia | Δt, hr | Pws, psia | Δt, hr | Pws, psia | Δt, hr | Pws, psia |
|---|---|---|---|---|---|---|---|---|---|---|---|
| 0.0083 | 2881.36 | 0.6958 | 3232.181 | 3.5083 | 3393.13 | 49.6083 | 3489.319 | 53.7333 | 3493.64 | 57.85831 | 3497.62 |
| 0.0236 | 2901.811 | 0.7111 | 3235.39 | 3.6917 | 3395.58 | 49.7 | 3489.42 | 53.825 | 3493.73 | 58.0417 | 3497.82 |
| 0.0389 | 2916.59 | 0.7264 | 3238.541 | 3.875 | 3397.719 | 49.7917 | 3489.53 | 53.9167 | 3493.82 | 58.1333 | 3497.92 |
| 0.0542 | 2930.591 | 0.7417 | 3241.54 | 4.0583 | 3399.63 | 49.8833 | 3489.64 | 54.0083 | 3493.9 | 58.22501 | 3498.01 |
| 0.0694 | 2943.96 | 0.7569 | 3244.51 | 4.2417 | 3401.311 | 49.975 | 3489.73 | 54.1 | 3494 | 58.3167 | 3498.09 |
| 0.0847 | 2957.04 | 0.7722 | 3247.36 | 4.425 | 3402.97 | 50.0667 | 3489.83 | 54.1917 | 3494.09 | 58.40829 | 3498.18 |
| 0.1 | 2969.7 | 0.7875 | 3250.16 | 4.6083 | 3404.551 | 50.15829 | 3489.92 | 54.28329 | 3494.18 | 58.5 | 3498.26 |
| 0.1153 | 2981.93 | 0.8028 | 3252.86 | 4.7917 | 3406.05 | 50.25 | 3490.02 | 54.375 | 3494.28 | 58.59171 | 3498.35 |
| 0.1306 | 2993.64 | 0.8181 | 3255.5 | 4.975 | 3407.46 | 50.34171 | 3490.1 | 54.46671 | 3494.38 | 58.6833 | 3498.46 |
| 0.1458 | 3004.94 | 0.8333 | 3258.031 | 5.1583 | 3408.77 | 50.4333 | 3490.2 | 54.5583 | 3494.48 | 58.77499 | 3498.55 |
| 0.1611 | 3015.88 | 0.8486 | 3260.509 | 5.3417 | 3410.051 | 50.525 | 3490.3 | 54.65 | 3494.55 | 58.8667 | 3498.611 |
| 0.1764 | 3026.45 | 0.8639 | 3262.871 | 5.525 | 3411.27 | 50.6167 | 3490.39 | 54.7417 | 3494.66 | 58.9583 | 3498.68 |
| 0.1917 | 3036.69 | 0.8792 | 3265.21 | 5.7083 | 3412.42 | 50.7083 | 3490.5 | 54.8333 | 3494.729 | 59.05 | 3498.74 |
| 0.2069 | 3046.611 | 0.8944 | 3267.4 | 5.8917 | 3413.56 | 50.8 | 3490.61 | 54.925 | 3494.829 | 59.14169 | 3498.83 |
| 0.2222 | 3056.219 | 0.9097 | 3269.49 | 6.3417 | 3415.769 | 50.8917 | 3490.7 | 55.0167 | 3494.909 | 59.23331 | 3498.93 |
| 0.2375 | 3065.5 | 0.925 | 3271.529 | 7.2583 | 3420.139 | 50.9833 | 3490.8 | 55.1083 | 3494.99 | 59.325 | 3499.03 |
| 0.2528 | 3074.41 | 0.9403 | 3273.47 | 8.175 | 3423.5 | 51.075 | 3490.9 | 55.2 | 3495.06 | 59.4167 | 3499.13 |
| 0.2681 | 3083.03 | 0.9556 | 3275.35 | 9.0917 | 3426.319 | 51.1667 | 3490.99 | 55.2917 | 3495.13 | 59.5083 | 3499.22 |
| 0.2833 | 3091.33 | 0.9708 | 3277.17 | 10.0083 | 3428.771 | 51.2583 | 3491.07 | 55.3833 | 3495.24 | 59.60001 | 3499.32 |
| 0.2986 | 3099.31 | 0.9861 | 3278.931 | 11.8417 | 3432.46 | 51.35 | 3491.18 | 55.475 | 3495.35 | 59.6917 | 3499.4 |
| 0.3139 | 3106.99 | 1.0014 | 3280.63 | 13.675 | 3436.14 | 51.4417 | 3491.27 | 55.5667 | 3495.46 | 59.78329 | 3499.471 |
| 0.3292 | 3114.41 | 1.0583 | 3285.92 | 16.0083 | 3439.83 | 51.53329 | 3491.35 | 55.65829 | 3495.55 | 59.875 | 3499.579 |
| 0.3444 | 3121.581 | 1.15 | 3294.58 | 19.675 | 3446.42 | 51.625 | 3491.44 | 55.75 | 3495.65 | 59.96671 | 3499.669 |
| 0.3597 | 3128.46 | 1.2417 | 3302.33 | 23.3417 | 3453.72 | 51.71671 | 3491.53 | 55.84171 | 3495.74 | 60.14999 | 3499.859 |
| 0.375 | 3135.1 | 1.3333 | 3309.449 | 28.5083 | 3462.21 | 51.8083 | 3491.64 | 55.9333 | 3495.82 | 60.2417 | 3499.92 |
| 0.3903 | 3141.47 | 1.425 | 3316.091 | 34.0083 | 3470.219 | 51.9 | 3491.72 | 56.02499 | 3495.92 | 60.3333 | 3499.98 |
| 0.4056 | 3147.66 | 1.5167 | 3322.179 | 39.5083 | 3477.331 | 51.9917 | 3491.81 | 56.1167 | 3496.01 | 60.425 | 3500.049 |
| 0.4208 | 3153.619 | 1.6083 | 3327.91 | 45.0083 | 3483.611 | 52.0833 | 3491.93 | 56.2083 | 3496.09 | 60.51669 | 3500.149 |
| 0.4361 | 3159.34 | 1.7 | 3333.5 | 48.05 | 3487.63 | 52.175 | 3492.04 | 56.3 | 3496.18 | 60.60831 | 3500.25 |
| 0.4514 | 3164.89 | 1.7917 | 3338.809 | 48.1417 | 3487.72 | 52.2667 | 3492.12 | 56.39169 | 3496.241 | 60.7 | 3500.339 |
| 0.4667 | 3170.231 | 1.8833 | 3343.921 | 48.2333 | 3487.81 | 52.3583 | 3492.22 | 56.48331 | 3496.32 | 60.7917 | 3500.44 |
| 0.4819 | 3175.35 | 1.975 | 3349.42 | 48.325 | 3487.91 | 52.45 | 3492.32 | 56.575 | 3496.39 | 60.8833 | 3500.519 |
| 0.4972 | 3180.36 | 2.0667 | 3354.88 | 48.4167 | 3488.02 | 52.5417 | 3492.42 | 56.6667 | 3496.49 | 60.97501 | 3500.611 |
| 0.5125 | 3185.159 | 2.1583 | 3359.47 | 48.5083 | 3488.14 | 52.6333 | 3492.52 | 56.7583 | 3496.6 | 61.0667 | 3500.701 |
| 0.5278 | 3189.819 | 2.25 | 3363.501 | 48.6 | 3488.251 | 52.725 | 3492.59 | 56.85001 | 3496.69 | 61.15829 | 3500.77 |
| 0.5431 | 3194.3 | 2.3417 | 3367.15 | 48.6917 | 3488.34 | 52.8167 | 3492.66 | 56.9417 | 3496.78 | 61.25 | 3500.87 |
| 0.5583 | 3198.67 | 2.4333 | 3370.341 | 48.78329 | 3488.43 | 52.90829 | 3492.75 | 57.03329 | 3496.87 | 61.34171 | 3500.96 |
| 0.5736 | 3202.86 | 2.525 | 3373.25 | 48.875 | 3488.52 | 53 | 3492.85 | 57.125 | 3496.96 | 61.4333 | 3501.04 |
| 0.5889 | 3206.909 | 2.6167 | 3375.851 | 48.96671 | 3488.61 | 53.09171 | 3492.96 | 57.21671 | 3497.04 | 61.52499 | 3501.12 |
| 0.6042 | 3210.85 | 2.7083 | 3378.29 | 49.0583 | 3488.731 | 53.1833 | 3493.08 | 57.3083 | 3497.13 | 61.6167 | 3501.179 |
| 0.6194 | 3214.66 | 2.8 | 3380.48 | 49.15 | 3488.839 | 53.275 | 3493.18 | 57.39999 | 3497.22 | 61.7083 | 3501.24 |
| 0.6347 | 3218.36 | 2.8917 | 3382.509 | 49.2417 | 3488.929 | 53.3667 | 3493.26 | 57.4917 | 3497.32 | 61.8 | 3501.31 |
| 0.65 | 3221.94 | 2.9833 | 3384.409 | 49.3333 | 3489.029 | 53.4583 | 3493.36 | 57.5833 | 3497.4 | 61.89169 | 3501.39 |
| 0.6653 | 3225.449 | 3.1417 | 3387.269 | 49.425 | 3489.121 | 53.55 | 3493.45 | 57.675 | 3497.471 | 61.98331 | 3501.479 |
| 0.6806 | 3228.84 | 3.325 | 3390.44 | 49.5167 | 3489.219 | 53.6417 | 3493.56 | 57.76669 | 3497.55 | 62.1667 | 3501.659 |
Table 1: Pressure build up test Data for Case 1.
Semi-log analysis
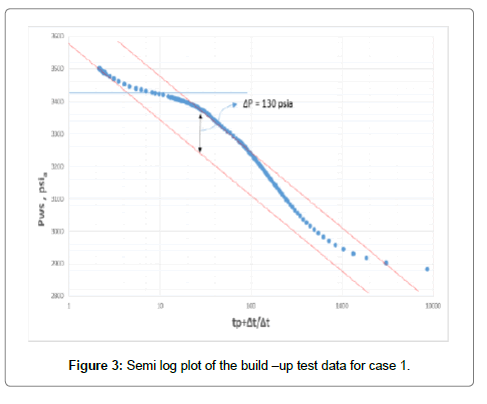
Horner plot is shown in Figure 3. This figure depicts the early points that are affected by wellbore storage, however, the first straight line can be observed clearly. The figure shows two parallel straight lines that proves the dual porosity behavior. Therefore, the conventional semi-log analysis can be used to estimate reservoir parameters.
The fracture permeability can be calculated from the slope of the second straight line (m) to give:

=1526.23 md.ft

The storativity ratio (ω) can be calculated from the vertical distance between the two straight lines (Δp) and the slope (m):

A horizontal straight line through the middle of the transition region is drawn to intersect with the two semi-log straight lines. Read the corresponding times and calculate the interporosity flow coefficient (λ):


Direct Synthesis Technique
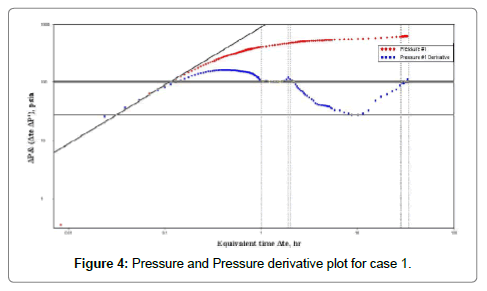
The log-log plot of pressure and pressure derivative shown in Figure 4. It is clear that there is a wellbore storage with an early time unit slope and the early radial flow period is well defined. However, the late radial flow period not last for long time. The data exhibit a unique behavior which is indicative of a naturally fractured reservoir.
From Figure 4:
(t*ΔP?w)r2=99.7 psia tr2=32 hr,
ΔPr2=614 psia (t*ΔP?w)min=27.56 psia,
tmin=8.8 hr tus=0.054 hr,
ΔPus=49.6 psia tx=0.42 hr,
tb2=28 hr (t*ΔP?w)US=49.6 psia,
The effect of the WBS on the minimum derivative coordinates can be defined by calculating the ratio (tdw)min/(tdw)x tmin/tx=8.8/0.42=20.95 (>10).
Therefore the minimum derivative coordinates are the real minimum and not affected by wellbore storage.
The fracture permeability can be calculated from the late time infinite acting radial flow line:

Wellbore storage coefficient is calculated by:

Skin factor from the late time pressure and pressure derivative data:


The dimensionless storage coefficient (ω):


The interporosity flow parameter (λ):


=2.051 * 10-6
For verification


=2.132 * 10-6
Comparison of the results of conventional semi-log analysis, direct synthesis technique, and type curve matching is shown in Table 2. The results of the semi-log analysis are only matching with the direct synthesis and software results in permeability. However, the storage coefficient and the interporosity flow parameter are inaccurate. On the other side, the direct synthesis technique and the software results show an excellent match in all reservoir parameters.
| Parameter | Conventional semi-log | Direct synthesis | Software matching |
|---|---|---|---|
| Kf (md) | 5.45 | 5.339 | 5.375 |
| ω | 0.264 | 0.0856 | 0.0865 |
| λ | 2.955*10-7 -2.828*10-7 | 2.051*10-6 - 2.132*10-6 | 2.012*10-6 |
| S | - 3.74 | -3.71 | |
| C (bbl/psi) | 0.14085 | 0.1453 |
Table 2: Comparison of the Results of the Case 1.
Naturally fractured reservoirs with a vertical fracture
The pressure behavior of a dual porosity formation intersected by uniform flux and infinite conductivity fracture can be investigated using log–log plots of pressure and pressure derivative functions. The direct synthesis technique can be used to calculate reservoir parameters such as skin, wellbore storage, permeability, interporosity flow parameter, relative storativity and half-fracture length without type curve matching. The applied assumptions are: the reservoir is isotropic, horizontal, and has constant thickness and fracture permeability. The fractured well is producing at constant rate with constant viscosity, slightly compressible fluid. In addition, the fracture fully penetrates the vertical extent of the formation and has the same length in both sides of the well. A pseudosteady state interporosity flow between the matrix and the fracture system is also assumed.
Uniform Flux Fracture
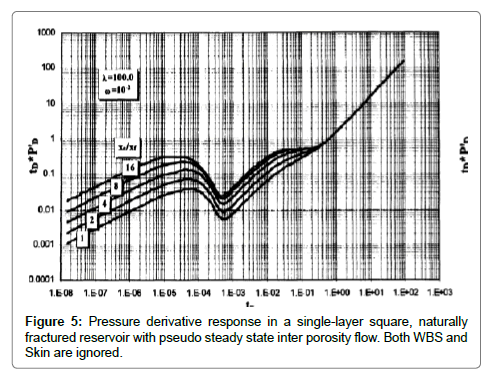
Figure 5 shows the pressure derivative plots for various values of Xe/ Xf ratios, in a single layer square, dual porosity reservoir with pseudosteady state interporosity flow. Three flow regimes are shown in these figures: the linear flow regime, infinite acting radial flow regime, and pseudosteady steady state flow regime [9].
1) Linear flow period: The linear flow period occurs at early time. During this period, the flow resulted from the expansion of the fluid within the fracture network as the matrix effect is negligible. The linear flow period can be identified by a straight line of slope 0.5. This straight line is used to calculate the fracture half length.
The equation of pressure derivative during this flow regime is:

By taking logarithm of both sides of the equation gives:


Based on Eq. (34) the log-log plot of pressure derivative versus time gives half slope straight line during the linear flow period. The fracture half-length can be calculated by:

where  is the value of pressure derivative at t=1hr on the linear flow line.
2) Pseudoradial flow period: The infinite acting radial flow period is dominated only for (Xe/Xf) > 8, as shown in Figure 5. This flow regime is identified by a horizontal straight line on the pressure derivative plot and can be used to calculate permeability and skin [4].
The pressure derivative equation during this flow regime is:

The above equation in dimensional from yields:

R stands for radial flow. Solving the above equation for permeability gives:

The skin can be determined by:

3) Pseudosteady state flow period: In case of a vertically fractured well inside a closed system, a third straight line of unit slope appears. This line corresponds to the pseudosteady state flow regime is used to calculate the drainage area and shape factor.
The pressure derivative equation describing this flow period is:

By taking logarithm of both sides of the above equation, the dimensional form is:

By substituting t=1hr, the drainage area can be calculated using the following equation:

Where  stands for pseudosteady state flow period at time equal 1 hr.
The shape factor, CA, can be calculated by the following equation:

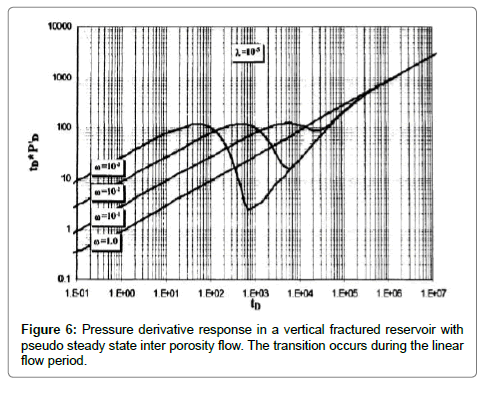
4) Transition period: The transition can occur during the infinite acting radial flow as shown in Figure 5. In this case, the relative storativity, ω, and the interporosity flow parameter, λ, can be estimated by several methods as previously described in the previous section. If the transition takes place during the linear flow period as shown in Figure 6, two parallel straight lines of slope equal 0.5 can be observed. The first line represents the expansion of the fracture network, this flow period is called “fracture storage dominated flow period”. While the second line appears during the total system dominated flow period (for this period ω=1). Also, a straight line of unit slope is observed during late transition period. The intersection time of the straight lines of different flow regimes have been used in several equations to calculate reservoir parameters in case one of the flow regimes is missing or for verification purposes. These equations are presented in the following procedure:
Step 1 - Plot the pressure difference ΔP and the pressure derivative (t*ΔP?w) versus time on log-log plot and identify different flow regimes.
Step 2 - Calculate the fracture permeability from Eq. (38).
Step 3 - Calculate ω and λ as outlined before.
Step 4 - If the transition occur during linear flow regime and the two parallel straight lines of slope 0.5 observed, verify ω using the following two equations:

where 2L1 stands for the linear flow at the total system dominated regime, and L1 stands for fracture storage dominated flow regime.

where t2LUSi stands for the intersection point between the late transition period unit slope line and total system dominated flow line, and tLUSi stands for the intersection point between the late transition period unit slope line and the fracture storage dominated flow period.
Step 5 - Read the value of (t*Δp?w) at time 1 hr from the linear flow line (extrapolated if necessary), (t*Δp?w)L1.
Step 6 - Calculate the fracture half-length, Xf, from the linear flow straight line (Eq. 35).
If the linear flow not observed (due to wellbore storage or noise), then fracture half-length can be calculated from the half slope pressure Δpw instead of pressure derivative as


then draw a straight line of slope 0.5 parallel to the pressure straight line to cross the (t*Δp?w)L1.
Step 7 - Determine the intersection between the linear and radial flow line tLRi from the log- log plot of the derivative (t*Δp?w) curve.
Step 8 - Calculate the ratio  from equation: (for square geometry A=xe2)

Compare this ratio with the previously calculated values of Xf and Kf. If the two ratios are nearly equal, then the values are correct. If they are different, shift one or both straight lines then repeat the previous steps until their values approach.
Step 9 - Determine the value of (t*Δp?w)PSS1 from the pseudosteady state line and find the drainage area A from:

Step 10 - Read the intersection time of the infinite acting line and the pseudosteady state line (tRPSSi) from the plot and calculate the drainage area A:

Areas from steps 10 and 11 should be equal. If they are not equal, shift the lines left or right and repeat the calculations.
Step 11 - Determine the interporosity flow parameter after stimulation (λf) from:

Step 12 - Verify (λf) using the late transition period unit slope line by the following equations:

where tRUSi stands for the intersection time between the late transition period unit slope line and the infinite acting line.

where tLUSi stands for the intersection time between the late transition period unit slope line and the fracture storage dominated linear flow period.

where 2LUSi stands for the intersection point between the late transition period unit slope line with the total system dominated linear flow period.
Step 13 - Calculate skin using Eq. (39).
Step 14 - Calculate the shape factor from the value of Δpw and (t*Δp?w) corresponding to any convenient time during the pseudosteady state flow regime using Eq. (43).
Infinite Conductivity Fracture
The pressure and pressure derivative obtained for infinite conductivity fracture are the same as the uniform flux fracture except for a fourth dominated flow regime called bi-radial flow. This flow regime can be identified by a straight line of slope 0.36. It corresponds to the transition period between the early time linear flow regime and the infinite acting radial flow regime4. The characteristics of the linear, radial, and pseudosteady state flow periods are the same as illustrated earlier in the case of uniform flux fracture. The characteristics of the bi-radial flow regime are as following:
Bi-radial Flow Period:
The bi-radial flow regime can be identified from the pressure derivative function by a straight line of slope 0.36. However, it cannot be identified from the pressure function. In case the linear flow line is not observed, the bi-radial flow line is used to determine the fracture half length. The pressure derivative equation describing the bi-radial flow period is [10]:

By taking logarithm of both sides of the above equation, the dimensional form is:

where

Solving for the fracture half-length, Xf

If all the flow regimes that were found in the case of uniform flux fracture are available, use the previous procedure of the uniform flux fracture to analyze the pressure test for infinite conductivity fracture.
However, in case the linear flow line is either too short or not observed, the following procedure4 can be used:
Step 1 - Plot the pressure difference ΔP and the pressure derivative (t*ΔP?w) versus time on log-log plot and identify different flow regimes.
Step 2 - Determine the value of (t*ΔP?w)R from the infinite-acting radial flow line.
Step 3 - Determine the fracture permeability as discussed before in uniform flux fracture.
Step 4 - Calculate ω and λ as outlined before.
Step 5 - Verify ω as discussed before in the case of the uniform flux fracture.
Step 6 - Read the value of (t*Δp?w)PSS1 corresponding to the pseudosteady state line and determine the drainage area (A).
Step 7 - Read the intersection time of the infinite acting line and the pseudosteady state line (tRPSSi) from the plot to determine A (Eq. 49).
Areas from step 6 and 7 should be equal, if not shift left or right and repeat the steps.
Step 8 - Read the value of (t*Δp?w) at time t=1hr from the bi-radial flow line, (t*Δp?w)BR1. The bi-radial flow line can be extrapolated if necessary.
Step 9 - Determine the fracture half length, Xf, from Eq. (57)
Step 10 - Calculate the ratio  using the values of step 3 and 9.
Step 11 - From the plot, read the time of intersection of the radial flow and the bi-radial flow line, tRBRi, then determine the ratio  from4: (for square geometry Xe=Ye)

If Step 10 and 11 are the same, then Xf and Kf are correct and if they not the same, shift one or both lines (bi-radial and infinite acting) and repeat all the procedure.
Step 12 - Determine the interporosity flow coefficient after stimulation (λf) by Eq. (50).
Step 13 - Verify (λf) as previously outlines.
Step 14 - Calculate the skin factor by Eq. (39).
Step 15 - Calculate the shape factor from the value of Δpw and (t*Δp?w) corresponding to any convenient time during the pseudosteady state flow period by Eq. (43).
Case 2
Britt et al. [11] interpreted the pressure fall off test performed on a well. The well has been acidized several times before fracture stimulating in November 1982. The test was performed using down hole shut-in device and pressure gauges. The pressure fall off test data are shown in Table 3 and the following reservoir and fluid data are known:
| Δt, hr | Pws, psia | Δt, hr | Pws, psia |
|---|---|---|---|
| 0 | 1183 | 0.066358 | 1127.6 |
| 0.000556 | 1171.7 | 0.083285 | 1121.6 |
| 0.00111 | 1170.4 | 0.38287 | 1073 |
| 0.001667 | 1169.4 | 0.71312 | 1060 |
| 0.002222 | 1168.6 | 0.87794 | 1049.9 |
| 0.0025 | 1168.3 | 1.0424 | 1041.7 |
| 0.003055 | 1167.4 | 1.3701 | 1034.7 |
| 0.003611 | 1166.6 | 1.859 | 1023.4 |
| 0.004167 | 1166 | 2.3445 | 1010.3 |
| 0.004722 | 1165.2 | 2.8267 | 1000 |
| 0.005278 | 1164.6 | 3.3056 | 991.6 |
| 0.005555 | 1164.2 | 3.7813 | 984.4 |
| 0.006111 | 1163.7 | 4.2538 | 978.4 |
| 0.006667 | 1163 | 5.1893 | 972.7 |
| 0.0075 | 1162 | 6.1123 | 963.1 |
| 0.0083 | 1161.3 | 12.87 | 955 |
| 0.01527 | 1155.1 | 19.559 | 915.4 |
| 0.016668 | 1154 | 23.884 | 892.7 |
| 0.019997 | 1151.6 | 27.265 | 881 |
| 0.022217 | 1150 | 29.204 | 873.1 |
| 0.033325 | 1143.2 | 31.079 | 868.7 |
| 0.049703 | 1134.7 | 33.485 | 859.5 |
Table 3: Pressure fall off test data of Case 2.
h=135 ft Ct=9.5*10-6 psi-1 rw=0.25 ft Bo=1 resbbl/STB
q=1050 bbl/day μ=0.7 cp
K=3.33 md φ=0.085
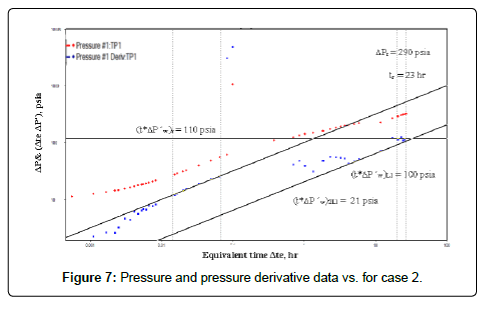
Figure 7 shows the log-log plot of pressure and pressure derivative versus time. It is clear from the log-log plot that the transition period occurs early during the linear flow regime. Consequently, two parallel straight lines of half-slope appear. The first line resulted from the expansion of the fracture network, while the second line represents the total system behavior. Also, the infinite acting radial flow line is detected but not long enough. The pressure derivative plot exhibit a unique behavior of a hydraulically fractured well in a naturally fractured reservoir. Britt et al. [11] analyzed the pressure behavior of this well by using the type curves of homogeneous reservoirs with hydraulic fracture. Therefore, they cannot estimate the values of the relative storativity and the interporosity flow coefficient.
From Figure 7:
(t*ΔP?w)r=110 psia tr=23 hr
ΔPr=290 psia (t*ΔP?w)2L1=21 psia
(t*ΔP?w)L1=100 psia
Direct Synthesis technique is used to estimate the reservoir parameters as following:
The fracture permeability can be calculated from the infinite acting radial flow line:

The relative storativity can be calculated from the two parallel half slope straight lines:

Calculate the fracture half-length from the linear flow straight line:


The fracture half-length can also be calculated from the total system dominated flow period:


The interporosity flow parameter after stimulation (λf) can be estimated from the original interporosity flow parameter:

Where,


=5.62*10-6


Calculate skin by reading any convenient point during the infinite acting period:


The differences between the results of the type curve matching obtained by Britt et al. [11] and the results of direct synthesis technique are shown in Table 4. The fracture permeability from type curve matching nearly the same as that from direct synthesis, while the fracture half lengths are very close.
| Parameter | Type curve matching by Britt et al. | Direct synthesis technique |
|---|---|---|
| Kf, md | 3.33 | 3.49 |
| Xf, ft | 442 | 375 |
| ω | 0.0441 | |
| λ | 5.62*10-6 | |
| λf | 12.6 | |
| Skin | -5.7 |
Table 4: Comparison of Results of Case 2.
Conclusions
1. The use of pressure derivative plots improved the analysis of well test data. Different flow regimes can be identified on the derivative log-log plots. Type curve matching can give good results in case all of the flow regimes are identified.
2. In this study, Tiab direct synthesis technique was shown to be accurate and simple. It gave direct estimates of reservoir parameters and fracture characteristics by using a log-log plot of pressure and pressure derivative data without type curve matching.
3. In case of high wellbore storage, the conventional semi-log analysis gives inaccurate results and cannot estimate all naturally fractured reservoir parameters.
4. When not all the flow regimes are identified, type curve matching gives non-unique solution. However, the direct synthesis technique gives accurate results of the naturally fractured reservoir parameters and fracture properties.
5. The direct synthesis method, showed accurate results compared to commercial software matching. It can be used to calculate the reservoir and fracture properties in case of a well crossed by a uniform flux or infinite conductivity fracture.
6. In case of naturally fractured reservoirs with a vertical fracture, if the transition period occurs during the linear flow, two parallel straight lines of slope 0.5 appear on the pressure derivative plot. This pressure derivative behavior can be used in calculating different reservoir parameters.
References
- Tiab D (1989) Direct Type-Curve Synthesis of Pressure Transient Tests. SPE 18992 prepared for presentation at the SPE Joint Rocky Mountain Regional/Low Permeability Reservoirs, Symposium and Exhibition held in Denver Colorado.
- Tiab D (1994) Analysis of Pressure and Pressure Derivative without Type Curve Matching; Vertically Fractured Wells in Closed Systems. Journal of Petroleum Science and Engineering, pp: 323-333.
- Engler T, Tiab D (1996) Analysis of Pressure and Pressure Derivative without Type Curve Matching; Naturally Fractured Reservoir. Journal of Petroleum Science and Engineering, pp: 127-138.
- Jalal F (2000) Application of Tiab’s direct synthesis technique to multi-layer naturally fractured reservoirs. PhD dissertation Norman Oklahoma.
- Warren JE, Root PJ (1963) The behavior of naturally fractured reservoirs. Soc Pet Eng J 63 3: 245-255
- Englerq T (1995) Interpretation of pressure tests in naturally fractured reservoirs by the direct synthesis technique. PhD dissertation Norman Oklahoma.
- Bourdet D, Gringarten AC (1980) Determination of Fissure Volume and Block Size in Fractured Reservoirs by Type-Curve Analysis. SPE Paper 9293 presented at the Annual Technical Conference and Exhibition Dallas TX September, pp: 21-24.
- Ahmed T (2010) Reservoir engineering handbook” (4thedn) Amsterdam: Gulf Professional Pub.
- Liu Ci, Yang J (1990) Transient Pressure Behavior With Regard To Wellbore Storage and Skin Effects for A Vertically Fractured Well In Dual-Porosity System SPE.
- Tiab D (1994) Analysis of Pressure and Pressure Derivative Without Type Curve Matching; Vertically Fractured Wells In Closed Systems. Journal of Petroleum Science and Engineering, 11: 323-333.
- Britt K, Bennett CO (1985) Determination of Fracture Conductivity in Moderate-Permeability reservoirs using the Bilinear flow concepts. SPE 14165 This paper was presented at the 60* Annual Technical Conference and Exhibition of the SPE Las Vegas NV September pp: 22-25.
Relevant Topics
Recommended Journals
- Oil & Gas Research Journal
- Renewable Energy and Applications Journal
- Oceanography Journal
- Industrial Pollution Control Journal
- Coastal Zone Management Journal
- Climatology & Weather Forecasting Journal
- Geoinformatics & Geostatistics Journal
- Engineering and Technology Journal
- Petroleum & Environmental Biotechnology Journal
- Polymer Sciences Journal
Article Tools
Article Usage
- Total views: 7110
- [From(publication date):
December-2016 - Jul 01, 2025] - Breakdown by view type
- HTML page views : 5742
- PDF downloads : 1368

