Analysis of Physical and Chemical Properties of Drinking Water in the Jeyranbatan Reservoir
Received: 10-Jul-2022 / Manuscript No. ico-22-69019 / Editor assigned: 16-Jul-2022 / PreQC No. ico-22-69019 (PQ) / Reviewed: 20-Aug-2020 / QC No. ico-22-69019 / Revised: 25-Aug-2022 / Manuscript No. ico-22-69019 (R) / Published Date: 29-Sep-2022 DOI: 10.4172/2469-9764.1000200
Abstract
The article investigates the physical and chemical indicators of water in the Jeyranbatan reservoir to ensure the safety of drinking water. Their comparative analysis with the indicators adopted as standards in the world, Europe, CIS and on the Absheron peninsula is carried out. Indicators not covered by the relevant structures are treated independently, and the impact of their variability on water composition is considered both individually and cumulatively. Proper monitoring and especially proper determination of measurement frequency intervals directly make it possible to raise the water quality indicators to a high level.
Keywords
Water; Physical and chemical parameters; Security; Reservoir; Monitoring
Introduction
Water is the most important chemical compound for the world's population. 50-97% of the mass of plants and animals, more than 60% of the mass of humans consists of water. Chemical processes in the body take place in such an aquatic environment. Some of the water is either polluted or expensive to extract because it is deep, which is why people are salt-free. can use only 0.003% of water.
The term environmental safety can be referred to in new terms. It is one of the most important issues facing the globalized world in the 1980s. In this regard, the UN Declaration on Environmental Protection, the Declaration on Environment and Development were adopted in Rio de Janeiro, the UN Millennium Declaration, and the Johannesburg Declaration on Environmental Protection. Sustainable Security Development [1-4]. There are several approaches to the concept of environmental security. From them [5]
• Environmental security as a system of solutions. It is understood as a system of economic, legal, technological solutions aimed at protecting the vital interests of the environment and human life, economic and other activities, from the emergencies of natural and man-made origin, possible negative impacts of hazards, ensuring security guarantees.
• Environmental security as part of national security. One of the components of the national security, ensuring the preservation of ecological balance in the environment.
• Environmental security as a totality of processes, situations and actions aimed at ensuring the ecological balance. A totality of processes, situations and actions aimed at ensuring ecological balance in the natural environment, not leading to the emergence of hazards (damage)
• Environmental security as an integral part of environmental protection. "Environmental security" and "environmental protection" are similar categories. Environmental security is considered a "logical implication of the evolution of the problem of environmental protection", the basic principle of environmental protection; it is a category aimed at protecting the objects of the natural environment from intrusions, hostile actions and threats.
• Environmental security as part of the production process. The category under investigation is considered in three aspects: - agriculture, industry, services; - production and economic activities of enterprises that do not pose a danger to the environment and humans; - characteristic of socio-ecological development aimed at the rational management of environmental problems and the creation of a new type of technological processes that prevent the occurrence of environmental hazards.
• Environmental security as a measure of hazard. According to researchers, the category of "environmental security" emerged from the need to assess the risks to the public in the case of damage to health, structure or property. Damage is caused by changes in the parameters of the natural environment. The occurrence of these changes is due to the presence of natural and man-made causes.
Almost 80% of the world's diseases are caused by poor water quality. Drinking water rich in iron for a long time causes liver and gastrointestinal diseases. For example, if the manganese content in the water is too high, the human nervous system is damaged, and fatigue, tiredness, and a tendency to sleep increase. Reservoirs can vary in types, such as lake, river and pool type. The physical properties of lake-type reservoirs are mostly associated with winds, most river-type reservoirs are elongated, the water mass properties are reminiscent of river water, and pool-type reservoirs are small in size and are used for irrigation, sanitary, sports or aesthetic purposes. Reservoirs can be divided into different types according to their properties. For example, according to the field, according to the means of filling, according to the geographical location, according to the place in the space of river basins, according to the means of regulating the flow, and so on. When it comes to operation, the hydrological regime of reservoirs, ie the parameters and technical means required for the operation of the reservoir, is controlled by man. However, over time, these artificial objects take their place in the general circulation of water.
The most important of the morphometric properties of reservoirs are the surface area S, the volume V and the amplitude of the water level oscillation. The income side of their water balance is atmospheric precipitation, surface runoff, condensation of water vapour on the surface of the reservoir, underwater currents. The cost side is surface drainage from the reservoir, underground drainage, surface evaporation. The structure of the water balance of an arbitrary basin takes into account the different types of income and the relationship between costs. Problem statement. One of the most important issues is water security. Security means meeting all requirements. In this regard, the article examines the degree of purity of water, its dependence on physical and chemical substances (found in Absheron). We consider it expedient to control water safety from a single point.
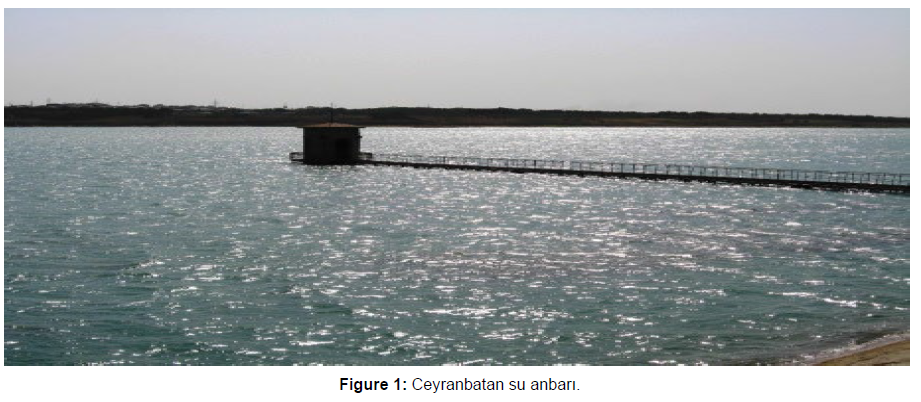
The Kura, Araz and Samukh rivers are the sources of drinking water for the Absheron Peninsula. Our area of interest is the Jeyranbatan reservoir. The Jeyranbatan reservoir fed from the Samur-Absheron canal and the water treatment complex built on the bank of the reservoir has a large share in the drinking water supply of the Absheron Peninsula (Figure 1). The food source is the Samur-Absheron canal, which receives water from the Samurchay, Valvalachay and Gudyalchay rivers. Today, water supplied to most parts of Baku and Sumgayit, Absheron, Khazar, Sabunchu and Surakhani districts is processed in Jeyranbatan. To deliver drinking water to consumers, 6 large diameter water lines were laid from the Water Treatment Plant Complex. 2 of them transport drinking water to Mashtaga reservoirs, 3 to Binagadi central pumping station, 1 to Sumgayit city. Quality indicators of drinking water supplied to consumers in the Republic of Azerbaijan are determined by an interstate standard adopted jointly by CIS countries (GOST 2874-82). In accordance with GOST 2874-82, over 35 indicators of drinking water are analyzed: organoleptic, physical and chemical, microbiological, parasitological, and radiological indicators. Currently, water from sources is treated in accordance with the GOST 2874-82 "Drinking Water" standard and is supplied to consumers. There are plans in the future to bring quality indicators of drinking water treated by Azersu OJSC in line with the requirements of international standards (World Health Organization, European Union). For this purpose, the up-to-date Central Laboratory started operating in Baku.
< p> Collection of primary informationPreliminary information is formed from samples taken from the Jeyranbatan Reservoir. Allows dividing the general information of information analysis into four classes according to its nature. These are the classes that characterize the physical, chemical, organoleptic and microbiological parameters.
Let's include physical parameters in the first class.
The following must be taken into account in the physical indicators of water quality in the Jeyranbatan reservoir:
• Temperature - varies within 1-27°C. The temperature of drinking water must be 7-11°C.
• Blurring - Transparency is measured by the device called a Shell. The device is a glass tube with a height of at least 300 mm. During the measurement, a sheet of paper marked with special fonts is placed under the pipe. If the fonts are readable from the height of the water layer, this height is called the transparency of the water according to the font. The size is expressed in cm. The transparency of drinking water should not be less than 30 cm from the cross. When the amount of water-dependent substances is less than 3 mg /l, it is difficult to determine the transparency of the cross and the font. In this case, it is necessary to remove very long glass pipes. In this case, the turbidity of the water is determined by a device called a photoelectric calorimeter (FEK). The turbidity of drinking water should not exceed 1.5-2 mg /l.
• Color -Water gets its color from colloidal iron compounds, silver acids, industrial waste, etc. contained in it. Color of drinking water should not exceed 200 by GOST 2874-82. Color is measured by PEC.
Taste and odor -Water gets its taste and odor from ferric salts, manganic compounds, sulfides, organic compounds and other mixes contained in it. Taste and odor are determined by organs of senses. 4 types of taste of water are identified: salty, bitter, sweet and sour. Taste and odor are measured by a 5-point scale:
• 0 point – not detected.
• 1 point – detectable only by an experience analyst.
• 2 point – detectable by consumer.
• 3 point – easily detectable, causes complaints.
• 4 point – water has unpleasant strong odor and taste.
• 5 point – water is not suitable for drinking.
According to the national standards, the taste of drinking water should not exceed 2 points.
1. The pH - the level of alkalinity and acidity in the water is checked by this indicator.
2. Dependent substances - 0.75 mg /l norm was adopted.
3. Electrical conductivity - although tested as a physical property of water, there is no limit to the norm.
4. Density - the density of water depends mainly on its temperature. As the state of water changes with temperature, so does the density, and therefore this parameter is not the norm. The chemical indicators of water quality in the Jeyranbatan reservoir must take into account the following:
1. Sulfides-S2 — mg/l- there is no limit of permissible concentration.
2. Dissolved gases :
• O2 is measured in mg/l and %, mg/l should be greater than 4 in winter and less than 6 in summer.
There is no permissible concentration limit in%. There is no limit to the permissible concentration of CO2.
3. Chlorines:
• The allowable concentration of free CL2 should be between 0.3-0.5 mg/l.
• The total allowable concentration of CL2 should be less than 1.2 mg / l.
4. Roughness - the allowable concentration limit should be less than 7 mg-eq/l.
5. Alkalinity - there is no allowable concentration limit.
6. Main ions: CL- (permissible concentration limit should be less than 350 mg/l), HCO3, CO3
-2, Ca2+, Mg2+
7. The salinity rate should be less than 1000 mg/l.
8. Biogenic substances - NH4+ - permissible concentration limit should be less than 0.5 mg/l, NO2- 3.3 mg/l, NO3- permissible concentration limit is 45 norms, PO4-3 - allowable concentration limit is 3, Must be 5.
The quality of drinking water supplied to the Absheron Peninsula is periodically monitored at various stages, from sources to delivery to the user. Drinking water quality control begins with laboratory analysis of water sources. Drinking water quality control begins with laboratory analysis of water sources. Before drinking water is supplied to the network, it is strictly analyzed by specialists and the results are registered in the Central Laboratory.
In the Jeyranbatan Reservoir, it is analyzed based on samples taken from 7 points [6]. These are the Takhtakorpu-Jeyranbatan canal of the Jeyranbatan Reservoir (hereinafter CSA), next to the CSA water intake facility, next to the CSA South pumping station, CSA Southwest Dam leakage water, CSA South Dam, leakage water, CSA North East Dam, leakage, leakage Amelioration is the entrance to the pump station. Solution: Requirements for drinking water There are norms adopted by various levels of institutions in the world regarding the composition of water. A large number of parameters are generally tested based on the physical and chemical characteristics of the water. During the implementation of the scientific work, the comparison of the average indicators of the International Health Organization, the European Union, the World Health Organization, the Absheron Peninsula, the Jeyranbatan Reservoir is considered.
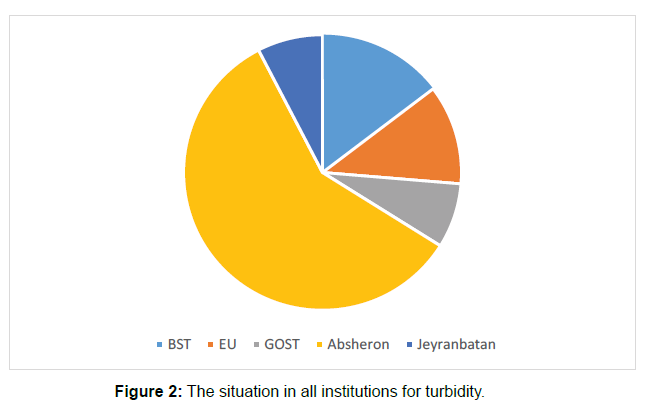
Different norms are adopted in each standard and each institution on parameters. The tested parameters are as follows: Odor, taste, colour, turbidity, hardness, electrical conductivity, Hydrogen carbonate (HCO3 -), Hydrogen index, Aluminum (Al), NH3 and NH4 -, Arsen (As), Iron (Fe2 +, Fe3 +), Silver (Ag), Hydrogen sulfide (H2S), Hydrisulfide ion (HS-), Chloride (Cl-), Chlorine 1. Free residue, Chlorine 2. Bond residue, Chlorate ion (ClO3 -), Potassium (K +), Calcium (Ca2 +), Manganese (Mn, total), Copper (Cu, total), Molybdenum (Mo, total), Magnesium (Mg2 +), Sodium (Na+), Nickel (Ni), Nitrates (NO3), Nitrites (NO2 -), Polyphosphate ion (PO4 3-), Strontium (Sr2 +), Zinc, Sulfates (SO4 2-), Cyanides (CN-). The norms of the parameters checked in the Jeyranbatan Reservoir and the parameters checked and intersected in other structures are shown in (Table 1). Among the norms set for the indicators of all institutions, there are both very close and different norms. Our main goal is to analyze the impact of physical and chemical substances on drinking water in the Jeyranbatan Reservoir. Therefore, we will look at the analysis of a physical and a chemical parameter measured in the Jeyranbatan Reservoir mentioned in the article as an example. For example, if we look at the turbidity parameter physically, if we examine the situation in the Absheron Peninsula, here, the turbidity is formed by the winds specific to the area in all seasons (Figure 2).
<| S.No | Parameters | Unit of measurement | World Health Organization | European Union | GOST | Average indicator for Absheron peninsula | Jeyranbatan Reservoir |
|---|---|---|---|---|---|---|---|
| 1 | Odor (20°; 60°) | point | - | - | 2 | 0 | 2 |
| 2 | color | degree | 15 | 20 | 20 (35) | 0 | 20 (35) |
| 3 | Turbidity | NTU | 5 (1) | 4 | 2.6 | 0 | 2.6 |
| 4 | Hardness (total) | meq/l | - | 1.2 | 7 | 5 | <7 |
| 5 | Electrical conductivity, 20° | µS/cm | - | 2 500 | - | 450 | - |
| 6 | Hydrogen carbonate, HCO3 | Mq HCO3-/L | - | >30 | - | 130 | - |
| 7 | Hydrogen | PH | - | 6.5-8.5 | 6-9 | 7.5 | 6.5-8.5 |
| 8 | NH4+ | mg/l | 1.5 | - | 0.5 | 0-0.17 | 0,5 |
| 9 | Chloride (Cl-) | mg/l | 250 | 250 | 350 | 29-154 | <350 |
| 10 | Chlorine 1. Free residual | mg/l | - | - | 0.3 - 0.5 | 0.3 | 0.3 - 0.5 |
| 11 | Chlorine 2. Fixed residual | mg/l | - | - | 0.8 - 1.2 | 0.5 | <1,2 |
| 12 | Calcium (Ca2+) | mg/l | - | 100 | 250 | 60 | - |
| 13 | Magnesium (Mg2+) | mg/l | - | 50 | 50 | 18.24 | - |
| 14 | Nitrates (NO3-) | mg/l | 50 | - | 45 | 3 | 45 |
| 15 | Nitrites (NO2) | mg/l | 3 | 0.5 | 3 | 0 | 3,3 |
| 16 | Polyphosphate ion (PO43-) | mg/l | - | - | 3.5 | 1.1 | 3,5 |
Table 1: Fragment of physical and chemical parameters tested in water.
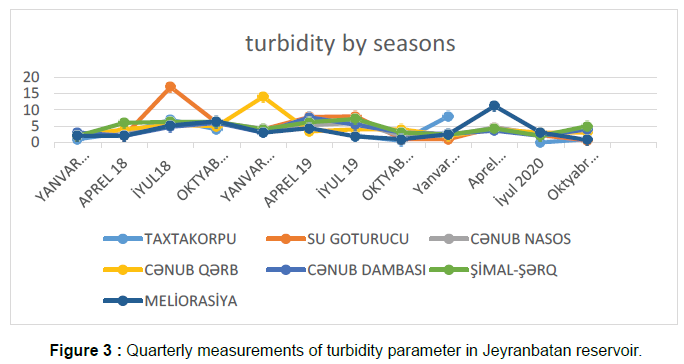
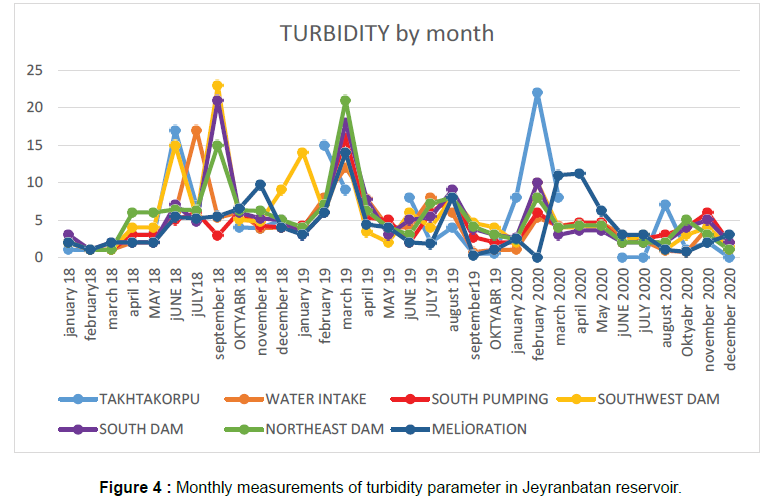
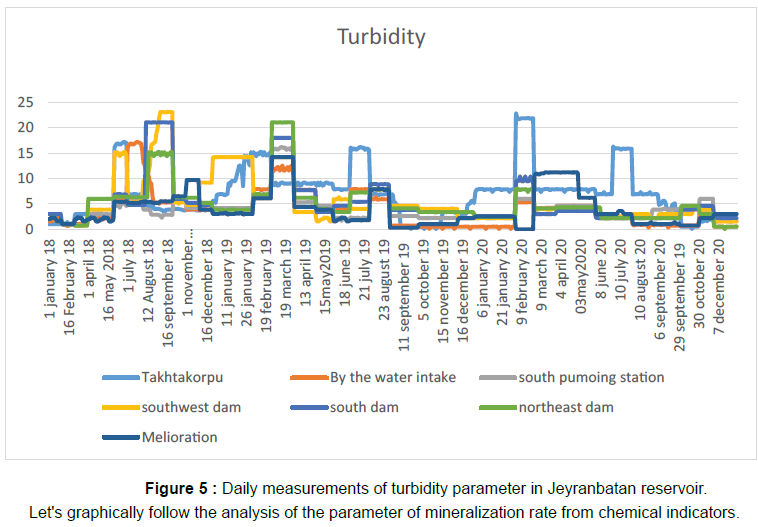
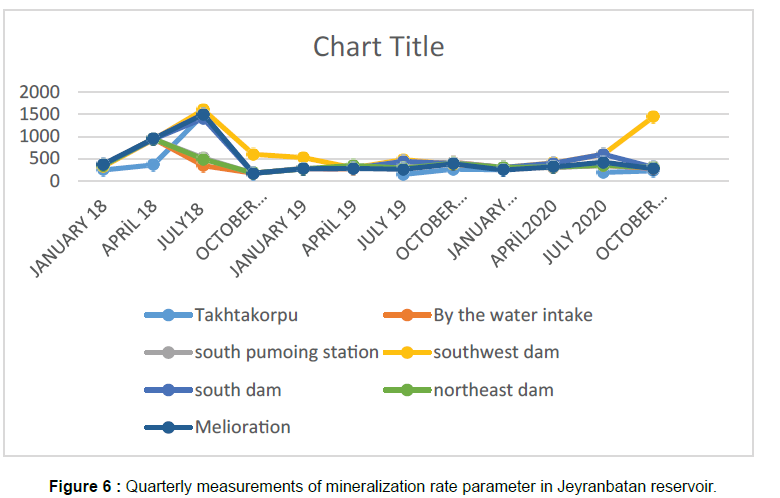
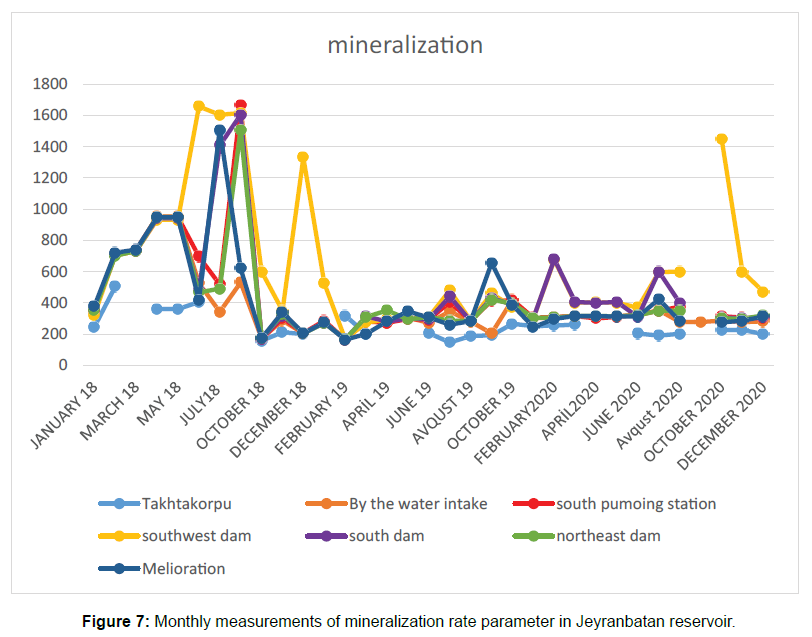
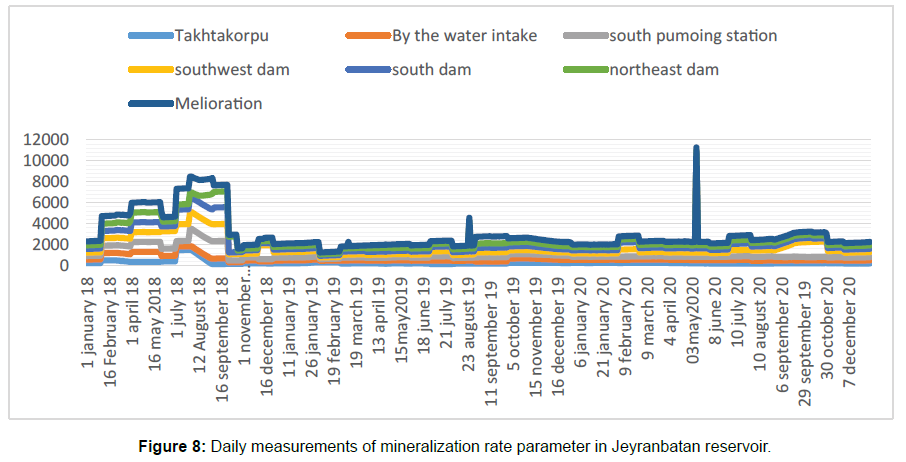
p> The analysis of turbidity parameters in the Jeyranbatan reservoir was carried out quarterly, once a month and once a day for three years. The result is shown graphically in the pictures below. It is obvious that daily measurements help you get more information. For example, in depending on the strength of the wind, the turbidity is particularly characteristic of the samples taken from the timber bridge, southwest and northwest. If we take into account that the Absheron Peninsula is generally a windy area, the results obtained are confirmed to be in line with reality. While the norm of mineralization is up to 1000, we see that the CSA South Dam, CSA Amelioration Pumping Station and especially the CSA Southwest Dam Leakage Measurements exceed the norm. The measurements and their comparative analysis were performed for all parameters, for example, the comparison of the results obtained at different measurement times of the concentration limit of the dependent substances with the norm is shown in (Table 2).Conclusion
As can be seen from (Figures 3-8) and(Table 2), the more we increase the frequency of monitoring, the clearer our results look. A comparative analysis also showed a difference in the frequency of monitoring for different parameters. For instance, electrical conductivity, hydrogen carbonate HCO3, magnesium, etc. can be measured at longer intervals than other parameters. At the same time, for pH, maximum permissible concentration, nitrates, etc., more frequent measurements are advisable. It should be considered that along with physical and chemical indicators, microbiological and organoleptic indicators also have a noticeable impact on water quality.
Therefore, it is advisable to develop an intelligent information system
| S.No | Water abstraction point | Number of points | Number of samples | Threshold concentration of related substances (mg/l) | Measurement date 10.10.2017 (mg/l) |
Measurement date 22.11.2017 (mg/l) |
|---|---|---|---|---|---|---|
| 1 | Takhtakorpu-Jeyranbatan water canal | 1 | 1 | 0.25 – 0.75 | 2 (2.66 times higher) | 0 |
| 2 | By the water intake | 1 | 1 | 0.25 – 0.75 | 3 (4 times higher) | 1 (1.33 times higher) |
| 3 | By the south pumping station | 1 | 1 | 0.25 - 0.75 | 3 (4 times higher) | 3 (4 times higher) |
| 4 | Southwest dam, effluent water | 1 | 1 | 0.25 - 0.75 | 3 (4 times higher) | 3 (4 times higher) |
| 5 | South dam, effluent water | 1 | 1 | 0.25 - 0.75 | 7 (9.3 times higher) | 2 (2.66 times higher) |
| 6 | Northeast dam, effluent water | 1 | 0.25 - 0.75 | 4 (5.33 times higher) | 4 (5.33 times higher) | |
| 7 | Melioration pumping station entrance | 1 | 1 | 0.25 - 0.75 | 2 (2.66 times higher) | 6 (8 times higher) |
Table 2: A fragment of the hydrochemical analysis of the Jeyranbatan reservoir.
aimed at ensuring the safety and quality of water in the Jeyranbatan reservoir in compliance with the required standards.References
- G Handl (1972) Declaration of the United Nations Conference on the Human Environment
- M Summit (2021) United Nations Millennium Declaration.
- Johannesburg Declaration on Sustainable Development. Access mode:
- Hwang MS (2018) Statistical study of the ecological safety of territories. Dissertation for the degree of candidate of economic sciences. Novosibirsk 215.
- Hidayatzade SG (2019) Comparative analysis of qualitative indicators of Jeyranbatan reservoir Informatics and Control Problems 39: 117-124
- Hidayatzade SG (2021) Multi-agent approach to the organization of monitoring of Jeyranbatan reservoir of the republic of Azerbaijan Synergetic approaches in the solution of problems of science, culture and the modern education. Astrakhan 30-38
Citation: Gidayatzade SG (2022) Analysis of Physical and Chemical Properties of Drinking Water in the Jeyranbatan Reservoir. Ind Chem, 8: 200. DOI: 10.4172/2469-9764.1000200
Copyright: © 2022 Gidayatzade SG. This is an open-access article distributed under the terms of the Creative Commons Attribution License, which permits unrestricted use, distribution, and reproduction in any medium, provided the original author and source are credited.
Share This Article
Recommended Journals
Open Access Journals
Article Tools
Article Usage
- Total views: 2037
- [From(publication date): 0-2022 - Apr 03, 2025]
- Breakdown by view type
- HTML page views: 1692
- PDF downloads: 345
