Research Article Open Access
Analysis of Fractured Reservoir Structure by Interpretation of FMI and VSP Logs
Afshin Davarpanah*, Masoud Kakoli and Hossein Ahmadi
Department of Petroleum, Science and Research Branch, Islamic Azad University, Tehran, Iran
- *Corresponding Author:
- Afshin Davarpanah
Department of Petroleum
Science and Research Branch
Islamic Azad University, Tehran, Iran
Tel: 989337223427
E-mail: afshindpe@gmail.com
Received date: October 31, 2016; Accepted date: December 04, 2016; Published date: December 08, 2016
Citation: Davarpanah A, Kakoli M, Ahmadi H (2016) Analysis of Fractured Reservoir Structure by Interpretation of FMI and VSP Logs. J Marine Sci Res Dev 6:216. doi: 10.4172/2155-9910.1000216
Copyright: © 2016 Davarpanah A, et al. This is an open-access article distributed under the terms of the Creative Commons Attribution License, which permits unrestricted use, distribution, and reproduction in any medium, provided the original author and source are credited.
Visit for more related articles at Journal of Marine Science: Research & Development
Abstract
Imaging technology into the well is the tools for logging system, interpretation of data obtained from the well and to create the image with high resolution from the wells. This technology creates an accurate image (screenshot tools and the vertical seismic) on structural characteristics, layering, fractures, faults, texture and secondary porosity play an important desirable role in describing the reservoir. In the carbonate reservoirsthat most of Iran reservoirs are included in this type fractures are the most important factor in the production of these reservoirs. In the fractured carbonated reservoirs faults and folds makes unwanted changes in the structure of these reservoir. Structural complexities occur at different scales. For example, major faults and the original boundaries between formations are visible on the surface seismic data. But small-scale changes and faults in seismic data cannot be determined and it is essential to use small-scale of data and information sources. For achieving to these purposes it can be combined the result of small-scale data such as internal wellbore seismic VSP (vertical seismic profile) that having separating power in meter limit and FMI (formation micro imager) imaging logs that having separating limit in centimeter limit that could be able to modeling structural complexities and distribution of fractures around well. It should be noted that identifying occurrences around the wellbore is very important in drilling, completion procedures and development programs. FMI (formation micro imager) logs can be directly determined the inverted changes of wellbore layers and formation structures and also was an important factor for stratifying layers and determining the lithology of oil and gas explorations that can be determined the wellbore fractures, inclination and direction by using its interpretation. Moreover VSP (vertical seismic profile) logs is the way that generated signals at the surface are received by the geophone at different depth levels in the wells, which by its interpretation; changes in wellbore direction, velocity profiles, faults with higher accuracy around the wells and fractures around the well can be determined.
Keywords
Interpretation; VSP; FMI; Fractured reservoir; Seismic data
Introduction
Fractures are the properties of the largest oil fields in fractured in carbonate reservoirs. In carbonate rocks, tectonic forces, their dissolution, recrystallization and… so that, each can create fractures in the rock. Rock fractures can be created on the deposition time, but the impact of these fractures on reservoir properties of the rocks is very low. Natural fractures are as an important parameter in exploring and producing of hydrocarbons and most of the important oil and gas fields by the amount of production from fractured reservoir have been calculated. Fracture increases porosity and in the tight reservoirs [1] with the connection between the reservoir units in the field, to substantially increase the permeability. Fractures and cracks have a principal role in production rates and ultimate recovery amount from oil reservoir especially in carbonated formations.
The subject area can be classified into four parts:
• Optical imaging
• Acoustic imaging
• Methods that draw on both acoustic and electrical imaging techniques using the same logging tool
Optical imaging
Down hole cameras were the first borehole-imaging devices. Today they furnish a true high-resolution color image of the wellbore. The principal drawback is that they require a transparent fluid in liquid principal drawback is that they require a transparent fluid in liquidfilled holes. Unless transparent fluid can be injected ahead of the lens, the method fails [2].
Acoustic imaging
Acoustic borehole-imaging devices are known as “borehole televiewers”. They are mandrel tools and provide 100% coverage of the borehole wall. The first borehole televiewers, operating at a relatively high ultrasonic frequency of 1.35 MHz, was developed by Mobil Corp. in the late 1960s [3,4].
Electrical imaging
Micro resistivity imaging devices were developed as advancement on dip meter technology, which they have mostly superseded. Traditionally, they have required a conductive borehole fluid, but it will be seen later that this requirement has been obviated by oil-based-mud imaging tools. Originally, in the mid-1980s, they comprised two highresolution pads with 27 button electrodes distributed azimuthally on each. This arrangement provided a coverage of 20% of an 8.5-in. [216 mm] wellbore in a single pass [5].
Micro FMI (formation micro imager) electrical special resistivity illustrator
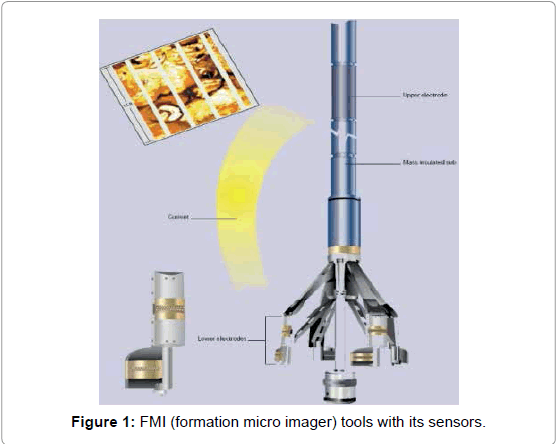
Electrical special resistivity Illustrator tools are electric tools by using a number of small electrodes are mounted on the pads, are able to measure the electrical conductivity of the borehole formation. Each pads covers a limited part of the well, so in the FMI (formation micro imager) tool, pads stands for the number of electrodes and increase logging coverage of wells (Figure 1).
FMI (formation micro imager) tools are distinguished with linear, nonlinear, and sedimentary and digenesis structures have many applications. One of the important functions of this tool is that it can be combined with other tools and provides better images of FMI (formation micro imager).
Factors that are created error in the image of electrical resistivity [6] (Table 1):
| Tool length | weight | Diameter in closed status | Number of sensors | Pads number |
|---|---|---|---|---|
| 316 inch | 456 pound | 5 inch | 192 | 8 |
Table 1: Physical properties of FMI (formation micro imager) tools.
• Tools cohesion to the wellbore.
• Differences in the friction rate of pads with wellbore.
• Distances between Pads and receivers.
• Error in moving cable Illustrator tool.
• Creating profit environmental noise and its effect on the image.
Data processing and correction of the FMI (formation micro imager): In general, image data should pass the stages of preparation, which includes the modification and processing steps that are listed below:
Velocity correctio: It should be noted that the vertical distance between the receiver and between the flaps and pads in situations where velocity is variable, it will not be the same. Sometimes the velocity and distance correction of pads and flap is done in two separated stages: first the mobility and then velocity correction will be done. But it is suggested that the velocity correction is done first and then data mobility will be made.
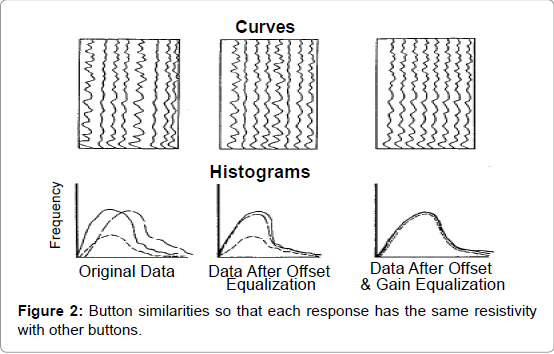
Synchronization: In imaging operations it must be taken that all of the electrodes to be stable environment, have the same answer. This means that the recipient must be matched to synchronized response. The data transfer can be rubber pads on the center of all the matches (Figure 2).
Receiver’s correction: If response of one receiver determined abnormally, it must ignored the responses and use from auxiliary receiver data instead that this operation will be done by extrapolation of auxiliary receivers.
Voltage correction: Although this correction is not required for electrical image logging but has an important role in improving image quality. While logging operation, it would be possible that used voltage was changed.
Interpretation of FMI (FORMATION MICRO IMAGER) data
Principles of interpretation. Instructions below interpreted the images easily:
1) When observing and describing sedimentary structure and determine the slope, horizontal and vertical scale images must be equal. 2) When interpretation of enhanced images should be investigated as a reference to assess the range of normal static images visible. 3) When comparing the images with core images, just the boundary layer, thin layers, vertical fractures or in the well direction are common in both heterogeneous formations.
Application of FMI (formation micro imager) image data Visual interpretation of the data:
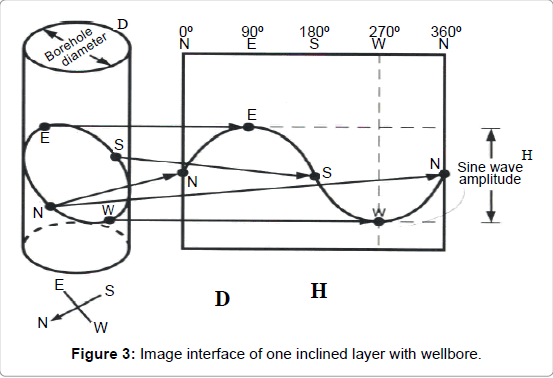
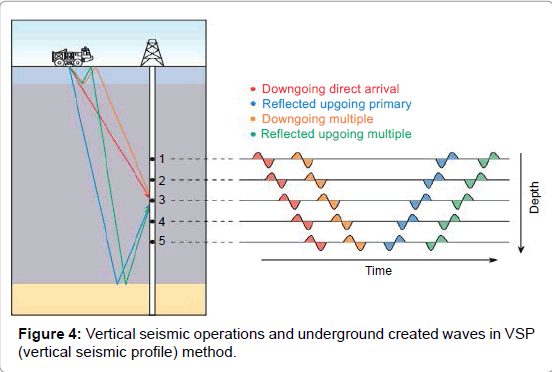
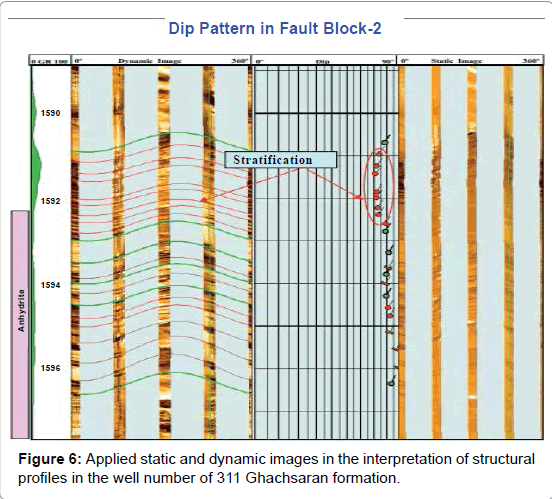
A) Review of discontinuities (Figures 3 and 4)
B) Review of fractures and cracks
Because FMI (formation micro imager) power illustrator was about a tenth of an inch (1/10), a large percentage of fractures and cracks can be investigated and the slope and fractures azimuth can be calculated. The principal measuring of VSP (vertical seismic profile). A seismic source are located in the surface and near to the wellbore. Produced signal are received from the sources by hanging zheo-phones in the well. Received data included rising and falling waves, thereby the seismic waves that had saved in each depth included in two parts. For separating the two necessary parts of the rising and falling signals it should be possible to be picked up in thick interval (50 to 400). Separation of rising and falling by using computers it can be conceivable.
Analysis of rising and falling waves caused to provide the possibility in changing seismic wave with the exact depth study. After that the earth acoustic specification can be interpreted directly by lithology qualifications and related geological properties.
Data entry: Equipment used in the VSP (VERTICAL SEISMIC PROFILE) as follows:
Seismic source that can be air guns, water gun or even vibration size. Internal Zheo-phones and sensors in the well. Hardware and software equipment to process the received data.
Advantages of using the VSP (vertical seismic profile)
Recording seismic wave in the well rather than relying on artificial seismic section. Measuring falling spectral content of seismic signal as a function of depth. Creating precise correlations between the results of surface seismic and logging, because seismic data have high vertical resolution. Recording signal with high frequency. Favorable seismic separation for stratigraphic properties around the wellbore like faults.
VSP (vertical seismic profile) applications
The primary use of VSP is the integration of VSP and down hole logging to surface reflection surveys [7]. Contrary to surface studies, which infer subsurface conditions from measurement of the reflected wave fields with the source and receiver at the surface, a VSP configuration involves closely spaced direct physical measurements of the wave field between the source position and the reflector (Table 2). 1) Construction of time versus depth curves with high resolution: in various VSP (vertical seismic profile) incarnations takes place from 3 to 7 milliseconds, so it can be converted time to the depth with high accuracy. This operation will not be applicable when sonic logs due to misappropriate conditions of the well. For example, in the low depths if formation velocity is less than 1600 m/s sonic logs cannot be withdrawn. In these circumstances, obtained velocity from VSP (vertical seismic profile) is the only possible measuring method.
| Minimum wellbore radius | Maximum wellbore radius | Maximum wellbore deviation | Maximum electrical resistivity |
| 316 inch | 456 pound | 5 inch | 192 |
Table 2: Limitations of FMI (formation micro imager) tools.
2) Separation power of VSP (vertical seismic profile) tools provides that existence and non-existence of reflections that their presence on the seismic section is with doubt has been confirmed. 3) When used VSP (vertical seismic profile) in deep wells it can be received data from greater depths than the maximum depth of the well. Maximum depth in VSP (vertical seismic profile) was much more than superficial. 4) By using VSP (vertical seismic profile) zones of high pressure and soft sand can be identified. 5) Since in the VSP (vertical seismic profile) falling waves are recorded. Repeated reflections are not distinguished and also this data can be used for reprocessing surface seismic section near the wellbore. 6) Analysis of the rising wave provides information about the earth filtering and by this action, effect of this energy attenuation and phase change may be assessed. 7) Due to lateral searching depth in VSP (vertical seismic profile) is between logging and surface seismic, thereby data about 40s meter of the formation can be achieved. 8) The most common use of VSP (vertical seismic profile) communicate of surface seismic section reflection and the specific petro-physics features that will be measured in the well [8]. 9) Put a seismic source distance away from wells, construction and stratigraphic specifications at a distance of hundreds to thousands of feet from the well to the surface against surface seismic section can be detected.
Working Procedure
According to the high accuracy of image logging tools through the well that investigate the details in the well properly and get appropriate results to the petroleum engineers and thereby, well internal seismic tools due to high separation power in the limit of meter (10-100) according to the surface seismic and combined the results of these two methods for investigating whit more details through and around the well can be influenced in many problems.
This method due to its limitations such as high costs and lack of other reductions has been less used.
In this part, one of Iran’s field has studied that has useful results for engineers that be paraphrased briefly.
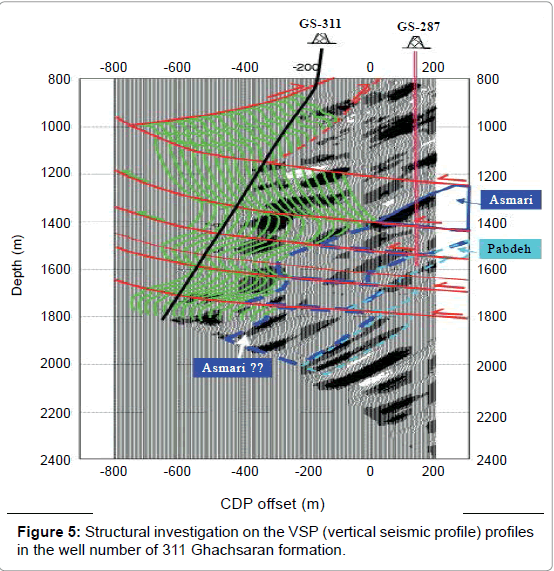
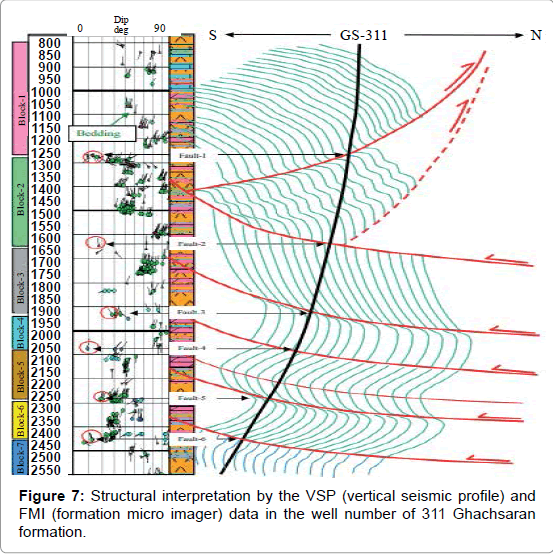
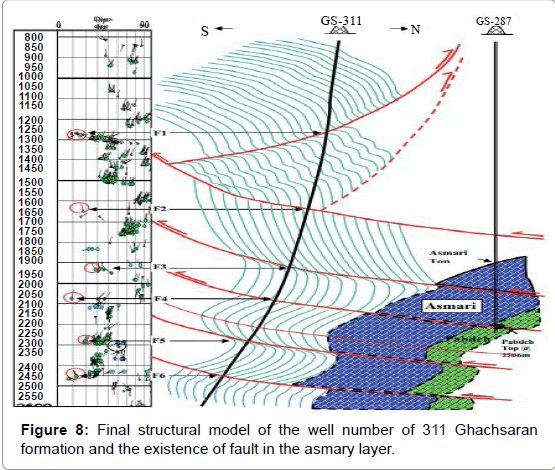
First of all, VSP (VERTICAL SEISMIC PROFILE) and image logging tools have been studied separately. This action was done because effect of each result didn’t impact on other results. Therefore, each result compared to other results to field formation image can be seen properly (Figures 5-8) (Table 3).
| Measure Depth(m) | True Vertical depth(m) | Average Velocity(m/s) | Interval Velocity(m/s) | One way Time(s) | Two way Time(s) | ||||||
| Gs-4 | 459 | 451.7 | 3253 | 3751.7 | 140.2 | 280.4 | |||||
| Gs-3 | 1049 | 1041.7 | 3527.6 | 3772 | 295.5 | 591 | |||||
| Gs-2 | 1288 | 1280.7 | 3602.3 | 4026.6 | 356.0 | 712.0 | |||||
| Caprock | 1530 | 1522.7 | 3620.0 | 4131 | 421 | 842 | |||||
| Asmary | 1617 | 1609.7 | 3674.5 | 5055.3 | 438.8 | 877.6 | |||||
| 1913.5 | 1905.5 | 3859 | 5488 | 494.34 | 988.67 | ||||||
Table 3: Data processing.
Conclusion
Results that was received by these two well structural techniques in the small scale showed that each technique had particular advantages.
For instance, VSP (VERTICAL SEISMIC PROFILE) can be described the far distances from the well. Distance depended on average decline of layers within well incline, and also used for detecting the length of faults improvements. But all the problems didn’t solve by this technique, because accuracy and resolution of these images were very low and the layers with high inclination and several azimuths didn’t receive to the zheo-phone. Thereby it affected on the image qualities and reflections. Nevertheless, FMI (formation micro imager) and FMS logs have images with very high accuracy images that the values of inclination and azimuth can be properly calculated. FMI data are also used in geo-mechanical reservoir analysis to identify drilling-induced features such as breakouts. Stress field analysis of FMI data provides critical information for controlling wellbore stability problems in the engineering of drilling. Furthermore, by combining of these both techniques from the lateral well, structural model has been designed. The special properties of the Vertical Seismic Profile, which allows the separation of the upward and downward travelling components of the recorded waveform, provides a means of studying the acoustic response of the earth in detail. VSP (vertical seismic profile) obtained figure and improvement of Asmary formation and faults along the wells. According to this model, 6 faults had broken wellbore so, exception of first fault F1 in the depth of 1270 meters that inclined to the south, the other 5 faults inclined to the north.
Layers and sections in Ghachsaran Formation had more flexibility than Asmary. Possible location of Asmary formation is showed through above figures. Faulted Asmary formation is about 200 meter distances from the well of 311 in Ghachsaran. This formation is located in the north direction of the well. Thus, any deviation wells within the north direction (or northwest) can cross Asmary formation.
References
- Peng Zhu, Chengyan Lin, HuaiqiangRen, Zhenyu Zhao, Hualian Zhang (2015) Micro-fracture characteristics of tight sandstone reservoirs and its evaluation by capillary pressure curves: A case study of Permian sandstones in Ordos Basin, China.J of Natural Gas Sci and Eng 27: 90-97.
- Prensky S (1999) Advances in borehole imaging technology and applications. In: MLovell, G Williamson, P Harvey (eds.) Borehole Imaging: Applications and Case Histories. Geological Soc, London. pp: 1-43.
- Micro-fracture characteristics of tight sandstone reservoirs and its evaluation by capillary pressure curves: A case study of Permian sandstones in Ordos Basin, China
- Zemanek J, Caldwell RL, Glenn EE (1969) Theborehole televiewer-a new logging concept for fracture location and other types of borehole inspection. J Pet Technol 21: 762-774.
- Chen MY, EkstromMP, Dahan CA (1987) Formation imaging with microelectrical scanning arrays. The Log Analyst 28: 294.
- Zemanek J, Glenn EE, Norton LJ (1970) Formation evaluation by inspection with the borehole televiewer. Geophysics 35: 254-269.
- Lesparre N, Boyle A, Grychtol B, Cabrera J, Marteau J, et al. (2016) Electrical resistivity imaging in transmission between surface and underground tunnel for fault characterization. J of Applied Geophy 128: 163-178.
- Judith Sausse, ChrystelDezayes, Louis Dorbath, Albert Genter, Joachim (2010) Place 3D model of fracture zones at Soultz-sous-Forêts based on geological data, image logs, induced microseismicity and vertical seismic profiles. ComptesRendusGeoscie 342: 531-545.
Relevant Topics
- Algal Blooms
- Blue Carbon Sequestration
- Brackish Water
- Catfish
- Coral Bleaching
- Coral Reefs
- Deep Sea Fish
- Deep Sea Mining
- Ichthyoplankton
- Mangrove Ecosystem
- Marine Engineering
- Marine Fisheries
- Marine Mammal Research
- Marine Microbiome Analysis
- Marine Pollution
- Marine Reptiles
- Marine Science
- Ocean Currents
- Photoendosymbiosis
- Reef Biology
- Sea Food
- Sea Grass
- Sea Transportation
- Seaweed
Recommended Journals
Article Tools
Article Usage
- Total views: 8779
- [From(publication date):
December-2016 - Jul 03, 2025] - Breakdown by view type
- HTML page views : 7493
- PDF downloads : 1286

