Analysis of Air Quality in Bengaluru city, India
Received: 12-Feb-2020 / Accepted Date: 22-Apr-2020 / Published Date: 29-Apr-2020 DOI: 10.4172/2573-458X.1000175
Abstract
Air pollution has become one of the most hazardous global concerns, killing an estimated 7 million people worldwide every year. Bengaluru, the city of India’s high-tech industry has been developing economically scaling up the luxuries of living lifestyle. Due to the rapid development of this metropolitan city, it has been facing deteriorating environmental conditions. The sole objective of this paper is to critically analyze the air pollution trend from 2011-2018 at various industrial, residential, sensitive and moderate locations in Bengaluru on various factors that contribute to air pollution.
Keywords: Air Pollution; Environment; Bengaluru.
Introduction
Collection of certain pollutants in the air which counter affects the health of a wellbeing human, animal and plant life is known as air pollution. According to the World Health Organization (WHO); 1.4 million deaths from strokes every year, 2.4 million deaths from heart diseases every year, 1.8 million deaths due to lung disease and cancer every year and 7 million premature deaths every year are attributable to air pollution. Air is everywhere and so is its influence polluted air can adversely affect the human health, buildings, monuments, plants, ecosystems and the list is endless. Polluted air has been linked to climate as particulate matter absorbs or reflects sun light and affect cloud formation and rainfall pattern of a place [1].
Pollutants such sulphur dioxide, nitrogen dioxide and carbon monoxide are released into the atmosphere through various combustion processes; burning of fossil fuels such as coal, oil, natural gas and gasoline are the main sources of these pollutants. Particulate matter pollutants is a mixture of solid particles and liquid droplets that are added into the air by dust ash, fly ash, soot, smoke, aerosol and condensing vapors suspended in the atmosphere for longer periods of time [2].
Bengaluru is often manifested through the arduous battles that are fought by the citizens to save the city. The IT capital of the country has an ever growing population, now estimated to be over 1.2 crore [3].The rise in the population is directly related to the rise in the number of vehicles, around 1750 new vehicles are getting registered in the city every day and the vehicle population in Bengaluru has crossed 80.45 lakhs [4]. This has substantially had a tremendous effect on the city’s ambient air quality and health. This paper is an attempt to analyze the critical pollutants such as SO2,NO2 and RSPM, together constituting the Air Quality Index, using this information this paper also tries to analyze the general health effects these pollutants cause on both long and short term exposure. Due to the socio-economic and environmental challenges associated with rapid urbanization, it is connected with increasing levels of ambient concentration of air pollution. Main contributor of air pollutants in Bengaluru is the transport sector.
In the year 2018, there has been a report that the number of vehicles in Bangalore has crossed 80 lakhs, by this number we can estimate the amount of unprecedented emission into the air that is going to pollute the air up to a great extent. Increase in number of non transport vehicles (mostly two wheelers) is caused due to the rapid expansion of city without development of proper infrastructure. These vehicles not only cause emission of RSPM, SO2 and NO2 but also HC and CO which has led to increase in their concentration in air. Diesel consumption in vehicles emits SO2 and particulate matter of all size. Particulate matter of size less than 2.5 and 1 μm is expected to have increased due to increase in consumption of diesel. High concentration of RSPM level due to construction activity can be managed if proper care is taken during construction [5].
On a global perspective, the effect particulate matter has proven that women are at a greater risk and also sometimes fatal due to prominent effect of particulate matter. Women showed a relative risk for fatal CHD of 1.42, 1.38, and 1.22 with each increase of 10 micrograms per cubic meter (μg/m3) of airborne PM2.5, PM10 – 2.5, and PM10, respectively, in the air pollution they encountered during the four years preceding death. Postmenopausal women showed higher relative risks of 1.49, 1.61, and 1.30 for each 10 μg/m3 increase in PM2.5, PM10–2.5, and PM10, respectively. Neither O3, SO2, nor NO2 was associated with fatal CHD on its own. O3 and to a lesser degree SO2 (but not NO2) increased the effect of all sizes of PM [6].
Population increase causes a significant positive impact on ambient air pollution [7]. Demand for land, food, transport, energy, natural resources and environmental infrastructures increases with the population rise and ecological balance is disturbed which in turn increases human and socio economic activities leading to increase in ambient air pollution. Backbone of economic development is energy consumption. However environmental pollution and its degradation are caused by unsustainable production and consumption patterns [8]. Reduction in life expectancy and increasing mortality is significantly caused by increased ambient air pollution. However, sustained economic development, along with energy efficiency are potential options for reducing ambient air pollution while improving quality of life and environmental sustainability [9]. By evaluating all the analysis done by various other researchers, RSPM contributes the most to the air pollution throughout the world. In the recent past all the other gaseous components seems to be under control except for the levels of RSPM.
Materials and Methods
Field sampling
Under National Ambient Air Quality Monitoring Programme (N.A.M.P), Karnataka State Pollution Control Board is monitoring Ambient Air Quality at 7 ( Graphite India Limited, KHB Indl Area, Peenya Industrial area ,Victoria Hospital , Amco batteries, Yeshwanthpur Police Station and International Machine tools accessories at Peenya ) locations using ‘ Respirable Dust Sampler’ (RDS) in Bangalore City by Conventional method. Four air pollutants viz., Sulphur Dioxide (SO2), Oxides of Nitrogen as NO2 and Suspended Particulate Matter (SPM) and Respirable Suspended Particulate Matter (RSPM/PM10), have been identified for regular monitoring at all the locations. The monitoring of pollutants is carried out for 24 hours (4-hourly sampling for gaseous pollutants and 8- hourly sampling for particulate matter) with a frequency of twice a week, to have 104 observations in a year.
Data Quality
A majority of the air pollution monitoring stations across the country are operated manually and it is unclear how the 8-h samples are used for regulatory purposes of assessing whether locations are meeting the 24-h NAAQS, since an 8-h sample only captures a snapshot of the actual levels. Further, it is likely that singular pollution episodes are either not accounted for, or have an undue influence on the measurements resulting in under- or over-reporting of PM10 concentrations. Manual monitoring also results in a delay in data collection, transmission, and availability, although the increasing number of CAAQMS are allowing data to be streamed to the CPCB website in near real-time overcoming some of the aforementioned concerns [10].
Calculation of AQI
On the Field Data Log, fill in the top portion of the form including: the date/time of visit, the site identification, sampler identification, site name, filter ID number, sample start and stop dates and times, and field operator initials.
10^3=unit conversion factor for milligrams (mg) to micrograms (μg)
The index of specific pollutant is derived mainly from the physical measurement of pollutants like SPM, RSPM, SO2 and NOx. There are several methods and equations used for determining the AQI. In the present study AQI for each location in the study area has been estimated with the help of a mathematical equation given below.
AQI=1/3[{SO2/SSO2}+{NOX/SNOX}+{RSPM/SRSPM}}] × 100
Where,
SO2=Individual Values of sulphur dioxide
NOX=Individual values of oxides of nitrogen
RSPM= Individual values of Respirable suspended particulate matter and
SSO2, SNO2 and SRSPM=Standards of ambient air quality of sulphur dioxide, oxides of nitrogen, Respirable suspended particulate matter [11].
Calculation of Exceedance Factor
Also, the Central Pollution Control Board (CPCB) developed a formula known as the Exceedance Factor (EF) so that it is easy for everyone to understand the pollution level.
EF=Observed Annual Mean of Criteria Pollutants/Annual Standard For Respective Pollutant
Therefore, Air Quality can be classified into the following:
Critical Pollution (C): EF>1.5
High Pollution (H): EF belongs to [1.0-1.5]
Moderate Pollution (M): EF belongs to [0.5-1.0]
Statistical Analysis
The statistical analysis was performed using Microsoft Excel 2010 to obtain graphs with respect to the trends that are being observed in the obtained data from KSPCB. Along with excel, we also used R Software to analyse the relationship between the pollutants and the Air Quality Index. Pearson correlation analysis (CA) was employed to analyse the inner relationships among elements.
Results And Discussion
Air pollution measurement in Bengaluru
Under the National Ambient Air Quality Programme (NAMP), the Karnataka State Pollution Control Board (KSPCB) has installed pollution recording apparatus at various locations throughout the city (Table 1). In this paper, the following locations are used for the analysis:
| Location Type | EF(RSPM) | Standards | 2011 | EF | 2012 | EF | 2013 | EF | 2014 | EF | 2015 | EF | 2016 | EF | 2017 | EF | 2018 | EF |
| Industrial | ITPL | 60 µg/m3 | 1.83 | C | 2.41 | C | 2.22 | C | 3.83 | C | 3.15 | C | 2.18 | C | 1.73 | C | 1.88 | C |
| Yelahanka | 60 µg/m3 | 2.97 | C | 3.03 | C | 2.13 | C | 2.02 | C | 1.82 | C | 1.85 | C | 1.7 | C | 1.72 | C | |
| Peenya | 60 µg/m3 | 1.66 | C | 1.78 | C | 2.08 | C | 2.4 | C | 2.12 | C | 1.82 | C | 1.59 | C | 1.5 | C | |
| Sensitive | Victoria Hospital | 60 µg/m3 | 0.88 | M | 2.2 | C | 1.47 | H | 2.57 | C | 1.7 | C | 1.33 | H | 1.09 | H | 1.17 | H |
| Residential | Yeshwanthpur | 60 µg/m3 | 2.05 | C | 1.75 | C | 1.83 | C | 2.15 | C | 1.75 | C | 1.56 | C | 1.58 | C | 1.75 | C |
| S.G.Halli | 60 µg/m3 | 0.33 | L | 1.2 | H | 0.37 | L | 0.72 | M | 1.2 | H | 0.77 | M | 0.84 | M | 0.97 | M | |
| Amco Batteries | 60 µg/m3 | 1.07 | C | 2.2 | C | 2.83 | C | 3.48 | C | 1.98 | C | 1.78 | C | 1.44 | H | 1.71 | C | |
| Moderate | City railway station | 60 µg/m3 | 0.9 | M | 1.65 | C | 1.07 | H | 1.12 | H | 1.73 | C | 1.7 | C | 1.68 | C | 2.01 | C |
| Location Type | EF(NO2) | Standards | 2011 | EF | 2012 | EF | 2013 | EF | 2014 | EF | 2015 | EF | 2016 | EF | 2017 | EF | 2018 | EF |
| Industrial | ITPL | 40 µg/m3 | 0.84 | M | 0.77 | M | 0.75 | M | 0.84 | M | 0.53 | M | 0.83 | M | 0.79 | M | 0.82 | M |
| Yelahanka | 40 µg/m3 | 0.84 | M | 0.76 | M | 0.63 | M | 0.74 | M | 0.39 | L | 0.71 | M | 0.74 | M | 0.79 | M | |
| Peenya | 40 µg/m3 | 0.73 | M | 0.8 | M | 0.71 | M | 0.8 | M | 0.51 | M | 0.93 | M | 0.8 | M | 0.8 | M | |
| Sensitive | Victoria Hospital | 20 µg/m3 | 1.23 | H | 1.55 | C | 1.45 | H | 1.55 | C | 1.15 | H | 1.82 | C | 1.59 | C | 1.59 | C |
| Residential | Yeshwanthpur | 40 µg/m3 | 0.83 | M | 0.57 | M | 0.78 | M | 0.79 | M | 0.57 | M | 0.99 | M | 0.83 | M | 0.8 | M |
| S.G.Halli | 40 µg/m3 | 0.62 | M | 0.44 | L | 0.45 | L | 0.32 | L | 0.64 | M | 0.76 | M | 0.6 | M | 0.6 | M | |
| Amco Batteries | 40 µg/m3 | 0.4 | L | 0.78 | M | 0.73 | M | 0.82 | M | 0.51 | M | 0.95 | M | 0.82 | M | 0.81 | M | |
| Moderate | City railway station | 40 µg/m3 | 2.05 | C | 0.74 | M | 0.58 | M | 0.57 | M | 1.14 | H | 1.15 | H | 1.3 | H | 0.98 | M |
Table 1: Analysis on the Air Quality Trend from 2011-2018
• ITPL (Industrial Belt)
• Yelahanka (Industrial Belt)
• Peenya (Industrial Belt)
• Yeshwanthpur (Residential Belt)
• S.G.Halli (Residential Belt)
• Amco Batteries (Moderate Belt)
• City Railway Station (Moderate Belt)
• Victoria Hospital (Sensitive Belt)
Also, the Central Pollution Control Board (CPCB) developed a formula known as the Exceedance Factor (EF) so that it is easy for everyone to understand the pollution level.
EF= Observed Annual Mean of Criteria Pollutants/Annual Standard For Respective Pollutant Therefore, Air Quality can be classified into the following:
• Critical Pollution (C): EF>1.5
• High Pollution (H): EF belongs to (1.0-1.5)
• Moderate Pollution (M): EF belongs to (0.5-1.0)
• Low Pollution (L): EF < (0.5-1.0)
Analysis of Air Quality Index
As for the health impact of air pollutants, AQI is an important indicator for general public to understand easily how bad or good the air quality is for their health and to assist in data interpretation for decision making processes related to pollution mitigation measures and environmental management. Basically, the AQI is defined as an index or rating scale for reporting daily combined effect of ambient air pollutants recorded in the monitoring sites [12]. As a result an equation, which transforms the parameter, values by means of numerical manipulation into a more simple and precise form can be obtained. The index of specific pollutant is derived mainly from the physical measurement of pollutants like SPM, RSPM, SO2 and NOx. There are several methods and equations used for determining the AQI. In the present study AQI for each location in the study area has been estimated with the help of a mathematical equation given below (Table 2).
| Sl. No | AQI Values | Levels of Health Concern |
|---|---|---|
| 1 | 0-50 | Good |
| 2 | 51-100 | Moderate |
| 3 | 101-150 | Detrimental For Sensitive Group |
| 4 | 151-200 | Unhealthy |
| 5 | 201-300 | Unhealthier |
| 6 | 301-500 | Hazardous |
Table 2: Levels of Health Concern
AQI=1/3({SO2/SSO2}+{NOX/SNOX}+{RSPM/SRSPM}}) × 100
Where,
• SO=Individual values of sulphur dioxide
• NOX=Individual values of oxides of nitrogen
• RSPM= Individual values of Respirable suspended particulate matter
and
• SSO, SNO and, SRSPM=Standards of ambient air quality of sulphur dioxide, oxides of nitrogen, suspended particulate matter (10).
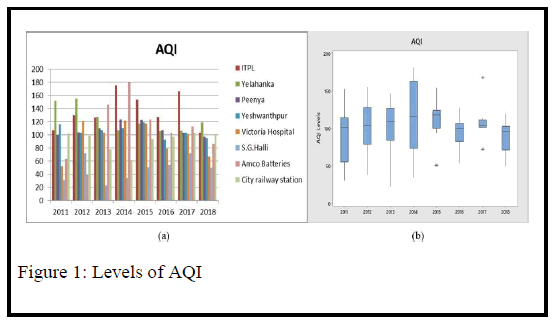
From Figure 1(a, b), It is evident that in ITPL (Industrial area) the AQI was around 110 in 2011 which has seen an increase until 2014, and after that the graph has been falling with an increase in the year 2017 due to BMRCL initiation of metro work in this area, this led to an increase in particulate matter due to the construction requirement at this site. In Yelahanka we can approximate a steady fall in the AQI over the years. This is mainly due to the changes in industrial regulations that have been adopted by the industries. Also, in Peenya we can observe a moderate AQI inspite of the industries because there is not much combustional processes taking place in this area.
In residential areas, Amco Batteries residential area had observed a consistent increase until 2014 after which there has been a steady fall until 2018. The same trend is noticed at S.G Halli, while Yeshwanthpur has not been noticed with any improvement over the trend it seems to fluctuate every year. In sensitive areas, like Victoria Hospital the trend seems to fluctuate but with improvement of air quality.
In moderate areas, like City Railway Station the trend has been fluctuating over the trend with not much improvement this is because of passengers who arrive at the railway station opt for various modes of transportation (i.e cabs, auto rickshaws, etc.), which increases in the combustion in this area.
Analysis of SO2
The sources of SO2 applicable to Bangalore are mainly due to the burning of fossil fuels and diesel exhaust, and the salient health effects attributable to it are known to be inflammation of the respiratory tract, dysfunction of lungs and irritation of the eyes. SO2 also causes health illnesses such as coughing, aggravation of asthma, chronic bronchitis and respiratory tract infections [13].
The permissible limits of SO2 in the industrial, residential and moderate areas is50μg/m3, while for the sensitive areas it is 20 μg/m3.
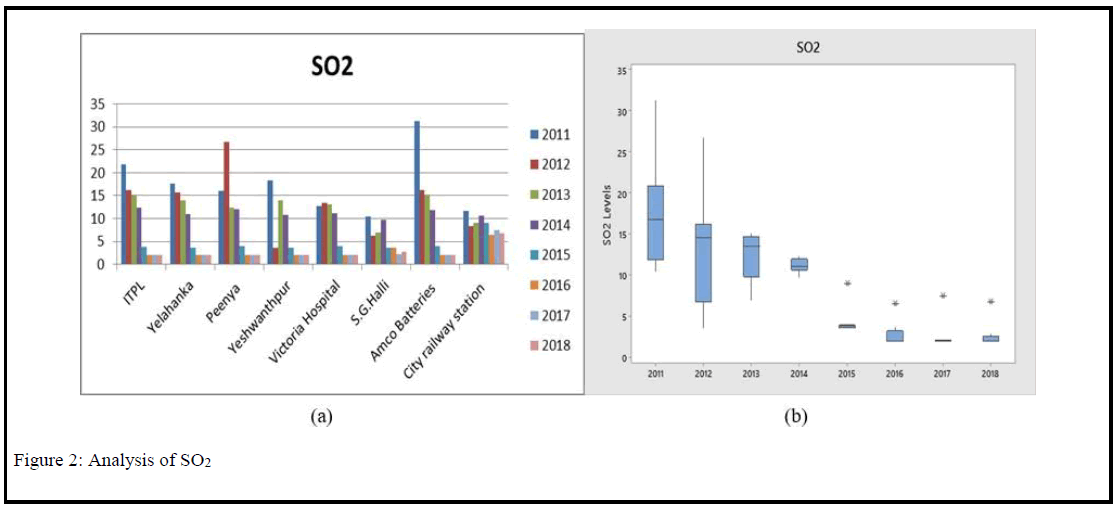
From the Figure 2, In the case of industrial areas, the levels at ITPL during 2011-12 has dropped by 25.6% followed by a 69% drop in the year 2014-15, although there was an increase in the levels by 66% at Peenya in the year 2011-12 it was followed by a subsequent drop in 2012-13 by 53%,while Yelahanka has had a drop of 10% in the year 2011-12 followed by a drastic fall in the year 2014-15 by 66%.There has been an overall reduction in the levels of SO2 at these industrial sites.
In the case of residential areas, the levels of SO2 at SG Halli had initially dropped by 40% in the year 2011-12 but subsequently there was equal increase in the following year, however, in the year 2014-15 the levels of SO2 had dropped by 62%. At Yeshwanthpur we observed an alternating level of SO2 every subsequent year. At Amco Batteries there was fall by 47% in the year 2011-12 followed by another drop in 2014-15 by 66%.
In the case of sensitive area, Victoria Hospital had observed a slight increase in the 2011-13, however it was followed by a drastic decrease of 64% in the year 2014-2015.
Overall, the downward trend in the level SO2 has substantially contributed well to the society in reducing the respiratory and child mortality rates in the city. The reason behind the downward trend could possibly be due to change in fuel types and its quality.
Analysis of NO2
Breathing air with a high concentration of NO2 can irritate airways in the human respiratory system. Such exposures over short periods can aggravate respiratory diseases, particularly asthma, leading to respiratory symptoms (such as coughing, wheezing or difficulty breathing), hospital admissions and visits to emergency rooms. Longer exposures to elevated concentrations of NO2 may contribute to the development of asthma and potentially increase susceptibility to respiratory infections. People with asthma, as well as children and the elderly are generally at greater risk for the health effects of NO2 [14]. The permissible levels of NO2 in Industrial and residential areas is 40μg/m3 and in sensitive areas is 20 μg/m3.
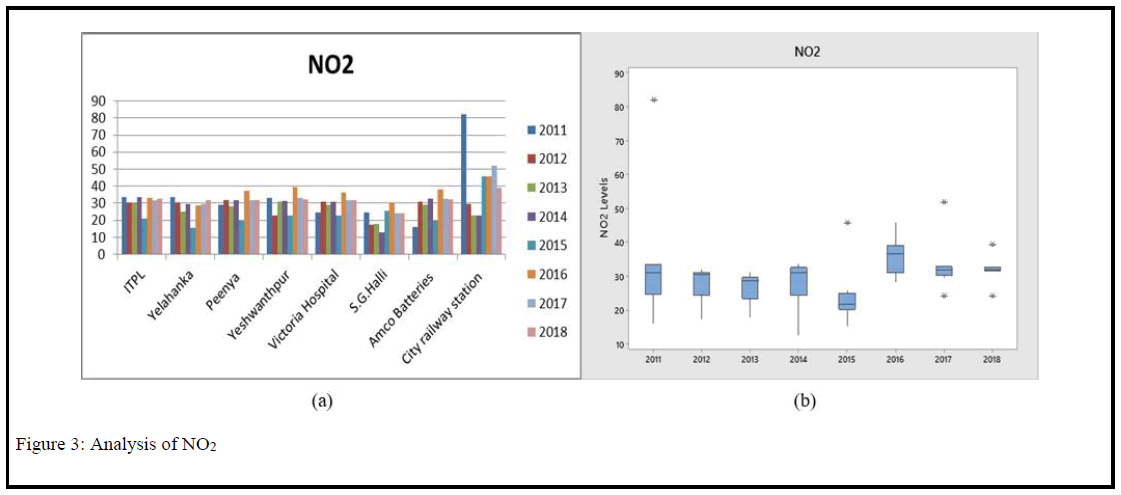
From the figure 3, In the case of Industrial areas, in the regions of ITPL the level of NO2 has dropped 8.3% in the year 2011-12 and increased by 11.6% in the year 2013-14 and interestingly the following there was drop by 37%. Surprisingly, such a pattern in the trend has been recorded at all Industrial sites (i.e. ITPL, Yelahanka and Peenya).These locations have overall faced a drop through the years 2011-13 followed by an increase during 2014-15 which was subsequently followed by a drop during the year 2015-16. These kinds of fluctuations have occurred at all industrial sites.
In the case of residential areas, a similar pattern is observed at the recorded residential sites (i.e. Yeshwanthpur, S.G.Halli, Amco batteries) , a fluctuation the levels of NO2 with a significant drop in the year 2015-16 followed by an increase in upcoming years, despite fluctuations in the levels of NO2 at different locations, they seems to be under the permissible limits.
In the case of sensitive areas, such as Victoria Hospital the levels of NO2 have crossed the permissible limits throughout the trend, this is mainly due to traffic congestion in this area, slow moving traffic causes higher rates of combustion produces considerable amounts of NO2 into the atmosphere.
In the case of moderate areas, such as City Railway Station the trend in the levels of NO2 is not predictable as there is no specific pattern being observed, but it does follow a similar trend with respect to the industrial and residential locations. There was significant decrease of 72% from 2011-14 followed by 50% increase in the year 2015.
Analysis of Respirable suspended particulate matter (RSPM)
Karnataka has seen dramatic shift in terms of air quality during the period 2011-2015. The PM10 has significantly increased over the years in certain locations due to use of old vehicles, possible fuel adulteration, re-suspension of dust due to increased traffic, absence of water spraying, emission from traffic jams, obstruction to movement of pollutants, use of DG sets during power cuts, low wind velocity and inversions during winter and nights. Increase in the number of high rise buildings is obstructing wind movement, thereby making pollutants almost stagnant in the city [15].
PM10 is thought to contribute to cardiovascular and cerebrovascular disease by the mechanisms of systemic inflammation, direct and indirect coagulation activation, and direct translocation into systemic circulation. Respiratory diseases are also exacerbated by exposure to PM. PM causes respiratory morbidity and mortality by creating oxidative stress and inflammation that leads to pulmonary anatomic and physiologic remodelling [16]. The standard permissible limits for all areas are 60 μg/m3.
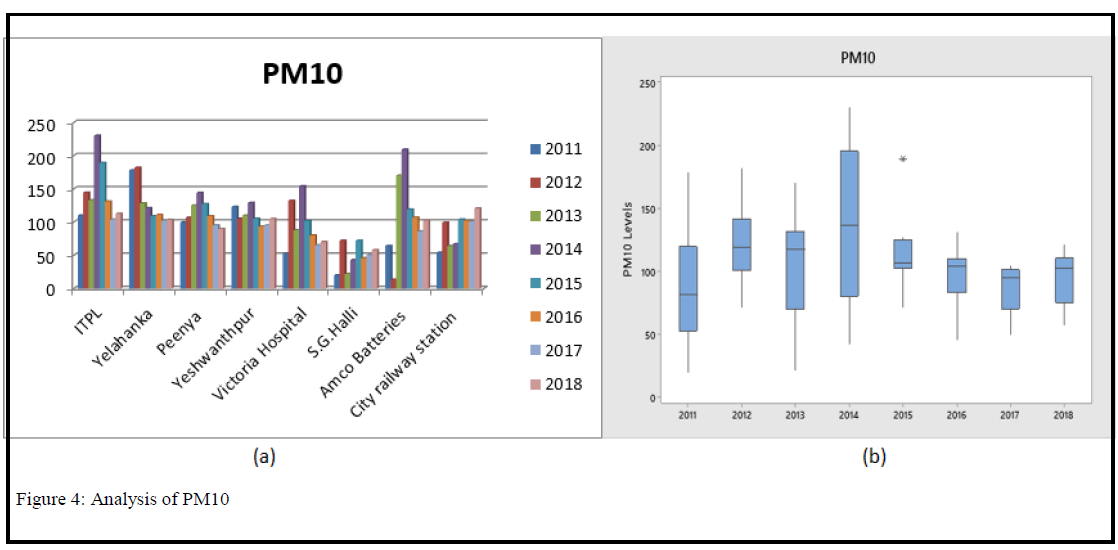
In the case of Industrial Areas, ITPL experienced a high peak of 230 μg/m3 due to the onset of BMRCL construction for the metro line leading to release of many small particles during construction and also the re-routing of roads caused slow moving traffic, hence, increasing the particulate matter in the year 2014. But, following this year we can observe a significant drop in the levels of particulate matter (PM10) in this area, which shows a good sign awareness. Overall, the average RSPM concentration exceeds by 2.4 times the permissible limits. In Yelahanka, there is a significant decrease throughout the trend, even then they exceed the permissible limits by 2.15 times. In Peenya, a bell shaped curve is being observed with its peak during 2014 after which there is a consistent fall in the level of RSPM concentration.
From the figure 4, in the case of residential areas, Yeshwanthpur does not follow any particular trend the levels of particulate matter has been fluctuating throughout, also on an average the level of RSPM seems to be 1.8 times higher than the standard permissible limits, in the same way Amco Batteries also observes a fluctuating trend throughout the analysis, and also on an average the level of RSPM seems to be 2 times higher than the permissible limits. Fortunately, in S.G.Halli the levels of RSPM seem to be under control throughout the analysis.
In the case of sensitive areas, Victoria Hospital had been adversely affected in the year 2012 and 2014 with an unexpected rise in the levels of RSPM by 150% in the year 2012 and 75% in the year 2014 ,fortunately , from 2015 the levels have been dropping drastically and is in the standard control limits.
In the case of moderate areas, City Railway Station has been adversely affected by the levels of RSPM which seems to be having an upward trend throughout the analysis with an average increase of 20% every year.
Recent studies clearly suggest that current standards for PM may not be protecting general public and children, the standards should be revised. The health effects of PM are well documented, but there is no evidence of a safe level of exposure for which no adverse health effects occur. Monitoring of air pollution needs to be improved in many cities, the local authorities should develop dose response models on public health, which can be used to predict health of public. Particulate air pollution can be reduced using advanced technologies, stricter air quality standards, limits for emissions from various sources, reducing energy consumption, changing modes of transport, land use planning, using cleaner modes of transport [17].
Analysis of correlation matrix
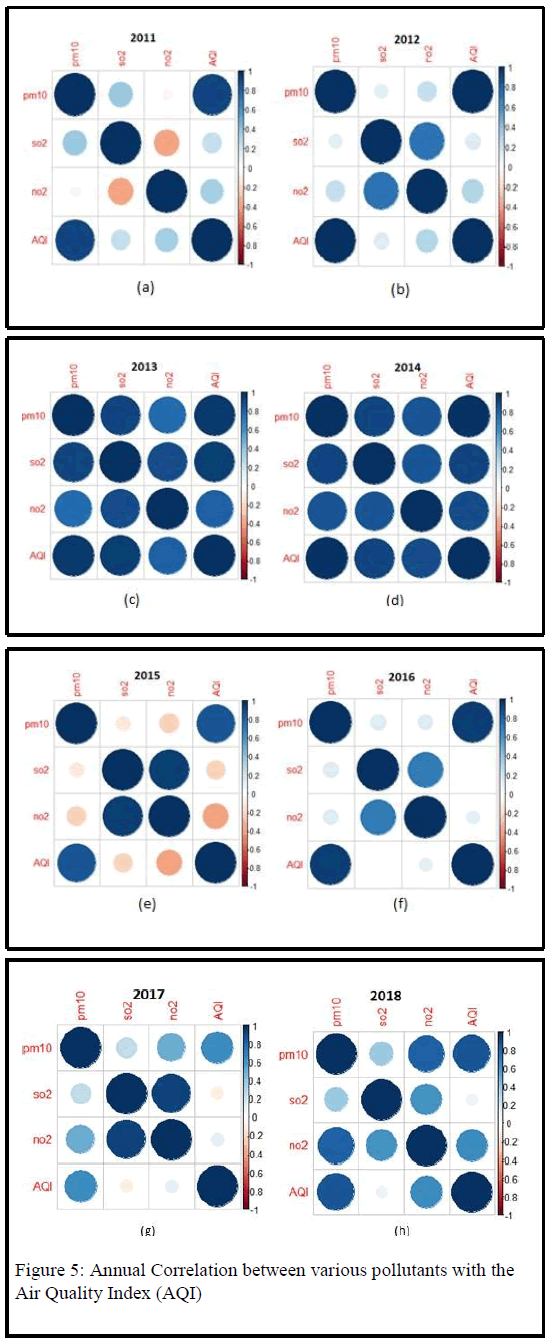
By obtaining the correlation matrix between the Air Quality Index (AQI) and the various pollutants (Figure 5), there is a benefit of evidence to observe the correlation picturesquely. On the basis of this matrix we can observe that, in 2011, there is a positive correlation between AQI and PM10 which is greater than both the other combinations( AQI Vs. SO2 & AQI Vs. NO2).This trend is being observed throughout the analysis from 2011-18, which concludes that the highest influence on AQI is caused due to PM10. By calculating the Exceedance Factor (EF) for PM10, 70% of the trend has an EF>1.5 which means these areas are critically polluted by particulate matter PM10. OC, EC, Sulphate, ammonium, K, V, Ni, Cu, Zn, Pb, As, Cd and Se are mainly in PM2.5 fraction of particles, while chloride, nitrate, Na, Mg, Al, Fe, Ca, Ti and Mn are mainly in PM2.5-10 fraction. The major components such as sulphate, OC and EC account for about 70-90% of the particulate mass. Enrichment factors (EF) for elements are calculated to indicate that elements of anthropogenic origins (Zn, Pb, As, Se, V, Ni, Cu and Cd) are highly enriched with respect to crustal composition (Al, Fe, Ca, Ti and Mn).
Analysis of SO2 vs. NO2 vs. PM10
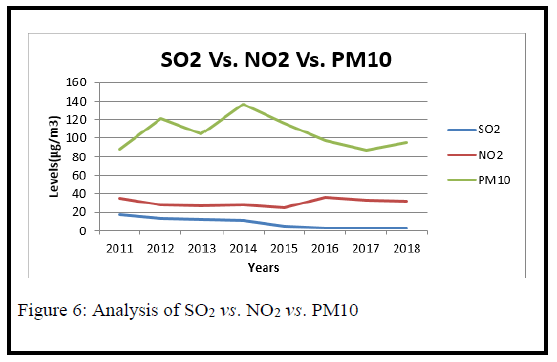
By obtaining this graph (Figure 6), we can conclude with evidence that the particulate matter (PM10) in Bangalore has been over the standard limits at an alarming rate. While, SO2 and NO2 are within the standard limits causing not much harm to the environment around us. The gaseous component NO2 has been almost constant after 2015, but it is in control. Furthermore, the gaseous component SO2 been steadily decreasing since 2015, which is a very good sign for the environment in Bangalore.
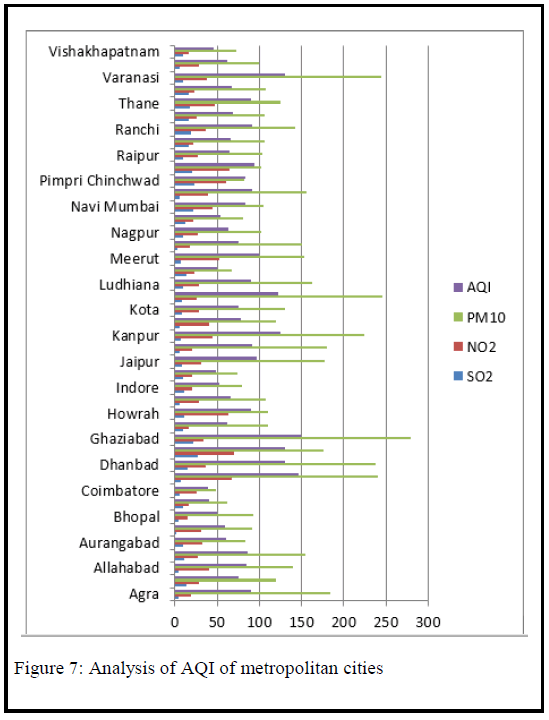
In all the metropolitan cities and popular tourist locations the particulate matter is out of control (Figure 7). In metropolitan cities these levels are out of control due to increasing population because the evolution the IT world in metro cities, which leads to increasing number of vehicles in turn leading traffic congestion. At tourist locations, the increase in particulate could be due to various factors, such as tourist vehicles, and also for example, at Varanasi the rituals include a lot of burning adding dust significantly into the atmosphere which increases the amount of particulate matter. In the year 2018, there has been a report that the number of vehicles in Bangalore has crossed 80 Lakhs; by this number we can estimate the amount of unprecedented emission into the air that is going to pollute the air up to a great extent. As the excerpt from the article says that “Transport is the main contributor of air pollutants in Bengaluru”.
While the projected rate of population increase may be reduced, even moderate population growth is likely to lead to substantial increases due to passenger and freight travel demand in the city, due to introduction of Metro, Monorail, BRTS, fuel price etc. The increasing geographic dispersion of metropolitan population is also likely to increase aggregate transportation demand, since the greater number of trips will also be longer and public transport will be less efficient and universal [18]. Bengaluru being the third most populous city in the country is a platform for a lot of technological start-ups and IT hubs. Bengaluru hosts many leading Biotechnology companies, with immense importance and support to its research and development fields. With 40% of India’s IT industry located in Bangalore, the city is among the most favoured destination for IT and other knowledge-based industries. The city’s IT and related services account for about 55% of Karnataka’s state gross domestic product.
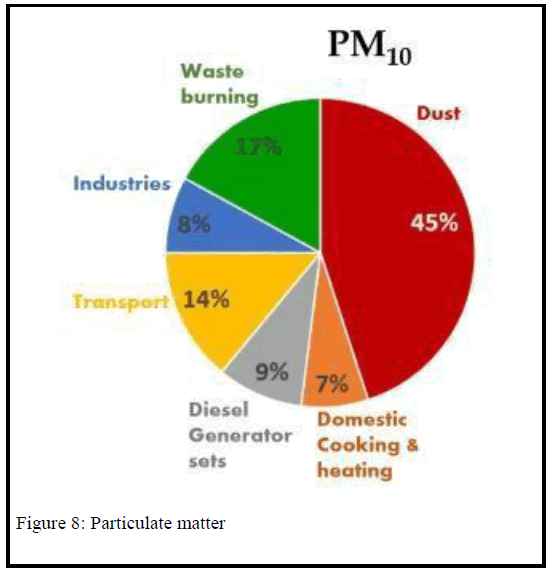
By evaluating all the analysis done by various other researchers, RSPM contributes the most to the air pollution in Bangalore. In the recent past all the other gaseous components seems to be under control except for the levels of RSPM (Figure 8).
Conclusion
Throughout, we are able to analyse that the levels of RSPM (Figure 8) are proving to be hazardous to our environment. By WHO, the main contributors to this component is reported to be is dust, waste burning, transport, Diesel Generator sets, Industries, domestic cooking and heating. The standard limit of RSPM is 60μg/m3, and in most of the recorded sites this component in manifolds higher that the standard limit. Hence, through this paper we can draw conclusions that there should be adequate amount of awareness being spread amongst the contributors making them aware of the hazards being posed by this component.
References
- Ramanathan VC, Kiehl JT, Crutzen PJ, Rosenfeld D (2001) Aerosols, climate, and the hydrological cycle. Science, 294(5549):2219-2224.
- Wang PW, Zhang X, Ren X, Shi Y, Bi JS, et al., (2015) Size Distribution and Optical Properties of Particulate Matter (PM10) and Black Carbon (BC) during Dust Storms and Local Air Pollution Events across a Loess Plateau Site. Aerosol Air Qual Res, 15:2212-2224.
- Sudhira HS, Gururaja KV (2012) Population crunch in India: Is it urban or still rural? Cur Science, 103:1.
- Sudhira HS, Ramachandra TV, Balasubrahmanya MH (2007) City profile Bangalore. Cities, 24(5):379-90.
- Thakur A (2017) Study of ambient air quality trends and analysis of contributing factors in Bengaluru, India. Orient J Chem, 33:2.
- Kessler R (2005) Death by Particles: The Link between Air Pollution and Fatal Coronary Heart Disease in Women. Environ Health Perspect, 113(12):A836–A837.
- Zhou CJ, Wang C, Shijie LS (2018) Impacts of energy consumption structure, energy intensity, economic growth, urbanization on PM2.5 concentrations in countries globally. Appl Energ, 230:94-105.
- Sarkodie SA, Strezov V (2018) Assessment of contribution of Australia's energy production to CO2 emissions and environmental degradation using statistical dynamic approach. Sci Total Environ, 639:888-899.
- Sarkodie SA, Vladimir S, Jiang Y, Evans T (2019) Proximate determinants of particulate matter (PM2.5) emission, mortality and life expectancy in Europe, Central Asia, Australia, Canada and the US. Sci Total Environ. 683:489-497.
- Pant P, Guttikunda SK, Peltier RK (2016) Exposure to particulate matter in India: A synthesis of findings and future directions. Environ Res. 147:480-496.
- Kamath, Lokeshappa (2014) Air Quality Indexing For Selected Areas in Bangalore City, Karnataka State. Int J Innov Res Sci Eng Technol, 3(8):15625-15630.
- Sindhwani R, Goyal P (2014) Assessment of traffic-generated gaseous and particulate matter emissions and trends over Delhi (2000–2010) Atmos Pollut Res Vol, 5(3):438-446.
- Steenhof M1, Janssen NA, Strak M, Hoek G, Gosens I, et al. (2014) Air pollution exposure affects circulating white blood cell counts in healthy subjects: the role of particle composition, oxidative potential and gaseous pollutants – the RAPTES project. Inhal Toxicol, 26(3):141-165.
- Gopinath, R. and Balasubramanya, N. (2017) Historical trend of ambient air quality indices at key observatories for major cities in Karnataka, India. Vestnik VolGMU, 49(68):189-195.
- Anderson JO, Thundiyil JG, Stolbach A (2012) Clearing the air: a review of the effects of particulate matter air pollution on human health. J Med Toxicol, 8(2):166-75.
- Hosamane SN, Desai GP (2014) Assessment Of Air Quality In Major Cities Of Karnataka State And Effects On Public Health. Int J Adv Res Sci Eng. 3(1):306-315.
- Harish M (2012) A Study On Air Pollution by Automobiles In Bangalore City Management Research And Practice. Environ Sci, 4(3):25-36.
Citation: Sunil, Reddy J, Thomas M, Mishra N (2020) Analysis of Air Quality in Bengaluru city, India. Environ Pollut Climate Change 4: 175. DOI: 10.4172/2573-458X.1000175
Copyright: © 2020 Mishra N. This is an open-access article distributed under the terms of the Creative Commons Attribution License, which permits unrestricted use, distribution, and reproduction in any medium, provided the original author and source are credited.
Select your language of interest to view the total content in your interested language
Share This Article
Recommended Journals
Open Access Journals
Article Tools
Article Usage
- Total views: 8642
- [From(publication date): 0-2020 - Dec 02, 2025]
- Breakdown by view type
- HTML page views: 7566
- PDF downloads: 1076

