Research Article Open Access
AMMI Analysis of Tuber Yield of Potato Genotypes Grown in Bale, Southeastern Ethiopia
| Miheretu Fufa* | ||
| Oromia Agricultural Reswearch Institute, Sinana Agricultural Research Center; Horticulture and Spice Technology Generation Team, Ethiopia | ||
| Corresponding Author : | Miheretu Fufa Oromia Agricultural Research Institute Sinana Agricultural Research Center Horticulture and Spice Technology Generation Team PO. Box 208, Bale Robe, Ethiopia Tel: 251116187346 E-mail: miheretufufag@gmail.com |
|
| Received August 19, 2013; Accepted November 22, 2013; Published December 06, 2013 | ||
| Citation: Fufa M (2013) AMMI Analysis of Tuber Yield of Potato Genotypes Grown in Bale, Southeastern Ethiopia. Adv Crop Sci Tech 1:120. doi: 10.4172/2329-8863.1000120 | ||
| Copyright: © 2013 Fufa M. This is an open-access article distributed under the terms of the Creative Commons Attribution License, which permits unrestricted use, distribution, and reproduction in any medium, provided the original author and source are credited. | ||
Related article at Pubmed Pubmed  Scholar Google Scholar Google |
||
| Visit for more related articles at | ||
Visit for more related articles at Advances in Crop Science and Technology
Abstract
The problem of genotype by environment interactions that often complicates the interpretation of multi-locations trail analysis making the prediction of genotype performance difficult can be eased with the adoption of the Additive Main Effects and Multiplication Interaction (AMMI) model analysis. The AMMI model was used to evaluate tuber yield stability of twelve potato (Solanum tuberosum L.) genotypes in randomized complete block design with three replications at Sinana, Shallo and Dinsho during 2009, 2010 and 2011.
The objectives were to estimate the nature and magnitude of GEI for tuber yield and to identify stable potato genotypes for general adaptation and unstable genotypes for specific adaptation. Combined analysis of variance showed highly significant difference between the genotypes, locations and GEI. Proportion of variation captured by genotypes, locations and GEI is 13.65, 51.64 and 34.81, respectively indicating more effects of locations as compared to genotypes.
| Keywords | |
| Potato (Solanumtuberosum L.), belonging to the family Solanaceae, is an important food and cash crop ranking fourth after maize, wheat and rice annual production in the world [1,2]. It is the world’s number one none-grain crop to ensure food security due to its growing demand [3]. It is a high biological value crop that gives an exceptionally high yield with more nutritious content per unit area per unit time than any other major crops. Thus, it can play a remarkable role in human diet as a supplement to other food crops such as wheat and rice [4]. Furthermore, the contribution of potato to the diversification of the cereal mono-cropping in Bale is great. | |
| Despite the importance of potato in the country agriculture, its productivity has shown a decreasing trend even if its production is expanding steadily [5,6]. One of the major factors contributing to reduction in yield of potato is inadequacy of improved cultivars with wide adaptability and stability in tuber yield. Thus, evaluating genotypes across various environments for their stability of performance and range of adaptation is crucial and is an important component of the research activity of the national as well as regional research program. | |
| Evaluating genotypes over diverse environments is universal practice to ensure the stability of performance of the genotypes [7]. Stability in performance is one of the most desirable properties of a genotype to be released as a variety for wide cultivation [8]. However, the activity of identification, selection and recommendation of superior genotypes is complicated and severely limited by genotype × environment interaction that is inevitable in multi-environmental trails [9-13]. The presence of genotype x environment interaction may confound the genotypic performance with environmental effects [14]. | |
| Several statistical models and procedures have been developed and exploited for studying the genotype x environment interaction effects, stability of genotypes and their relationships in varietal development process [9,11,15]. A combined analysis of variance (ANOVA) can quantify the interactions, and describe the main effects. However, it is uninformative for explaining genotype x environment interaction. To increase accuracy, additive main effects and multiplicative interaction (AMMI) is the model of first choice when main effects and interaction are both important [13]. It is a powerful tool for effective analysis and interpretation of multi-environment data structure in breeding programs and is useful for understanding genotype x environment interaction [7,9]. Plant breeders frequently apply AMMI model for explaining genotype x environment interaction and analyzing the performance of genotypes and test environments [16,17]. Therefore, this paper assesses genotype x environment interaction and tuber yield stability of potato genotypes under Bale highlands, Southeastern Ethiopia. | |
| Materials and Methods | |
| In this experiment, twelve genotypes of potato were evaluated in randomized complete block design with three replications at Sinana, Shallo and Dinsho during 2009, 2010 and 2011. The plot area used was 3m x 3m with the spacing of 30 cm within rows and 75 cm between rows respectively. The sample data were recorded from the two middle rows. All agronomic and cultural practices were followed as per the general recommendation. No attempt was made to control the late blight with fungicide. At physiological maturity, the tubers were harvested from two middle rows and washed with clean tap water to remove soils. The clean tubers were sorted and graded into large, medium and small based on their size. The weight of the tubers per plot (kg) was recorded and their mean was subjected to analysis. | |
| Statistical analysis | |
| Analysis of variance (ANOVA) was carried out on tuber mean on plot basis and pooled over locations and seasons using the Generalized Linear Model (GLM) procedures of the Statistical Analysis System (SAS) version, 9.1.3 [18]. The Additive Main Effects and Multiplicative Interactions (AMMI) statistical model was produced using Irristat software [19] to analyze the yield data and to produce biplot that shows both main and interaction effects for both genotypes and environments. | |
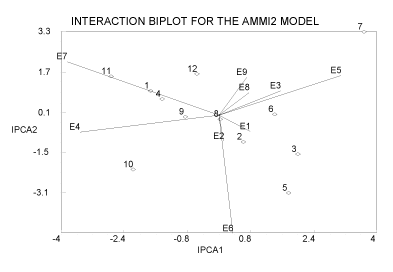
| Furthermore, AMMI’s stability value (ASV) was calculated in order to rank genotypes in terms of stability using the formula suggested by Purchase (1997) as shown below: where, SS = Sum of squares; IPCA1 = interaction principal component analysis axis 1and IPCA2 = interaction principal component analysis axis 2 (Figure 2). | |
| Results and Discussion | |
| Combined analysis of variance showed that there was a highly significant difference (p<0.01) among the genotypes for their tuber yield indicating that there is fluctuation of genotypes in their response to the different environments. Because of the highly significant difference existing in tuber yield among the genotypes, the AMMI analysis was used to estimate the highest stable genotypes. The majority of the total variation was accounted for by location (27.60%) while that of genotype is only 9.56%. This variability may be due to the variability of soil and rainfall across locations. | |
| The AMMI analysis of variance showed that all the components were highly significant (Table 1). The environment had the greatest effect and accounted for 51.94% of the total sum squares; genotypes accounted for 13.65% and GXEI had accounted for 34.41% which is the next highest contribution. A large sum of squares for environments indicates that the environments were diverse, with large difference among environmental means causing most of the variation in tuber yield. The variation in soil moisture across the different environment was considered as the major underlying causal factor for the GXE interaction. The magnitude of the GEI sum of squares was 2.52 times larger than that for genotypes, indicating that there were substantial differences in genotype response across environments. Results from AMMI analysis (Table 1) also showed that the first principal component axis (PCA 1) of the interaction captured 38.94% of the interaction sum of squares. Similarly, the second principal component axis (PCA 2) explained a further 27.75% of the GEI sum of squares. Furthermore, PCA 1 and PCA 2 had sum squares greater than that of genotypes. | |
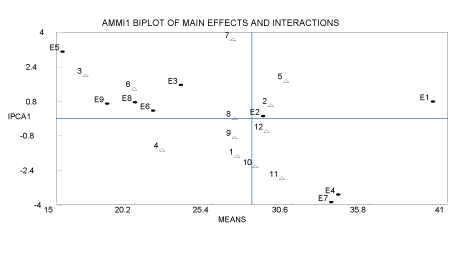
| The mean squares for the PCA1 and PCA 2 were significant at p=0.01 and cumulatively contributed to 66.69% of the total GEI. Both the IPCA 1 and IPCA 2 scores revealed that genotype 8 was the most stable genotype. Similarly, the calculated ASV indicated that genotype is the only stable genotype while others showed considerable interaction with the environments (Table 1). So, genotype 8 showed negligible interaction and is found to be the most stable genotype showing broad adaptation across environments. The rest genotypes showing considerable interaction with the environments were highly interactive and were highly unstable across environments. According to SVA calculated, the most unstable genotype is 7 followed by 11, 5, 10 and 3. The underlying causes of the interaction observed can therefore be based on both the genetic differences between these genotypes. Except the local check, which gave the lowest tuber yield, most of the unstable genotypes had the best performance in their tuber yield. The AMMI biplot provides a visual expression of the relationships between the first interaction principal component axis (IPCA1) and means of genotypes and environments (Figure 1) with the biplot accounting for up to 78.99% of the total sum of squares. Genotype, Environment and PCA 1 respectively accounted for 13.65%, 51.94% and 13.39% of the total sum of squares. Genotypes 7, 11, 10 and 5 were the highest yielding but most unstable genotypes. Genotype 3 was the low yield unstable genotype. | |
| In conclusion, the AMMI analysis showed the presence of Genotype X Environment interactions among the 12 potato genotypes. Genotype 2 was found to be the most stable high yielding genotype. It is found useful to use other stability parameters in assessing the stability of potato (Solanumtuberosum L.) genotypes under the studied environments of South East Ethiopia. Although AMMI was found to be more informative in depicting the adaptive response of the genotypes [20-22], the joint regression analysis also remains a good option (Table 2). | |
| Acknowledgement | |
| My special thanks go Oromia Agricultural Research Institute for funding this experiment. I also express my gratitude to GutaLeggesse, MulugetaGadif and Adam Abdulhamid for data collection and compilation. | |
| References | |
References
|
|
Tables and Figures at a glance
| Table 1 | Table 2 |
Figures at a glance
 |
 |
|
| Figure 1 | Figure 2 |
Relevant Topics
- Agricultural science
- Agronomy
- Climate impact on crops
- Crop Productivity
- Crop Sciences
- Crop Technology
- Field Crops Research
- Hybrid Seed Technology
- Irrigation Technology
- Organic Cover Crops
- Organic Crops
- Pest Management
- Plant Genetics
- Plant Breeding
- Plant Nutrition
- Seed Production
- Seed Science and Technology
- Soil Fertility
- Weed Control
Recommended Journals
Article Tools
Article Usage
- Total views: 14748
- [From(publication date):
February-2014 - Apr 27, 2025] - Breakdown by view type
- HTML page views : 10054
- PDF downloads : 4694
