Age-Related Expression of Beta-Synuclein in the Ascending Visual Pathway and Comparative Analysis of its Function within the Neuroretina and Cerebral Cortex In-vitro
Received: 06-Feb-2018 / Accepted Date: 22-Feb-2018 / Published Date: 28-Feb-2018 DOI: 10.4172/2161-0460.1000427
Abstract
Objective: Aging hampers visual function in a multifactorial manner and the underlying perceptual deficits cannot be explained by anatomical alterations of the eye and/or visual cortex alone. The aging process of structures of the Ascending Visual Pathway (AVP) between neuroretina and visual cortex is rarely studied. The age-related increase of Beta-Synuclein (SNCB) was detected in both the neuroretina and the visual cortex (V1) in different species. SNCB acts as a physiological antagonist to neurodegenerative disease -associated alpha-synuclein. The aim of the work was to explore expression patterns of SNCB within different parts of the AVP. Further, the role of SNCB in different targeted neuronal tissues was studied.
Methods: The expressions of SNCB were compared in the newborn, juvenile, adult, and aged Optic Chiasm (OC), Tracuts Opticus (TO), Laterale Geniculate Nucleus (LGN), and superior colliculus (LGN) of rats. Western blot (WB), quantitative reverse-transcription polymerase chain reaction (qRT-PCR), and immunohistochemistry (IHC) analyses were employed to determine whether the changes identified by proteomics were verifiable at the cellular and molecular levels. To investigate the properties of SNCB in neuronal and glial cells, rat retinal and cortical samples (P5-7) were prepared and exposed to different SNCB concentrations up to 72 h in-vitro. The suspected influence on the expression on neuronal cells (e.g., beta III tubulin) and glial cell (e.g., glial fibrillary acidic protein) as well as apoptosis markers (e.g., TUNEL) was assessed by IHC, WB, and qRT-PCR. In addition, the p53-MDM2 signalling pathway was studied by IHC.
Results: An increase of SNCB expression was detected in all examined regions of the AVP. Main differences of SNCB expression regarding to associated cell types were found in OC and TO in comparison to LGN and SC. The detected protein alterations in OC and TO were analogous to recent reports of the retinal profiles, while the SNCB expression characteristics in LGN and SC were more comparable to the characteristics within cortical tissues. Differences in response to SCNB exposure were found between retinal and cortical cells in-vitro. A loss of neuronal cells together with an increased apoptosis has been found in retinal cultures. In contrast, cortical cells show a beneficial elevation of neuronal response after SNCB exposure. While SNCB-exposed neuroretina show an activation of the p53-MDM-2 signaling, a decreased activation of p53-MDM-2 singanling pathway in cortical cells has been found. Conclusions: This study is the first to provide evidence that SNCB expression is associated with postnatal maturation and aging in the AVP of rats. Moreover, SNCB may exert different effects on several cell subtypes within selected neuronal targets like neuroretina and cortex. The findings may indicate the role of SNCB in key functional pathways and may account for the onset and/or progression of age-related pathologies. Further studies are needed to derive an increased understanding of neurodegenerative diseases of the retina and the cortex.
Keywords: Aging; Ascending visual pathway; Laterale geniculate nucleus; Synculeins; Retina; Cortex; Apoptosis
Introduction
The visual system reveals some peculiarities in the context of the cerebral nervous system: (1) the long distance from the retina to the visual cortex, (2) major components (e.g., neuroretina and visual cortex) share parts of the embryonic development and (3) the sections are distinct subjected to anatomical conditions [1,2]. An impairment of visual function occurs during life time due to physiological alterations in the visual system, while its modalities can be selectively associated with the underlying anatomical structures. Age-related morphological changes in the eye are accompanied by changes in vision-associated qualities, including visual acuity, perception of contrast and wavelength, and impairment of binocular capabilities [3-8]. These are at least partly the result of decline in optical transmission and multiple retinal and cortical changes during aging. Unless morphological changes cannot to be addresses within the visual cortex, age-related alterations of perceptual modalities may reflect loss of structure forming the projection from retina to the cortex [9]. Recent visual evoked-potential studies (e.g., in humans) presume visual changes in parts of the ascending visual pathway (AVP) are to be assumed in order to explain age-related decline in the visual function [10-13]. However, reported differences presume the occurrence of age-related changes in several parts of the AVP.
Recent studies report about an approximately a 40% total decline in axon number in the human optic nerve and associated structures like the optic chiasm (OC) with aging. In rats this decline is not related to changes of the number of RGC bodies [14-16]. The size and complexity of RGC axonal arbors in the mouse SC also diminish with age [17]. Moreover, only little effects of aging on neurons in the lateral geniculate nucleus (LGN) and their retinal inputs has been found [18]. The loss of structural volume within the LGN in humans differs between 15 - 30% [19,20]. In rodents and non-human primates, the number of neurons in the LGN remained stable unless the volume increases within aging [18,20,21].
Those findings indicate that the relevant neuronal abnormalities relating to visual impairment during aging occur more centrally as in the AVP. It is important to assume, that the associated function of central parts of the visual pathway differs between rodents and humans. The LGN of humans receive the primary axons of the RGCs and relay to the visual cortex. In contrast, this function fulfils the midbrained SC in rodents, while the LGN projection is smaller [9]. Thus, support the need to study functional, morphological as well as molecular alterations in the aging AVP [18]. The discussed mechanisms related to neuronal aging like inflammation properties may also counteract the visual system including the retina [22,23]. However, the exact underlying mechanisms under consideration of molecular biological changes within the visual system need more detailed studies and investigations.
Parts of the visual system like retina and brain are affected by a variety of aging-related diseases, such as glaucoma, age-related macular degeneration, diabetic retinopathy, Alzheimer’s disease, and Parkinson’s disease [22,24,25]. To understand how these diseases affect the visual system and visual behaviour, it promotes the need for studying effects of normal aging.
In previous works, comparable elevation of proteins expression patterns, like SNCB has been identified in both the retina and visual cortex of aging rodents (Ref). This indicates similarities in during life time and the ongoing aging process in different neuronal tissues as conceivable. SNCB as member of the cytoplasmic synuclein family elicit neuroprotective functions in several neuronal tissues [26-30].
The presented study aimed two different aspects concerning the expression characteristics of SNCB within the ascending visual pathway as well as the functional role of SNCB within major parts of the visual system, the neuroretina and visual cortex.
First, the expression patterns of SNCB within both the neuroretina and visual cortex have been recently described [31,32]. Aim of the study was to explore expression and differential expression patterns of SNCB within the anterior (representing the 3rd neuron) and posterior (representing high ordered neuronal and cortical) part of the AVP of rats. The selection of major parts of the AVP includes the optic chiams, tractus opticus, LGN as well as SC to close the “gap” within the visual system between the previously described sections of the neuroretina and visual cortex.
Further, the role of SCNB in the visual information processing parts of visual system is not well known. Major parts of the visual system contain the neuroretina as representing the anterior visual pathway and the visual cortex representing the posterior visual pathway, respectively. Thus promote the need to study those major parts in a comparative manner to reveal the potential role of SNCB within the visual system. Thus justify the studying of the the function of SNCB in different targeted neuronal tissue, and to elucidate basic cellular functions of neuroretina and cortex exposed to SNCB in-vitro. The underlying goal to determine age-related changes within in neuronal tissues may be note giving to understand the shift of physiological aging process to age-related diseases.
Material and Methods
Animals and drugs
All experiments were conducted in strict accordance with the ARVO Statement for the Use of Animals in Ophthalmic and Vision Research. Sprague-Dawley rats were housed in standard animal rooms under a 12- /12-h light/dark cycle, with food and water provided ad libitum. In total, 96) rats were used. For studying the AVP, the selected animals covered the following ages: postnatal day (P0) (i.e., the day of birth) (n=24 animals), the young- adult stage (adolescence) 6 months after birth (6 m) (n=12 animals), middle-age 12 and 18 months after birth (12 m and 18 m, respectively) (n=12 animals for each group), and aged (elderly) 30 months after birth (30 m) (n=12 animals). The in-vitro experiments were conducted with 24 female Sprague-Dawley rats aged 5-9 days. The ethics committee (LANUV, Regional government of North-Rhine/Westfalia, Germany) approved this study (Permission No.: 8- 87-50.10.46.09.018 8-87-50.10.36.09.068, and 84- 02.05.20.13.128).
Brain preparation for studies of the ascending visual pathway
Protein and RNA extraction were achieved following microdissection of the selected cerebral regions according to Palkovits [33]. In brief, the animals were euthanized and the brain was removed from the skull and rinsed in ice-cold diethylpyrocarbonate-treated Milli-Q water to remove any surface blood. The brain was then placed onto a cold metal plate for further preparation and sample isolation. The areas of interest contain OC, LGN, and superior colliculus and were separated as following: Details of the dissection of selected thalami nuclei have been recently described [33,34]. In brief, optic chiams were removed from the bottom of the brain beneath the hypothalamus macroscopically. Samples of the paraventricular thalamic nucleus were removed from the rostral sections. The LGN is part of the lateral thalamic nucleus and contains the dorsal LGN (lateral posterior thalamic nuclei, respectively) and the ventral LGN (ventrolateral thalamic nuclei, respectively). The SC can be macroscopically identified and dissected with a small knife. However, the five layers cannot be separated without staining. Though no distinguish between the 5 layers was possible [33]. Tissue of LGN and SC from two-three animals was pooled into one sample for protein and mRNA level analysis. The selected region was flash frozen in liquid nitrogen and stored at –80°C until use.
Retina and brain preparation for in vitro experiments
Primary cultures of rat dissociated cortex and retinae were prepared from 5-9-day-old Sprague-Dawley rats. Rats were sacrificed and the eyecups were removed and placed in Hank’s balanced salt solution, in which all subsequent preparation steps were conducted under sterile conditions. The retina was dissected and isolated, flat-mounted on a nitrocellulose filter, and separated from the vitreous with fine forceps. Retinae from 5-9-day-old Sprague-Dawley rats were isolated. 1 ml DPBS including 0.1% DNase (Roche, Mannheim, Germany), 0.1% Collagenase A (Roche, Mannheim, Germany) and 0.02% Trypsin/ EDTA was added to the retina. The tissue was triturated with a 1mlpipett for at least 10 times, followed by a trituration with a 100 μl-pipette for at least 10 times. The suspension was incubated at 37 °C for 30 min, followed by a trituration as described above. The suspension was centrifuged at 2000×g for 3 min. The supernatant was removed, 1 ml of DPBS was added followed by two additional steps of trituration and centrifugation as described. The cells were re-suspended in Dulbecco’s Modified Eagle Medium (DMEM)/F12 (Sigma-Aldrich) supplemented with 20% fetal calf serum (FCS), 3.57 mg/mL HEPES (Sigma-Aldrich) and 100 U/mL penicillin/streptomycin (Sigma-Aldrich). The cells were pre-cultured in cell culture dishes for one hour to remove fibroblasts from the culture. The supernatant was transferred to a petriperm dishes and cells were cultured at 37°C in a 5% CO2 humidified atmosphere.
For cortical cell cultures, the skulls were removed and sterilized by incubation in betaisodona (Mundipharma, Limburg, Germany), the frontal and parietal bones were removed, the cerebellum was extracted, and the cerebellum and non-cerebrum structures were removed. All procedures were carried out under aseptic conditions. Briefly, cortices were isolated, the surface vessels and meninges removed, and the cortex grey matter was minced and incubated for 25 min at 35°C in Dulbecco’s phosphate-buffered saline (DPBS; Sigma-Aldrich, Hamburg, Germany) containing 0.05% trypsin (Sigma-Aldrich). Following the centrifugation for 5 min at 800×g, the pellet was resuspended in DPBS containing 20% bovine serum albumin (BSA; Sigma-Aldrich). Further centrifugation at 2000 ×g for 5 min was used to remove cell debris, myelin, and fat. The remaining cell pellet containing microvessels was digested with 0.1% collagenase A (Roche, Mannheim, Germany) for 30 min at 37°C, washed twice with DPBS, and resuspended in Dulbecco’s Modified Eagle Medium (DMEM)/F12 (Sigma-Aldrich) supplemented with 20% fetal calf serum (FCS), 3.57 mg/mL HEPES (Sigma-Aldrich) and 100 U/mL penicillin/streptomycin (Sigma-Aldrich). Cells were cultivated on petriperm dishes cell culture ware at 37°C in a 5% CO2 humidified atmosphere.
Exposure of retinal and cortical cells to rSncb
Both retinal as well as cortical cells were incubated with rSncb (rat; Prospec, East Brunswick, NJ, USA) in increasing concentration (1 ng/ mL, 50 ng/mL, and 500 ng/mL) of rSncb and exposure times (up to 72 h) according to Brockhaus et al. [35]. The further analyses were performed by incubating the cells with these concentrations for 72 h (n=4 per group).
Immunohistochemistry (IHC)
The localization and/or cellular expression patterns of SNCB within parts of the AVP as well cellular distributions of specific neuronal cells in SNCB-epxosed cell cultures were studied by using immunohistochemistry.
The expression of SNCB by cells within selected parts of the AVP was studied in brains of different aged animals (P0, n=8, 6-30 m, n=4 for each group) was extracted and post fixed in 4% PFA for at least 24 h. The process of further tissue preparation paraffin-embedding, sectioning as well as immunohistochemical staining is briefly described in previous protocols [31]. The procedures for selecting slices of the region of interest and underlying co-localization studies are described briefly further below in the method section.
The cellular distribution and response of retinal and cortical cells in vitro were also studied using IHC. The underlying method was performed according to the protocols previously described [35].
In both approaches, the antifade mounting medium (Mowiol, Hoechst, Frankfurt, Germany) containing bisBenzimide (Hoechst 33342) to stain the cell nuclei. The slices and cells were viewed using the appropriate filter, an epifluorescence microscope (Imager 2; Carl Zeiss, Jena, Germany), and the appropriate software (ZEN 2012; Carl Zeiss). Secondary antibody alone was used in the negative controls. Controls and treated samples were stained simultaneously to avoid variations in IHC staining. Primary and secondary antibodies are provided in Table 1.
Identification of SNCB in various cortical cell types in the AVP
Differences in the expressions of SNCB in cell types of the selected regions were analyzed were studied as follows. First, selected slices were routinely stained with hematoxylin and eosin (H&E) for basic morphological evaluation including comparison with the rat brain maps illustrated by [36]. The selected regions (see above) were correctly localized on examination of selected H&E-stained slides with brightlight microscopy (data not shown). Slices of selected regions were then immunohistochemically stained as described above. The cellular distribution of several cell types in SNCB-exposed retinal and cortical cultures were analysed with slight modifications of the described method, while no co-localization and only relative cell counts has to be performed. The underlying method and presentation modality was performed according to the protocols previously described [31,37].
Western blot analysis
Probes (P0, n=8, 6-30 m, n=4 for each group) obtained from selected parts of the ascending visual pathway as well as cultured retinal and cortical cells exposed to rSNCB were prepared for WB. The tissues were processed according to previous protocols [24]. Antibodies were detected by enhanced chemiluminescence (Amersham, Rockville, MD, USA), and the relative densities of the protein bands were analyzed using Alpha Ease (Alpha-Ease FC software 4.0, Alpha Innotech, Biozym Scientific, Vienna, Austria). The protein density of a fixed area was determined after subtracting the specific background density in the surrounding region, and this density was correlated and corrected using the relative density of an application control. The protein density of the control samples was defined as the reference values, and the relative values of other groups were calculated. Means and standard deviations (SDs) of the relative protein densities were obtained in at least three individual experiments each performed in triplicate for each individual group. The primary and secondary antibodies used for these experiments are listed in Table 1.
| Immunohistochemistry | |||||
|---|---|---|---|---|---|
| Antibody | Origin | Dilution | Manufacturer | ||
| Primary Antibodies | |||||
| SNCB | rabbit polyclonal | 1:200 | Abcam | ||
| ßIII-Tubulin | mouse monoclonal | 1:500 | Covance | ||
| NF-200 | mouse monoclonal | 1:200 | Sigma-Aldrich | ||
| GFAP | mouse monoclonal | 1:250 | Sigma-Aldrich | ||
| CD11b/c (OX-42) | mouse monoclonal | 1:50 | Serotec | ||
| p53 | Rabbit polyclonal | 1:200 | abcam | ||
| MDM2 | mouse monoclonal | 2:200 | Santa Cruz | ||
| p19-ARF | goat polyclonal | 1:200 | Santa Cruz | ||
| Secondary Antibodies | |||||
| Alexa 488 anti mouse | donkey | 1:500 | Jackson Immuno Research (Dianova) | ||
| Alexa 488 anti rabbit | donkey | 1:500 | Jackson Immuno Research (Dianova) | ||
| Alexa 488 anti goat | donkey | 1:100 | Jackson Immuno Research (Dianova) | ||
| Alexa 594 anti mouse | donkey | 1:500 | Jackson Immuno Research (Dianova) | ||
| Alexa 594 anti rabbit | donkey | 1:500 | Jackson Immuno Research (Dianova) | ||
| Alexa 488 anti goat | donkey | 1:100 | Jackson Immuno Research (Dianova) | ||
| Western Blotting | |||||
| Antibody | Origin | kDa | Dilution | Manufacturer | |
| Primary antibodies | |||||
| SNCB | rabbit monoclonal | 14 | 1:2000 | abcam | |
| ßIII-Tubulin | mouse monoclonal | 50 | 1:1000 | Covance | |
| GFAP | mouse monoclonal | 50 | 1:2000 | Sigma-Aldrich | |
| Calnexin | rabbit polyclonal | 90 | 1:10000 | Sigma-Aldrich | |
| Actin | mouse monoclonal | 42 | 1:20000 | Sigma-Aldrich | |
| Secondary antibodies | |||||
| HRP-conjugated anti rabbit | goat | n/a | 1:50000 | Sigma-Aldrich | |
| HRP-conjugated anti mouse | goat | n/a | 1:50000 | Sigma-Aldrich | |
Table 1: Antibodies for immunohistochemistry and western blotting.
Quantitative real-time polymerase chain reaction (PCR)
Total RNA was isolated using the Gene Elute Mammalian Total RNA Miniprep Kit (Sigma-Aldrich) according to the manufacturer’s instructions. Quantification was performed using an UV/visual spectral photometer (NanoDrop ND-1000, Peqlab, Erlangen, Germany). cDNA was synthesized from 1 μg of total RNA using the High Capacity cDNA Reverse Transcription Kit (Applied Biosystems; ABI, Foster City, CA, USA). The following quantitative real-time (qRT)-PCR primer pairs designed with SYBR-Green were used:
ß III Tubulin (NM_139254.2): forward: CCTGCCTCTTCGTCTCTAGC; reverse: TCCCAGAACTTGGCCCCTAT
NF-200 (NM_012607.2) forward: GGACCTGCTCAACGTCAAGA; reverse: CAATCCGACACTCTTCGCCT
GFAP (NM_017009.2) forward: AGATCGCCACCTACAGGAAA; reverse: TTTCTCGGATCTGGAGGTTG
Bax (NM_007527) forward: TTGCTGATGGCAACTTCAAC; reverse: GATCAGCTCGGGCACTTTAG;
Bcl2 (NM_016993.1) forward: TGAAGACTCCGCGCCCCTGA; reverse: CTGGCAGCCGTGTCTCGGTG
qRT-PCR was performed using the SYBR-Green PCR kit (ABI) according to the manufacturer’s instructions. The relative expression was calculated as 2-ΔCt(specific gene)/2-ΔCt mean, using the gene encoding Gapdh as the endogenous housekeeping gene. The relative expression (RQ, relative quotient) was calculated and is presented as a fold change relative to the expression level in the control group. To evaluate the pro- and the anti-apoptotic conditions, the ratio of the average Bcl- 2-associated protein (Bax) and B-cell lymphoma 2 (Bcl2) expression levels was determined.
Tunel assay
After SNCB exposure, retinal and cortical cell cultures were fixed with 4% PFA (Sigma-Aldrich) for 15 min., ApopTag Fluorescein in Situ Apoptosis Detection Kit S7110 (Merck Millipore) was used for TUNEL staining, according to the manufacturer’s instructions. Cell nuclei were stained with Hoechst 33342 and specific neuronal cell type were stained with ß-III Tubulin, Neurofilament-200, and Glial Fibrillary Acidic Protein (GFAP), respectively as described above. TUNEL-positive cells were counted and normalized to the untreated control.
Statistical analysis
Mean ± SD values were obtained using Kolmogorov-Smirnov- Test to confirm Gaussian distribution. The independent-sample t-test (for normally-distributed samples) or the Kruskal-Wallis H test (for non-Gaussian distributed samples) was used when appropriate. Local p values were corrected for multiple comparisons using the Holm-Bonferroni method. Figures were prepared using standard image-processing software (Photoshop, Adobe Systems, San Jose, CA, USA), and the overall brightness and contrast were adjusted without retouching. Data are presented as mean ± SD values compared with the unaffected control, and the level of statistical significance was set at p<0.05.
Results
Ascending visual pathway
The expression of SNCB in different parts of the AVP, including OC, tractus opticus, superior colliculus, and LGN at the protein and mRNA level using Western blotting, and rQT-PCR. Moreover, the differential expression patterns of SNCB in parts of the AVP were studied immunohistochemically by double staining of the differential cortical subsets of cells (neuons, glial and microglial cells) and SNCB.
Protein expression levels
Western blot analysis revealed a general elevation in expression of SNCB within all examined parts of the ascending visual part after 6 months (OC: 686.81 ± 27.29, p=0.001; LGN: 292.91 ± 9.69, p=0.0.001; SC: 596.69 ± 101.66, p=0.02) and 12 months (OC: 485.52 ± 475.16, p=0.045; LGN: 364.54 ± 116.85, p=0.04; SC: 568.15 ± 214.74, p=0.046) compared to P0. The expression of SNCB within the OC decreases and remained unchanged after 18 months (430.11 ± 218.57, p=0.08) and 30 months (262.86 ± 121.93, p=0.1) compared to P0. LGN (18 months: 468.09 ± 148.51, p=0.03; 30 months: 313.7 ± 92.71, p=0.04), and SC (18 months: 599.57 ± 152.13, p=0.02; 30 months: 407.6 ± 98.93, p=0.02) show stable overexpression rates of SNCB during aging compared to P0 (Figures 1A and 1B).
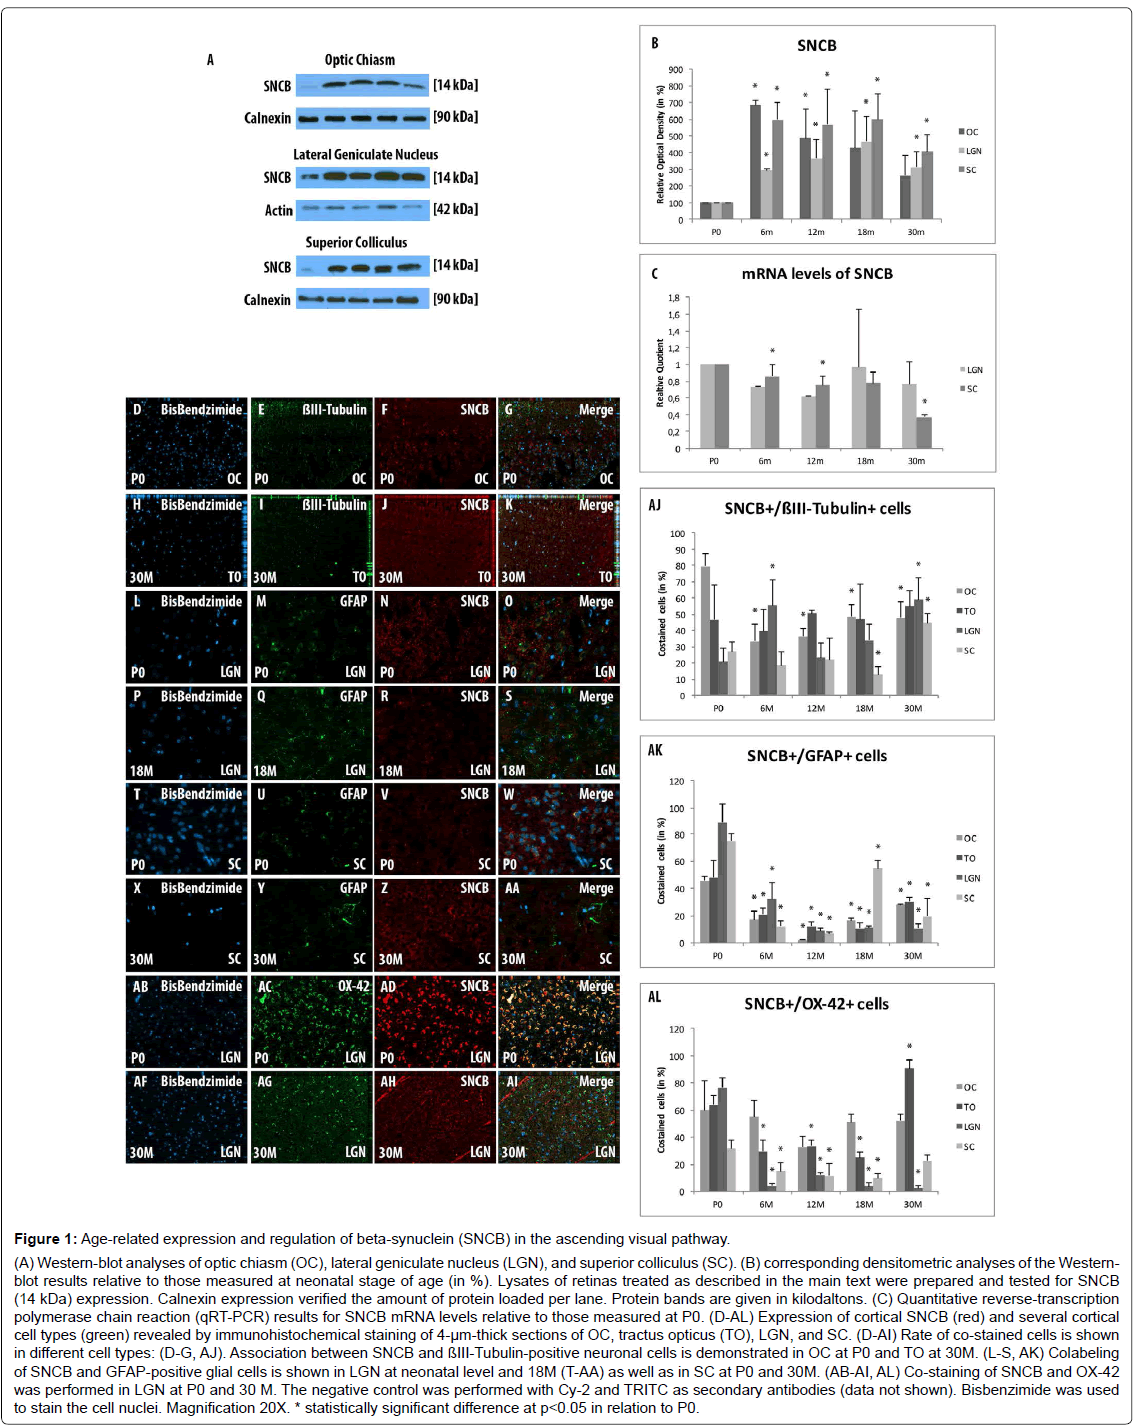
Figure 1: Age-related expression and regulation of beta-synuclein (SNCB) in the ascending visual pathway. (A) Western-blot analyses of optic chiasm (OC), lateral geniculate nucleus (LGN), and superior colliculus (SC). (B) corresponding densitometric analyses of the Westernblot results relative to those measured at neonatal stage of age (in %). Lysates of retinas treated as described in the main text were prepared and tested for SNCB (14 kDa) expression. Calnexin expression verified the amount of protein loaded per lane. Protein bands are given in kilodaltons. (C) Quantitative reverse-transcription polymerase chain reaction (qRT-PCR) results for SNCB mRNA levels relative to those measured at P0. (D-AL) Expression of cortical SNCB (red) and several cortical cell types (green) revealed by immunohistochemical staining of 4-µm-thick sections of OC, tractus opticus (TO), LGN, and SC. (D-AI) Rate of co-stained cells is shown in different cell types: (D-G, AJ). Association between SNCB and ßIII-Tubulin-positive neuronal cells is demonstrated in OC at P0 and TO at 30M. (L-S, AK) Colabeling of SNCB and GFAP-positive glial cells is shown in LGN at neonatal level and 18M (T-AA) as well as in SC at P0 and 30M. (AB-AI, AL) Co-staining of SNCB and OX-42 was performed in LGN at P0 and 30 M. The negative control was performed with Cy-2 and TRITC as secondary antibodies (data not shown). Bisbenzimide was used to stain the cell nuclei. Magnification 20X. * statistically significant difference at p
mRNA expression levels
mRNA expression levels of SNCB within the LGN were significantly downregulated in younger tissues (RQ: 6 months: 0.73 ± 0.08, 12 months p=0.62 ± 0.03, p=0.003), while with age (RQ: 18 months: 0.97 ± 0.1, p=0.69; 30 months: 0.77 ± 0.22, p=0.27) the mRNA levels remained unchanged compared to P0. The mRNA expression level of SNCB within SC remained unchanged during life-time (RQ: 6months: 0.86 ± 0.13, p=0.14; 12 months: 0.75 ± 0.19, p=0.1; 18 months: 0.77 ± 0.22, p=0.14). In the elderly, a significant decrease within the SC has been found after 30months (RQ: 0.37 ± 0.22, p=0.02) compared to P0 (Figure 1C).
Immunohistochemistry
The co-labeling study revealed a general expression of SNCB in different cortical cell types like neurons, glial cells and microglial cells. SNCB has been expressed in all examined stages of age and considered parts of the AVP (Figures 1D-AL).
Neuronal staining
The analysis of SNCB-positive neuronal cells shows only distinct alterations in the investigated parts of the AVP. So, increased number of SNCB-positive neuronal cells were found in OC during life time (6M: 33.4 ± 10.12%, p=0.01; 12M: 36.15 ± 5.1%, p=0.004; 18M: 48.4 ± 7.71%, p=0.02; 30M: 47.79 ± 10.2%, p=0.03) compared to neonatal rats (79.58 ± 8.16%) (Figures 1D-1G and AJ). The proportion of co-stained cells in the to remained stable throughout lifetime compared to neonatal tissue (Figures 1H-1K and AJ). The analyses revealed stable proportions of SNCB-positive neurons within LGN and SC in adolescent and adult stages of life compared to P0. A significant increase of SNCB-positive neuronal cells has been detected in both sections of visual pathway with age compared to adult tissues (e.g., LGN: 18M: 33.92 ± 9.74% vs. 30M 59.17 ± 12.95%, p=0.002; SC: 18M: 13.03 ± 4.69% vs. 30M: 44.63 ± 6.0%, p<0.001) (Figure 1AJ).
Glial staining
There was a direct correlation between SNCB and GFAP-positive cells at P0 in all parts of the AVP (OC: 45.72 ± 3.3%; TO: 47.95 ± 12.37%; LGN: 88.7 ± 13.84%; SC: 74.94 ± 4.93%). However, this close relationship between SNCB and glial cells decreased in general after 6M and remained low until elderly stages of age (e.g., 6M: OC: 17.01 ± 6.65%, p<0.001; TO: 21.08 ± 4.34%, p=0.02; LGN: 31.1 ± 12.03%, p<0.001; SC: 12.24 ± 3.56%, p<0.001) (Figures 1L-1S and T-AA and AK). An increase in co-labeling of SNCB-positive glial cells were found in the advanced ages within the OC (18m: 16.24 ± 1.78%, p<0.001; 30M: 27.78 ± 0.63%, p<0.001) and SC (18M: 54.74 ± 5.64%, p<0.001; 30M: 19.42 ± 13.35%, p=0.05) compared to adult tissues (12M: OC: 1.89 ± 0.6%; SC: 8.87 ± 2.09%) (Figures 1T-AA and AK). Moreover, an elevated proportion of SNCB-positive glial cells have been detected in elderly TO (30 m: 30.35 ± 3.0%) compared to adult (e.g., 12M: 12.06 ± 3.58%, p=0.002). In contrast, the amounts of SNCB-positive glial cells remained stable during life time (Figure 1AK).
Microglial staining
In general, a decrease of SNCB-positive microglial cells has been found parts of the visual pathway (e.g., 6M: 29.79 ± 8.43%, p=0.005, LGN: 4.21 ± 1.59%, p<0.001, SC: 14.89 ± 6.48%, p=0.006) compared to P0 (TO: 60.0 ± 21.5%; LGN: 63.91 ± 6.73%; SC: 76.53 ± 7.69%) during life time (Figure 1AL). The proportions of SCNB-positive microglial cells within the OC remained unchanged during life time (e.g., 6M: 54.89 ± 12.37%) compared to alterations within the neonate tissue (60.02 ± 21.5%, p=0.74). The overall amounts of SNCB-positive microglial cells within the LGN decreases significantly and remained low during life-time (6M: 4.22 ± 1.59%, p<0.001; 12M: 12.22 ± 1.57%, p=0.004; 18M: 3.65 ± 2.59%, p=0.01; 30M: 2.51 ± 2.11, p=0.004) compared to neonatal rats (76.53 ± 7.69%) (Figures 1AB-AI and AL). However, TO and SC revealed elevated amounts of SNCB-positive microglial cells in the elderly tissue (30M: TO: 90.56 ± 6.74%, p<0.001; SC: 22.41 ± 4.7%, p=0.02) compared to 18M (TO: 24.92 ± 4.09%; SC: 9.46 ± 3.76%) (Figure 1AL).
Response of rSNCB within retinal and cortical cells in-vitro
Immunohistochemistry, western blotting, and rQT-PCR were used to study the response of native dissociated retinal as well as cortical cells exposed to rSNCB in-vitro.
Cellular distribution of retinal cells exposed to rSNCB in-vitro
First, the response of different retinal cell types exposed to rSNCB in different concentrations was analyzed by immunofluorescence staining (Figures 2A-2L and 2Y).
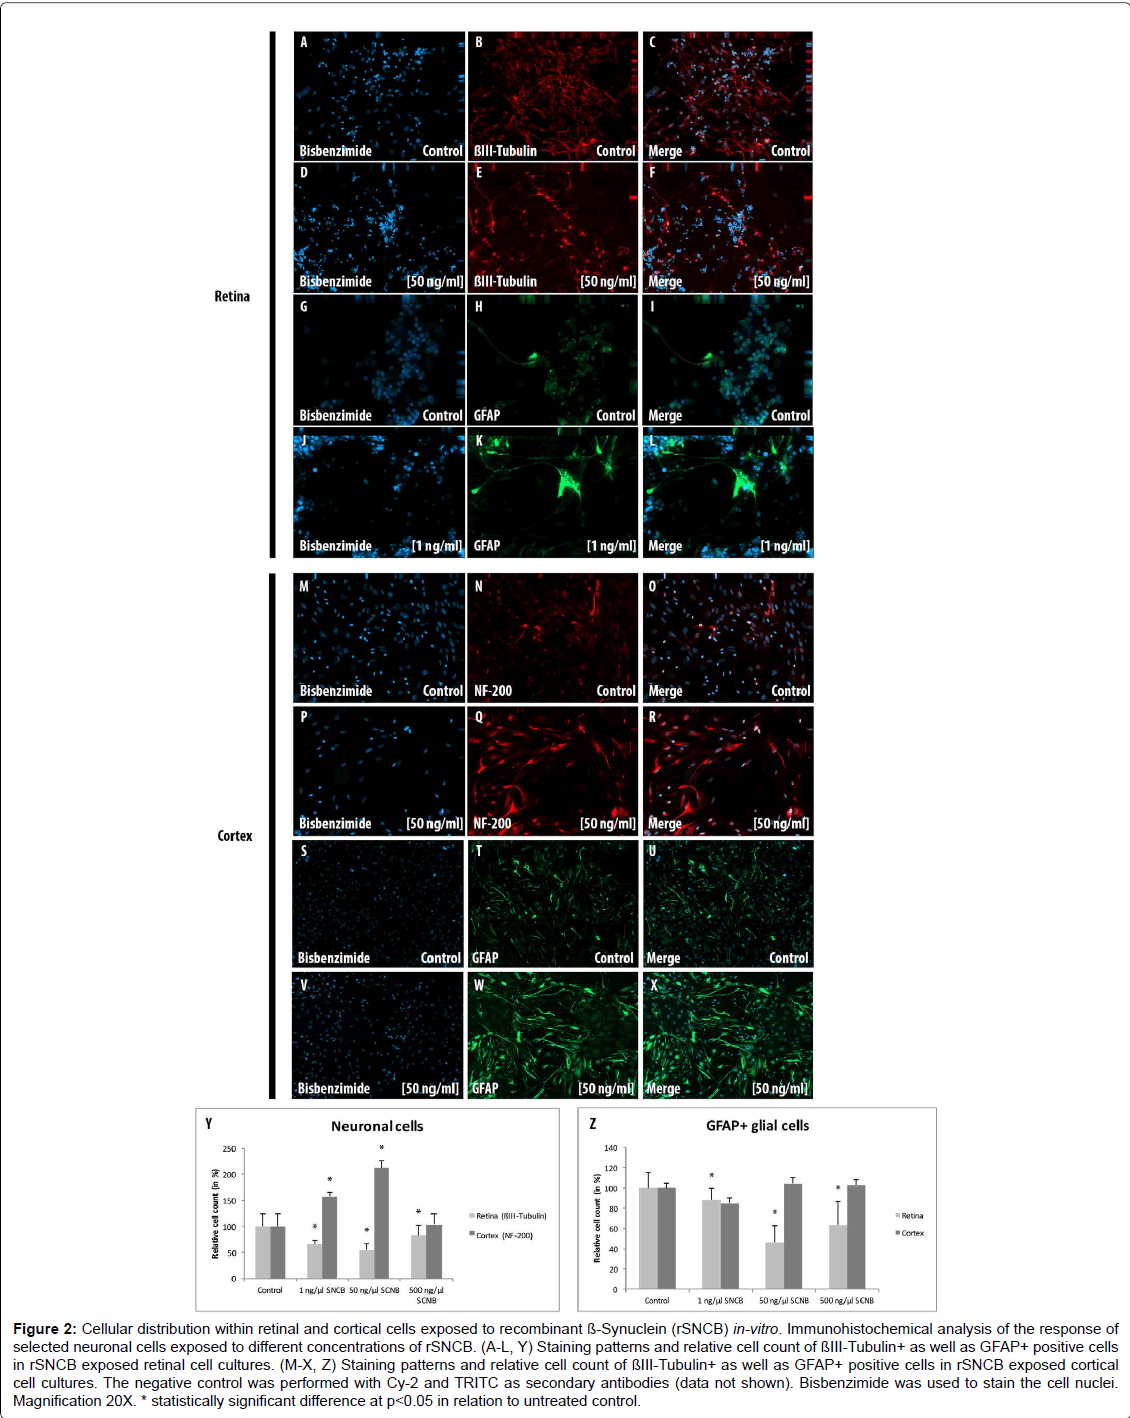
Figure 2: Cellular distribution within retinal and cortical cells exposed to recombinant ß-Synuclein (rSNCB) in-vitro. Immunohistochemical analysis of the response of selected neuronal cells exposed to different concentrations of rSNCB. (A-L, Y) Staining patterns and relative cell count of ßIII-Tubulin+ as well as GFAP+ positive cells in rSNCB exposed retinal cell cultures. (M-X, Z) Staining patterns and relative cell count of ßIII-Tubulin+ as well as GFAP+ positive cells in rSNCB exposed cortical cell cultures. The negative control was performed with Cy-2 and TRITC as secondary antibodies (data not shown). Bisbenzimide was used to stain the cell nuclei. Magnification 20X. * statistically significant difference at p
The amount of β III-Tubulin cells indicated as retinal ganglion cells, decreased within rSNCB exposed dissociated retinal cells (1 ng/ ml: 66.72 ± 7.41%, p=0.016; 50 ng/ml: 54.67 ± 12.54%, p=0.028; 500 ng/ml: 82.71 ± 19.8%, p=0.047) compared to control (100 ± 24.2%) without evidence for a dose depended effect (p>0.05 each) (Figures 2A- 2F and 2Y). Western blot analysis revealed a dose-depended decrease in the protein expression of retinal beta-III-Tubulin (1 ng/ml: 107.11 ± 18.17%, p=0.27; 50 ng/ml: 80.37 ± 6.69%, p=0.0035; 500 ng/ml: 81.66 ± 13.52%, p=0.0039) compared to control (100 ± 1.0%) after exposure to higher concentrations of rSNCB (Figures 3A and 3B). An increase of mRNA expression levels of NF-200 has been found in rSNCB exposed retinal cells (RQ: 1 ng/ml: 1.66 ± 0.55, p=0.084; 50 ng/ml: 1.94 ± 0.39, p=0.013; 500 ng/ml: 2.06 ± 0.58, p=0.045) compared to control. No differences between each group using rSNCB has been detected (p>0.05 each) (Figure 3C).
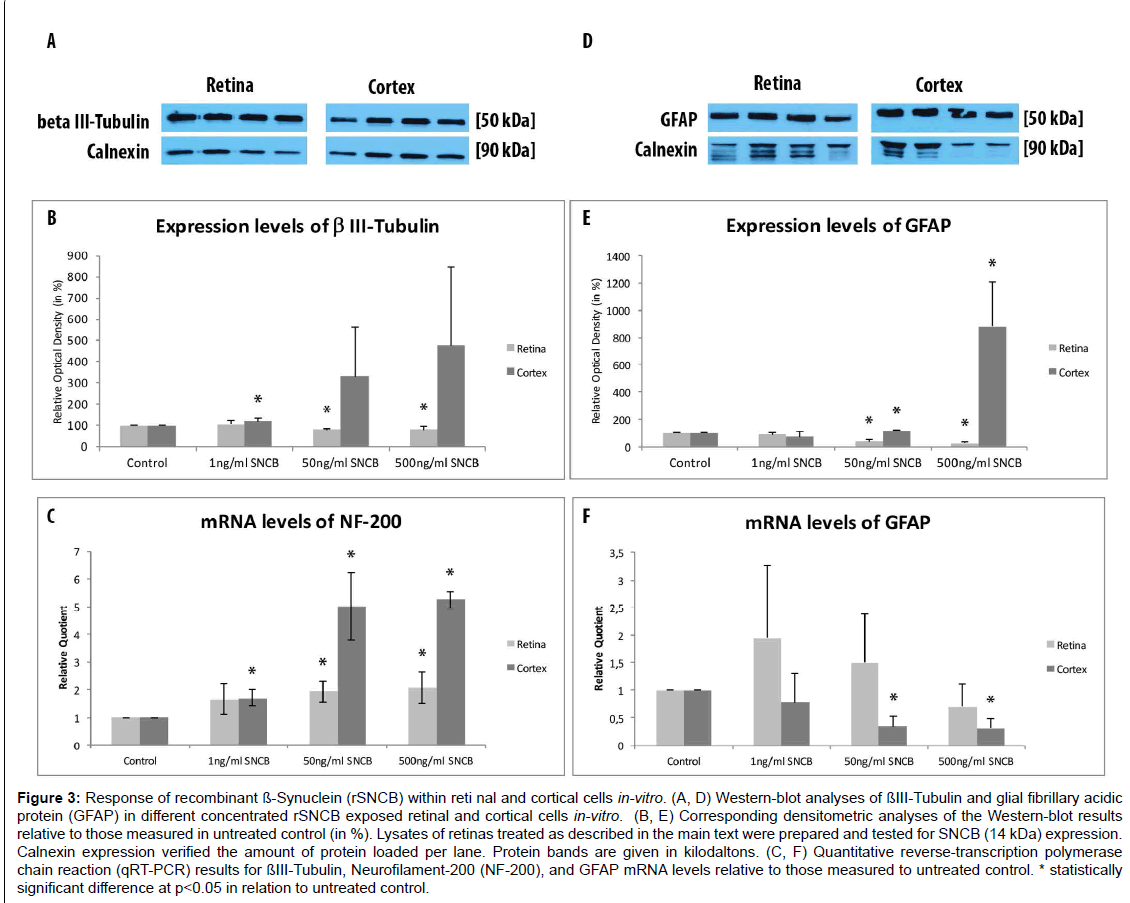
Figure 3:Response of recombinant ß-Synuclein (rSNCB) within reti nal and cortical cells in-vitro. (A, D) Western-blot analyses of ßIII-Tubulin and glial fibrillary acidic protein (GFAP) in different concentrated rSNCB exposed retinal and cortical cells in-vitro. (B, E) Corresponding densitometric analyses of the Western-blot results relative to those measured in untreated control (in %). Lysates of retinas treated as described in the main text were prepared and tested for SNCB (14 kDa) expression. Calnexin expression verified the amount of protein loaded per lane. Protein bands are given in kilodaltons. (C, F) Quantitative reverse-transcription polymerase chain reaction (qRT-PCR) results for ßIII-Tubulin, Neurofilament-200 (NF-200), and GFAP mRNA levels relative to those measured to untreated control. * statistically significant difference at p
Moreover, the following response of macroglial cells within rSNCBexposed retinal cells has been found. The amount GFAP+ positive cells decrease within rSNCB exposed dissociated retinal cells (1 ng/ml: 88.31 ± 10.99%, p=0.015; 50 ng/ml: 46.51 ± 16.34%, p<0.001; 500 ng/ ml: 63.56 ± 22.84%, p=0.002) compared to control (100 ± 14.61%). A significant difference has also been detected between the 1 ng/ml and 50 ng/ml group (p=0.0018) (Figures 2G-2L and 2Z). Protein expression studies with Western-blot showed a decrease of GFAP after exposure of retinal cells to higher concentrations (1 ng/ml: 86.69 ± 14.63, p=0.095; 50 ng/ml: 35.89 ± 10.05, p<0.001; 500 ng/ml: 20.5 ± 9.89, p<0.001) of rSNCB compared to control. Also, a significant decrease has been detected between the 1 ng/ml and 50 ng /ml group (p=0.0039) (Figures 3D and 3E). Analysis of mRNA expression levels of GFAP (RQ: 1 ng/ ml: 1.95 ± 1.32, p=0.13; 50 ng/ml: 1.49 ± 0.9, p=0.19; 500 ng/ml: 0.69 ± 0.42, p=0.14) within rSNCB exposed retinal revealed no differences compared to control and individual groups (p>0.05 each) (Figure 3F). The data indicate a general response of retinal ganglion cells as well as macroglial retinal cells after exposure to rSNCB in vitro.
Cellular distribution of cortical cells exposed to rSNCB invitro
Second, an analysis of the response of cortical cells exposed to rSCNB has been performed in a comparative manner to that in retinal tissue (Figures 2M-2X and 2Z).
An increase of NF-200+ cells has been found in cortical cells exposed to rSNCB (1 ng/ml: 158.67 ± 13.52%, p=0.026; 50 ng/ml: 213.1 ± 18.93%, p=0.0038; 500 mg/ml: 103.77 ± 30.33, p=0.89) compared to control (100 ± 32.75%) (Figures 2M-2R and 2Z). Westernblot analysis revealed an increase of beta-III tubulin expression in cortical probes exposed to lower rSNCB concentrations (1 ng/ml: 120.68 ± 13.53%, p=0.029; 50 ng/ml: 331.55 ± 235.12%, p=0.082; 500 ng/ml: 476.43 ± 373.57%, p=0.078) compared to control. No significant differences have been found between each group (p>0.05 each) (Figures 3A and 3B). A significant increase of mRNA levels of NF-200 has been also detected in the cortical cell cultures exposed to rSNCB (RQ: 1 ng/ ml: 1.7 ± 0.3, p=0.015; 50 ng/ml: 5.0 ± 1.21 p=0.0047; 500 ng/ml: 5.26 ± 0.3, p<0.001) compared to unaffected control. Also, a dosedepended elevation of NF-200 mRNA expression levels has been documented (1ng /ml vs. 50 ng/ml: p=0.01, 50 ng/ml vs. 500 ng/ml: <0.001) (Figure 3C).
The amount of GFAP+ macroglial cells remained unchanged in rSNCB-exposed cortical cell culture (1 ng/ml: 85.05 ± 13.23%, p=0.16; 50 ng/ml: 104.76 ± 8.17%, p=0.6; 500 ng/ml: 102.92 ± 2.44, p=0.73) compared to control (100 ± 18.76%) and between each group containing rSNCB (p>0.05 each) (Figures 2S-2X and 2Z). Moreover, a dose depended increase of GFAP expression has been detected (1 ng/ ml: 70.86 ± 38.28%, p=0.13; 50 ng/ml: 117.85 ± 0.18&, p<0.001; 880,44 ± 326.24%, p=0.0072) within rSNCB-exposed cortical cells compared to control. The increases of GFAP expression between groups using different concentrations of rSNCB were also significant (1ng /ml vs. 50 ng/ml: p=0.05, 50 ng/ml vs. 500 ng/ml: 0.006) (Figures 3D and 3E). Otherwise, a significant decrease of GFAP mRNA expression levels has been found in cortical cells exposed to higher concentrations of rSNCB (RQ: 1 ng/ml: 0.78 ± 0.54, p=0.42; 50 ng/ml: 0.34 ± 0.19, p<0.001; 500 ng/ml: 0.31 ± 0.18, p=0.01) compared to unaffected contro (Figure 3F).
Apoptosis in retinal and cortical cells exposed to rSNCB invitro
To evaluate the rate of apoptosis in rSNCB-exposed retinal and cortical cells both the TUNEL assay as well as mRNA expression levels of Bax/Bcl-2 has been studied.
A general elevation of TUNEL+ retinal ganglion cells exposed to rSNCB cells (1 ng/ml: 150.89 ± 35.74%, p=0.3; 50 ng/ml: 96.22 ± 24.7%, p=0.86; 500 ng/ml: 316.99 ± 20.76%, p<0.0001) has been observed (Figures 4A-4H). A dose depended alteration of TUNEL+ positive cells has been found under consideration of GFAP+ retinal cells after rSNCB exposure. GFAP+ retinal cells exposed to higher concentrations (500 ng/ml: 25.93 ± 3.6 c%, p=0.016) show less apoptosis. In ontrast, cells exposed to low-grade rSNCB as well as control (1 ng/ml: 86.21 ± 10.8%, p=0.24; 50 ng/ml: 177.78 ± 10.5%, p=0.26) remained unchanged (Figures 4I-4P).
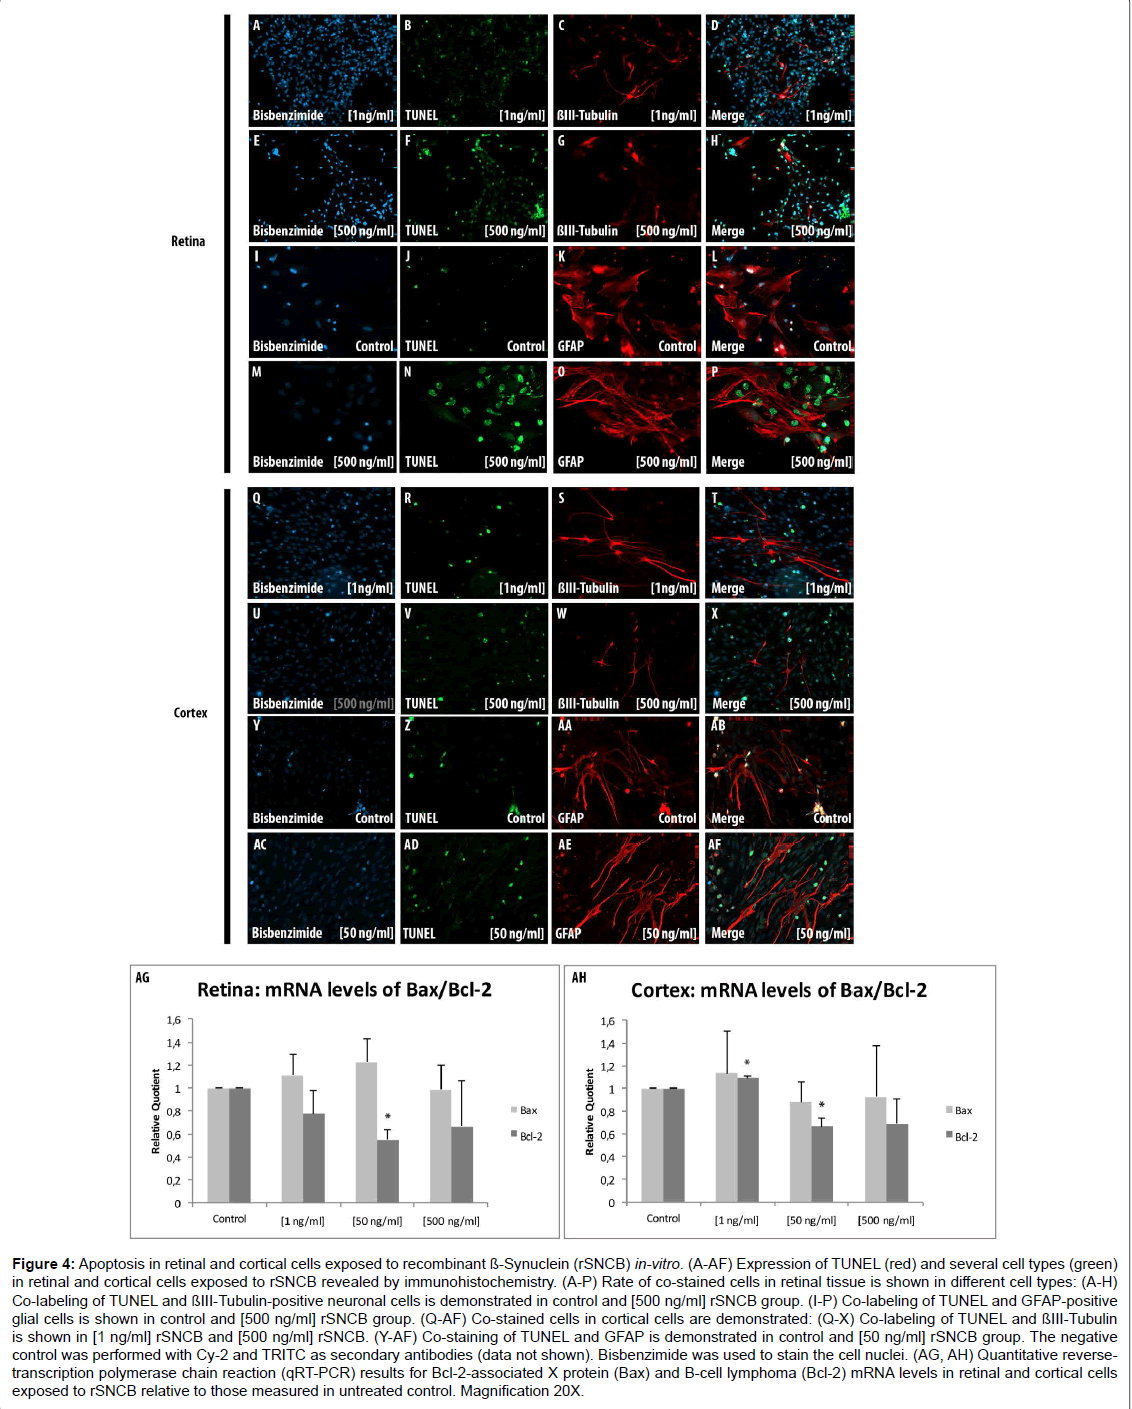
Figure 4: Apoptosis in retinal and cortical cells exposed to recombinant ß-Synuclein (rSNCB) in-vitro. (A-AF) Expression of TUNEL (red) and several cell types (green) in retinal and cortical cells exposed to rSNCB revealed by immunohistochemistry. (A-P) Rate of co-stained cells in retinal tissue is shown in different cell types: (A-H) Co-labeling of TUNEL and ßIII-Tubulin-positive neuronal cells is demonstrated in control and [500 ng/ml] rSNCB group. (I-P) Co-labeling of TUNEL and GFAP-positive glial cells is shown in control and [500 ng/ml] rSNCB group. (Q-AF) Co-stained cells in cortical cells are demonstrated: (Q-X) Co-labeling of TUNEL and ßIII-Tubulin is shown in [1 ng/ml] rSNCB and [500 ng/ml] rSNCB. (Y-AF) Co-staining of TUNEL and GFAP is demonstrated in control and [50 ng/ml] rSNCB group. The negative control was performed with Cy-2 and TRITC as secondary antibodies (data not shown). Bisbenzimide was used to stain the cell nuclei. (AG, AH) Quantitative reversetranscription polymerase chain reaction (qRT-PCR) results for Bcl-2-associated X protein (Bax) and B-cell lymphoma (Bcl-2) mRNA levels in retinal and cortical cells exposed to rSNCB relative to those measured in untreated control. Magnification 20X.
A decrease of Bcl-2 mRNA expression levels (RQ: 1 ng/ml: 0.78 ± 0.2. p=0.06; 50 ng/ml: 0.55 ± 0.085, p<0.001; 500 ng/ml: 0.67 ± 0.4, p=0.11) has been detected in rSNCB-exposed retinal cells, while Bax mRNA levels (RQ: 1 ng/ml: 1.11 ± 0.2, p=0.17; 50 ng/ml: 1.23 ± 0.2, p=0.06; 0.95 ± 0.2, p=0.34) were not altered compared to control. The decrease of Bcl-2 expression levels lead to pro-apoptotic switch of the Bax/Bcl-2 ratio (Bax/Bcl-2 ratio: 1 ng/ml: 1.43 ± 0.88, p=0.16; 50 ng/ ml: 2.22 ± 2.33, p=0.008; 500 ng/ml: 1.48 ± 0.53, p=0.17) within SNCBexposed retinal cells (Figure 4AG). The results of co-labeled TUNEL+ and ßIII-Tubulin+ as well as sGFAP+ cells together with a pro-apoptotic switch indicated by Bax/Bcl-2 ratio is somehow confusing, but can be explained by secondary effects maintained by rSNCB on retinal cells in-vitro.
Immunhistochemical analysis using TUNEL+ assay did not reveal significant alterations of apoptosis in both neuronal as well as glial cells within rSNCB-exposed cortical cells (p>0.05 each) (Figures 4Q and AF). In contrast, a decrease of Bcl-2 mRNA expression levels (RQ: 1 ng/ml: 1.1 ± 0.2, p=0.008; 50 ng/ml: 0.66 ± 0.1, p=0.01; 500 ng/ml: 0.69 ± 0.2, p=0.091) has been found in rSNCB-exposed cortical cells, whereas the levels of Bax remained unchanged (RQ: 1 ng/ml: 1.14 ± 0.37, p=0.28; 50 ng/ml: 0.88 ± 0.18, p=0.16, p=0.16; 500 ng/ml: 0.93 ± 0.45, p=0.4) compared to control (Figures 4AH). However, the decrease of Bcl-2 mRNA expression levels did not alter the overall apoptotic status of the Bax/Bcl-2 ratio within rSNCB-exposed cortical cells (Bax/ Bcl-2 ratio: 1 ng/ml: 1.04 ± 2.0, p=0.46; 50 ng/ml: 1.33 ± 2.34, p=0.25; 500 ng/ml: 1.34 ± 2.08, p=0.41), which also been reflected by the results of the TUNEL assay (data not shown).
p53/MDM2 signaling cascade in rNSCB exposed retinal and cortical cells
The response of the senescence-related p53/MDM2 signal cascade has been studied via immunofluorescence staining in both retinal and cortical cells related to the major cellular subtypes, neuronal and glial cells.
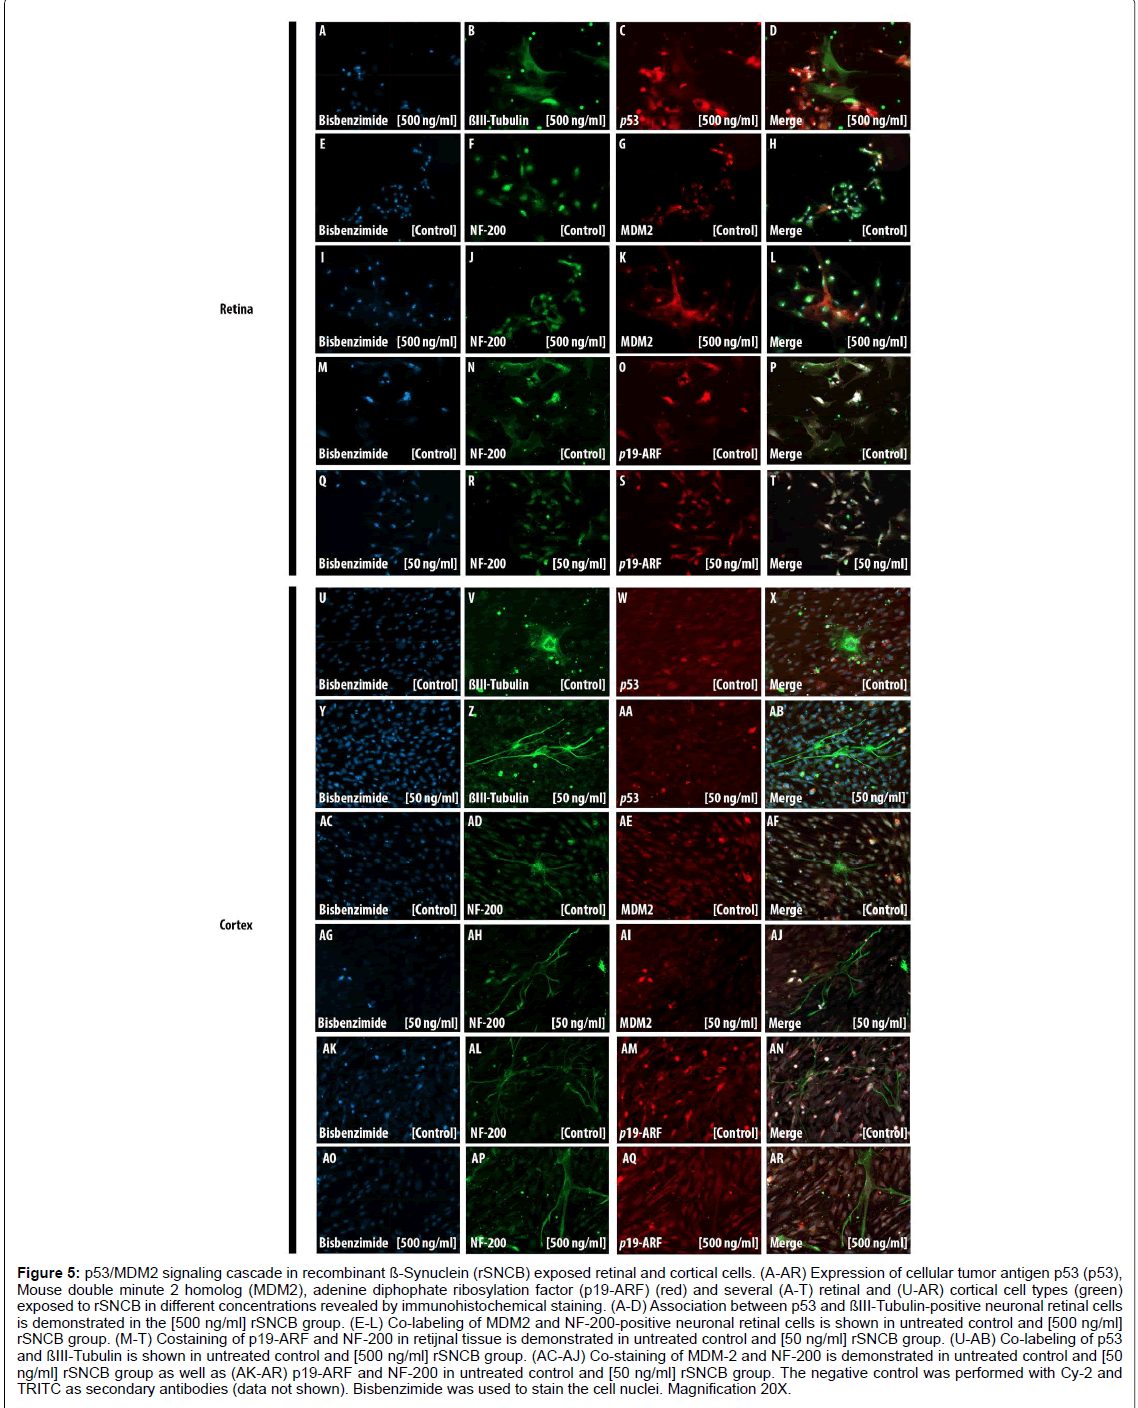
Figure 5: p53/MDM2 signaling cascade in recombinant ß-Synuclein (rSNCB) exposed retinal and cortical cells. (A-AR) Expression of cellular tumor antigen p53 (p53), Mouse double minute 2 homolog (MDM2), adenine diphophate ribosylation factor (p19-ARF) (red) and several (A-T) retinal and (U-AR) cortical cell types (green) exposed to rSNCB in different concentrations revealed by immunohistochemical staining. (A-D) Association between p53 and ßIII-Tubulin-positive neuronal retinal cells is demonstrated in the [500 ng/ml] rSNCB group. (E-L) Co-labeling of MDM2 and NF-200-positive neuronal retinal cells is shown in untreated control and [500 ng/ml] rSNCB group. (M-T) Costaining of p19-ARF and NF-200 in retijnal tissue is demonstrated in untreated control and [50 ng/ml] rSNCB group. (U-AB) Co-labeling of p53 and ßIII-Tubulin is shown in untreated control and [500 ng/ml] rSNCB group. (AC-AJ) Co-staining of MDM-2 and NF-200 is demonstrated in untreated control and [50 ng/ml] rSNCB group as well as (AK-AR) p19-ARF and NF-200 in untreated control and [50 ng/ml] rSNCB group. The negative control was performed with Cy-2 and TRITC as secondary antibodies (data not shown). Bisbenzimide was used to stain the cell nuclei. Magnification 20X.
First, the influence of the p53/MDM2 cascade mediated by rSNCB in retinal cells has been studied (Figures 5A-5T). Increased staining intensity of p53 in the nuclei and perinuclear regions has been found (Figures 5A-5D). The fluorescence intensity within the cytoplasm of MDM2 has to be found to decrease, while the fluorescence intensity of p19-ARF elevates after rSNCB exposure (Figures 5E-5T). These findings indicate the rSNCB-mediated activation of the p53/MDM2 signaling cascade in retinal neuronal cells. In contrast, no activation of the p53/MDM2 cascade within retinal glial cells related to rSNCB exposure has been found (data not shown).
In rSNCB exposed cortical cells a decrease of p53staining within the cytoplasm and neuronal cells of ßIII-Tubulin positive neuronal cells has been detected compared to control (Figures 5U and 5AB). An elevated fluorescence staining of MDM2 within the cell nuclei related to SNCB exposure has been found (Figures 5AC-5AJ). Further, a decrease of fluorescence intensity of p19-ARF within both cytoplasm and nuclei has been found. Those findings indicate a decreased activation of the p53/MDM2 cascade in cortical cells exposed to rSNCB (Figures 5AK- 5AR). Moreover, rSNCB does not lead to alterations of the p53/MDM2 cascade within cortical glial cells (data not shown).
Although IHC analyses do not represent an appropriate method for the quantification of p53 expression alterations, the presented data provide evidence of differential response of the p53/MDM-2 signaling cascade within specific neuronal tissue related by rSNCB exposure.
Discussion
The presented study deals with the age-related and cellular specific expression of SNCB in selected parts of the AVP. The study provides additional data concerning the expression characteristics of SNCB within the visual system including the neuroretina and visual cortex of rats. Further, the work studying the role of SNCB on basic cellular functions in the major parts of the anterior (represented by the neuroretina) and posterior visual pathway (represented by the visual cortex) in a comparative manner. The selection of neuroretina and cortex were justified by the major impact of both neuronal tissues within the processing of light and visual information respectively. Moreover, both tissues share important characteristics including embryonic development as well as the impact of important pathophysiological mechanisms in age-related diseases, like age-related macular degeneration (AMD) and AD [38]. This can also be explained, wether the neuroretina is used in different trails for monitoring clinical pathologies and neurological disorders [39-41].
SNCB as member of the family of cytoplasmic synuclein proteins that comprises SNCA, SNCB, and gamma-synuclein (SNCG) is thought to function in synaptic vesicles and neurotransmission, and neuronal plasticity. SNCA and SNCB are highly homologous proteins, and are co-localized in presynaptic nerve terminals in the CNS [27]. However, a life-time depended increase of SNCB has been found in the retina, viusal cortex and somatosensory cortex in different species including human, non-humans primates and rats [31,32].
The presented work has some limitations including quantitative approaches toward the protein expression in the AVP, missing differentiation of parvocellular and magnocellular neurons within LGN as well as analysis of the intensity of fluorescence staining patterns within e.g., the p53/MDM2 signal cascade restrict the meaningfulness of the observations. However, the presented manuscript provides newly information about the expression characteristics of SNCB within the visual system between neuroretina and cortex (representing the AVP, respectively). Further, the role of SNCB in different neuronal targets representing the anterior and posterior part of the visual pathway needs to be studied to elucidate similarities and differences on the impact of aging.
The following principal findings have been unveiled in this study:
(1) SNCB is widely expressed in parts of the anterior and posterior AVP, including OC, LGN, and SC indicating increased amounts during life-time.
(2) The SNCB expression characteristics differs between anterior parts (3rd ganglion, respectively) and posterior parts of the AVP.
(3) SNCB expression patterns and cellular affiliations in the anterior (3rd neuron, OC and tractus opticus, respectively) were comparable to that in the neuroretina (representing 1st and 2nd neuron, respectively).
(4) Expression characteristics of SNCB within the posterior part of the visual system (LGN and SC, respectively) are comparable to those in the visual cortex (V1).
(5) SNCB fulfil neuroprotective functions on cortical neuronal cells, whereas neurotoxic responses have been detected in retinal cells in-vitro.
Life-time expression of beta-Synuclein in the visual pathway of rats
This study unveiled an increased expression of SNCB within all examined sections of the anterior and posterior part of the visual pathway of rats during life-time. Immunohistochemical co-labeling studies yield a more detailed and differential relationship of SNCB expression in close association with neuronal, glial and microglial cells in all sections of the neonate AVP. This can be explained by high dynamics during postnatal development of the visual system in rodents after birth. During this early postnatal development, the visual system of rodents underlie different structural and functional alterations including eye opening, restructure of the neuronretinal architecture and modifications of the refractive lens [42]. Moreover, the findings also strengthen the high synaptic density and ongoing loss of synapses in the rat brain during life in the rat brain starting at postnatal day 35 and indicating high metabolic demands and endorsed neuronal vulnerability in early postnatal stages of life in rats [43].
The comparable trends of SNCB expression levels in the anterior (represented by OC and tractus opticus) as well as posterior (represented by LGN and SC) parts of the AVP indicating differences in the aging process related to the localization and order of coherent structures within the CNS. The separation of the AVP is reflected by the anterior part of the visual system which processing light to neuronal information as well as the posterior part as high ordered part of the visual system connecting other parts of the CNS, respectively.
Similarities in the expression patterns of SNCB were found in the OC and tractus opticus in neonate and senile stages of life. These parts of the visual pathway reflect the 3rd neuron of the visual pathway in the context of differential environments within the cranial fossa. In recent works, the age-related increase of SNCB expression has been detected in the IPL and OPL of retina, reflecting the 2nd neuron of the AVP [32,44]. The high association of SNCB and neuronal cells in both OC and tractus opticus may indicate a general low vulnerability of those neurons during life time related to life-time loss of RGCs as well as the impairment of the general regeneration potential within the optic nerve [18,25,45]. Age-related metabolic changes include a global reduction in the brain’s energy requirements and decreases in cerebral blood flow and glucose utilization [46]. The elevated association of SNCB to microglial cells in neonate stages of life may reflect the higher vulnerability, higher metabolic conditions and regional higher blood flow in the early postnatal development. At molecular level, an evolutionary conservation of gene expression in the aging brain includes increase in stress and inflammatory responses, and loss of mitochondria, neural plasticity, autophagy, and synaptic functions. The elevation of SNCB in the elderly may reflect those age-related alterations in neuronal tissue [22,47].
The expression characteristics of SNCB differ within parts of the posterior AVP. Low expression of SNCB by neonate neuronal cells together with elevation in senile stages of life may reflect the general loss of vulnerability during life time. Thus, may occur later within in posterior parts (e.g., LGN and SC) as in anterior parts of the AVP. A high association of microglial cells with SNCB in neonate stages together with its decrease during life time may reflect the metabolic conditions in the early postnatal development. Comparable characteristics of SNCB expression has been recently reported within the visual cortex of rats during life-time [31]. The missing increase of SNCB-positive microglial cells in the elderly can be explained by comparable age-related changes e.g., in the LGN in rats and non-human primates, which indicate a decrease in neuron density but not in number of neurons. The suggested hypertrophy of neurons may reflect a compensatory process. A more dendritic branching may compensate the decrease of synapses / dendritic branches and/or efficacy of synaptic transmission [18].
The observed differences in the expression patterns of SNCB in the AVP together with recent reports about its expression characteristics in neuroretina and visual cortex support the need to study role and function of SNCB in detail. For this purpose, native cells generated from neuroretina and visual cortex were chosen to elucidate the role of SNCB in a comparative manner. Both, cells of the retina and visual cortex are predestined to be used for further analysis: (1) both tissues representing the dimetral anterior and posterior part of the AVP (2) both tissues are exposed to differential metabolic and stress conditions and (3) both share embryonic development as well as aged related mechanisms. Moreover, age-related diseases of the brain and retina share common pathophysiological mechanisms. However, thus promote the need to study the fundamental role of SNCB in major parts of the AVP represented by the retina and cortex.
Response of retinal and cortical cells on SNCB in-vitro
Recent studies described variations of functions maintained by SNCB on different neuronal cells. First, neuroprotective functions include neurotoxic responses in 6- hydroxydopmaine-affected TSM- 1 (twin sensillum of margin 1) neurons [26-28,30] together with a decrease of the proapoptotic gene p53 [48]. Furthermore, SNCB activates the Akt signaling pathway in rotenone-affected tissue culture B103 cells [26]. Hashimoto suggested that the SNCB activation of Akt resulted in Mdm2 (mouse double minute 2 homolog) phosphorylation, which in turn inactivates p53 promoting neuroprotection against toxins [26]. Finally, SNCB protects the CNS against the toxic effects of SNCA overexpression in tg mice [29] due to increased Akt pathway activity. Contradictory, SNCB seems to regulate endothelial cells of the neurovascular unit (e.g., brain microvascular endothelial cells) in an opposite manner due to a p53-mediated and Akt in-depended apoptosis in-vitro [35]. The differential roles of SNCB on different cellular targets and/or neuronal tissues promote the need for ongoing studies in a comparative manner. Here, we demonstrated that retinal and cortical cells are contrary affected by exposure to SNCB in-vitro.
The retina contains several specific characteristics, like an extensive light exposure a complex and diverse cellular network including five major cell types containing different functions as well as the interaction with a neuroepithelial originated retinal pigment epithelium [49]. Concerning the central nervous system, most morphological studies of postnatal development and aging have focused on the visual cortex due to its clearly demarcated characteristic anatomy, such as its very large granular layer [50,51]. The recent findings presume stress-related mechanisms maintained by SNCB within the retina in-vitro. The effects on apoptosis has been considered as dose depended: Lower concentrations of SNCB resulted in stable of apoptosic rates, while cells exposed to higher concentrations of SNCB show elevated apoptotic rates. The p19-ARF/MDM2 mediated p53 activation mediated by SNCB promotes the theory about a p53-related apoptosis within neuronal cells. In contrast, the decrease of retinal glial cells may not related to p53 activation and be caused by secondary effects. The cell type specific p53 activation highly promotes a differential response of retinal cells associated with SNCB exposure. However, the endorsed expression of pro-apoptotic genes presumes a switch of the retinal cellular network in a pro-apoptotic condition, while the increase of the Bax/Bcl2 ratio indicates the activation of the mitochondrial apoptosis pathway [52]. Summarized, the data suspects additional effects of SNCB on retinal cells under dose-depended manner in vitro and contradict recent reports of neuroprotective effects maintained by SNCB.
The response in SNCB exposed cortical cells differs considerably. Elevated neuronal markers as well as unaltered glial response as well as apoptotic rates indicate general neuroprotective effects of SNCB on cortical cells in-vitro. The findings in the immunofluorescence studies of a general decrease of the p19-ARF/MDM2 mediated p53 activation and lower apoptotic rates presume neuroprotective properties maintained by rSNCB within ß III-Tubulin - positive cortical neuronal cells. Further, the missing activation of p53 within rSNCB-exposed cortical glial cells promote an unaltered glial response. However, neuroprotective properties in cortical cells exposed to lower concentration of SNCB indicate dose-depended effects of SNCB. Further, neuronal and glial marker as well as apoptosis rates remained unchanged in the group of higher SNCB concentrations.
Summarized, the findings support differential roles of SNCB on different neuronal tissues. These contrary findings of effects on retinal and cortical cells partially contradict the previously observed and generally accepted neuroprotective properties of SNCB [26-30,48]. While the response of the SNCB retina shows comparable characteristics to those explored in the neurovascular unit, the studied neuroprotective patterns in cortical cells show strong similarities to those in other neuronal tissues.
The differential response of retinal and cortical cells exposed to SNCB promote the theory, that the differential postnatal development and aging process may be highly associated with metabolic- (e.g., blood flow), stress-related- (e.g., immune privilege of the eye) and environmental conditions. Further, the detected response of neuronal cells can be also explained by individual tissue capabilities related to differences e.g., in the cellular network constitutions. The aligned dose depended effect may reflect the overall increase of SNCB during life time. We therefore hypothesize, that an overexpression and therefore resulted accumulation of SNCB within neuronal tissue occurs during life time and results in the mentioned pathophysiological conditions.
However, the findings presenting in this study only displays the expression and functional characteristics of the unique protein SNCB within the complex age-affected impairment of visual function. Distinct differences in parts of the visual system in the context to the proposed heterogeneous anatomical environment together with life-time-related conditions like blood-flow constitutions, metabolic conditions and oxidative stress response may explain the differential functional role of factors like SNCB related to different neuronal targets.
Conclusion
The presented findings of a general increased SNCB expression in the high ordered parts of the AVP like LGN and SC together with neuroprotective properties of SNCB in cortical cells in vitro promote a pivot and beneficial role of SNCB in the neuronal context. However, differential expression patterns in several parts of the APV and the unequal response on neuronal cells different origin remained unclear and have been mandatory in further studies.
Acknowledgement
The authors thank M. Wissing and M. Langkamp-Flock for their skillful technical assistance. This work was supported by an Innovative Medical Research (IMF) grant awarded by the School of Medicine, Westfalian Wilhelms-University of Münster (I- Bö221307 to MRRB) and German Research foundation (DFG) grant (BO 4556/1-1) to MRRB).
References
- Harada T, Harada C, Parada LF (2007) Molecular regulation of visual system development: More than meets the eye. Genes Dev 21: 367-378.
- Kline DW, Schieber F, Abusamra LC, Coyne AC (1983) Age, the eye, and the visual channels: Contrast sensitivity and response speed. J Gerontol 38: 211-216.
- Mavroudis I, Petrides F, Manani M, Theocharides C, Ciobica A, et al. (2012) Dendritic and spinal alterations of the spiny stellate cells of the human visual cortex during normal aging. Folia Neuropathol 50: 261-269.
- Nomura H, Ando F, Niino N, Shimokata H, Miyake Y (2003) Age-related change in contrast sensitivity among japanese adults. Jpn J Ophthalmol 47: 299-303.
- Ross JE, Clarke DD, Bron AJ (1985) Effect of age on contrast sensitivity function: Uniocular and binocular findings. Br J Ophthalmol 69: 51-56.
- Schefrin BE, Tregear SJ, Harvey LO, Werner JS (1999) Senescent changes in scotopic contrast sensitivity. Vision Res 39: 3728-3736.
- Weale RA (1975) Senile changes in visual acuity. Trans Ophthalmol Soc U K 95: 36-38.
- Calkins DJ (2013) Age-related changes in the visual pathways: Blame it on the axon. Invest Ophthalmol Vis Sci 54: ORSF37-ORSF41.
- Celesia GG, Kaufman D, Cone S (1987) Effects of age and sex on pattern electroretinograms and visual evoked potentials. Electroencephalogr Clin Neurophysiol 68: 161-171.
- Porciatti V, Burr DC, Morrone MC, Fiorentini A (1992) The effects of aging on the pattern electroretinogram and visual evoked potential in humans. Vision Res 32: 1199-1209.
- Tomoda H, Celesia GG, Brigell MG, Toleikis S (1991) The effects of age on steady-state pattern electroretinograms and visual evoked potentials. Doc Ophthalmol 77: 201-211.
- Trick GL, Trick LR, Haywood KM (1986) Altered pattern evoked retinal and cortical potentials associated with human senescence. Curr Eye Res 5: 717-724.
- Danias J, Lee KC, Zamora MF, Chen B, Shen F, et al. (2003) Quantitative analysis of retinal ganglion cell (RGC) loss in aging DBA/2NNia glaucomatous mice: Comparison with RGC loss in aging C57/BL6 mice. Invest Ophthalmol Vis Sci 44: 5151-5162.
- Harman AM, MacDonald A, Meyer P, Ahmat A (2003) Numbers of neurons in the retinal ganglion cell layer of the rat do not change throughout life. Gerontology 49: 350-355.
- Weisse I (1995) Changes in the aging rat retina. Ophthalmic Res 27 Suppl 1: 154-163.
- Samuel MA, Zhang Y, Meister M, Sanes JR (2011) Age-related alterations in neurons of the mouse retina. J Neurosci 31: 16033-16044.
- Ahmad A, Spear PD (1993) Effects of aging on the size, density, and number of rhesus monkey lateral geniculate neurons. J Comp Neurol 334: 631-643.
- Li M, He HG, Shi W, Li J, Lv B, et al. (2012) Quantification of the human lateral geniculate nucleus in vivo using MR imaging based on morphometry: Volume loss with age. AJNR Am J Neuroradiol 33: 915-921.
- Selemon LD, Begovic A (2007) Stereologic analysis of the lateral geniculate nucleus of the thalamus in normal and schizophrenic subjects. Psychiatry Res 151: 1-10.
- Diaz F, Villena A, Gonzalez P, Requena V, Rius F, et al. (1999) Stereological age-related changes in neurons of the rat dorsal lateral geniculate nucleus. Anat Rec 255: 396-400.
- Bishop NA, Lu T, Yankner BA (2010) Neural mechanisms of ageing and cognitive decline. Nature 464: 529-535.
- Chen M, Xu H (2015) Parainflammation, chronic inflammation, and age-related macular degeneration. J Leukoc Biol 98: 713-725.
- Boehm MR, Oellers P, Thanos S (2011) Inflammation and immunology of the vitreoretinal compartment. Inflamm Allergy Drug Targets 10: 283-309.
- Böhm MRR, Thanos S (2017) The aging retina in the context of cerebral neurodegenerative diseases]. Klin Monbl Augenheilkd.
- Hashimoto M, Rockenstein E, Mante M, Crews L, Bar-On P, et al. (2004) An antiaggregation gene therapy strategy for lewy body disease utilizing beta-synuclein lentivirus in a transgenic model. Gene Ther 11: 1713-1723.
- Hashimoto M, Rockenstein E, Mante M, Mallory M, Masliah E (2001) beta-Synuclein inhibits alpha-synuclein aggregation: A possible role as an anti-parkinsonian factor. Neuron 32: 213-223.
- Park JY, Lansbury PT (2003) Beta-synuclein inhibits formation of alpha-synuclein protofibrils: A possible therapeutic strategy against parkinson's disease. Biochemistry 42: 3696-3700.
- Spillantini MG, Schmidt ML, Lee VM, Trojanowski JQ, Jakes R, et al. (1997) Alpha-synuclein in Lewy bodies. Nature 388: 839-840.
- Tsigelny IF, Bar-On P, Sharikov Y, Crews L, Hashimoto M, et al. (2007) Dynamics of alpha-synuclein aggregation and inhibition of pore-like oligomer development by beta-synuclein. FEBS J 274: 1862-1877.
- Böhm MR, Melkonyan H, Thanos S (2015) Life-time expression of the proteins peroxiredoxin, beta-synuclein, PARK7/DJ-1, and stathmin in the primary visual and primary somatosensory cortices in rats. Front Neuroanat 9: 16.
- Böhm MR, Mertsch S, König S, Spieker T, Thanos S (2013) Macula-less rat and macula-bearing monkey retinas exhibit common lifelong proteomic changes. Neurobiol Aging 34: 2659-2675.
- Palkovits M (1988) Maps and guide to microdissection of the rat brain. New York: Elsevier.
- Brownstein M, Kobayashi R, Palkovits M, Saavedra JM (1975) Choline acetyltransferase levels in diencephalic nuclei of the rat. J Neurochem 24: 35-38.
- Brockhaus K, Böhm MR, Melkonyan H, Thanos S (2018) Age-related beta-synuclein alters the p53/Mdm2 pathway and induces the apoptosis of brain-microvascular endothelial cells In vitro. Cell Transplanatation (in press).
- Swanson LW (2018) Brain maps 4.0-Structure of the rat brain: An open access atlas with global nervous system nomenclature ontology and flatmaps. J Comp Neurol 526: 935-943.
- He X, Zhang XM, Wu J, Fu J, Mou L, et al. (2014) Olfactory experience modulates immature neuron development in postnatal and adult guinea pig piriform cortex. Neuroscience 259: 101-112.
- Sivak JM (2013) The aging eye: Common degenerative mechanisms between the alzheimer's brain and retinal disease. Invest Ophthalmol Vis Sci 54: 871-880.
- Bulut M, Yaman A, Erol MK, Kurtuluş F, Toslak D, et al. (2016) Choroidal thickness in patients with mild cognitive impairment and alzheimer’s type dementia. J Ophthalmol 2016: 7291257.
- Chorostecki J, Seraji-Bozorgzad N, Shah A, Bao F, Bao G, et al. (2015) Characterization of retinal architecture in Parkinson's disease. J Neurol Sci 355: 44-48.
- Turski GN, Schmitz-Valckenberg S, Holz FG, Finger RP (2017) [Retinal imaging of the macula and optic disc in neurodegenerative diseases]. Ophthalmologe 114: 114-119.
- Van Cruchten S, Vrolyk V, Perron Lepage MF, Baudon M, Voute H, et al. (2017) Pre- and Postnatal Development of the Eye: A Species Comparison. Birth Defects Res 109: 1540-1567.
- Aghajanian GK, Bloom FE (1967) The formation of synaptic junctions in developing rat brain: A quantitative electron microscopic study. Brain Res 6: 716-727.
- Surguchov A, McMahan B, Masliah E, Surgucheva I (2001) Synucleins in ocular tissues. J Neurosci Res 65: 68-77.
- Thanos S, Böhm MR, Schallenberg M, Oellers P (2012) Traumatology of the optic nerve and contribution of crystallins to axonal regeneration. Cell Tissue Res 349: 49-69.
- Chugani HT, Hovda DA, Villablanca JR, Phelps ME, Xu WF (1991) Metabolic maturation of the brain: A study of local cerebral glucose utilization in the developing cat. J Cereb Blood Flow Metab 11: 35-47.
- Loerch PM, Lu T, Dakin KA, Vann JM, Isaacs A, et al. (2008) Evolution of the aging brain transcriptome and synaptic regulation. PLoS One 3: e3329.
- da Costa CA, Masliah E, Checler F (2003) Beta-synuclein displays an antiapoptotic p53-dependent phenotype and protects neurons from 6-hydroxydopamine-induced caspase 3 activation: Cross-talk with alpha-synuclein and implication for parkinson's disease. J Biol Chem 278: 37330-37335.
- Strauss O (2005) The retinal pigment epithelium in visual function. Physiol Rev 85: 845-881.
- Huttenlocher PR (1990) Morphometric study of human cerebral cortex development. Neuropsychologia 28: 517-527.
- Huttenlocher PR, de Courten C, Garey LJ, Van der Loos H (1982) Synaptogenesis in human visual cortex--evidence for synapse elimination during normal development. Neurosci Lett 33: 247-252.
- Basu A, Haldar S (1998) Microtubule-damaging drugs triggered bcl2 phosphorylation-requirement of phosphorylation on both serine-70 and serine-87 residues of bcl2 protein. Int J Oncol 13: 659-664.
Citation: Böhm M, Hadrian K, Brockhaus K, Melkonyan H, Thanos S (2018) Age-Related Expression of Beta-Synuclein in the Ascending Visual Pathway and Comparative Analysis of its Function within the Neuroretina and Cerebral Cortex In-vitro. J Alzheimers Dis Parkinsonism 8: 427. DOI: 10.4172/2161-0460.1000427
Copyright: ©2018 Böhm M, et al. This is an open-access article distributed under the terms of the Creative Commons Attribution License, which permits unrestricted use, distribution, and reproduction in any medium, provided the original author and source are credited.
Share This Article
Recommended Journals
Open Access Journals
Article Tools
Article Usage
- Total views: 4333
- [From(publication date): 0-2018 - Apr 02, 2025]
- Breakdown by view type
- HTML page views: 3486
- PDF downloads: 847