Research Article Open Access
Aerosol Hygroscopic Growth as a New Factor for Trace and Ultra-Trace Determination of Phosphorous in Flame Containing Optical Trapping-Cavity Ring-Down Spectroscopy
Mohammad Mahdi Doroodmand* and Fatemeh GhasemiDepartment of Chemistry, College of Sciences, Shiraz University, Shiraz 71454, Iran
- *Corresponding Author:
- Mohammad Mahdi Doroodmand
Department of Chemistry, College of Sciences
Shiraz University, Shiraz 71454
Iran
Tel: +0987136137152
Fax: +0987136460788
E-mail: oroodmand@shirazu.ac.ir
Received date: April 06, 2017; Accepted date: April 07, 2017; Published date: April 10, 2017
Citation: Doroodmand MM, Ghasemi F (2017) Aerosol Hygroscopic Growth as a New Factor for Trace and Ultra-Trace Determination of Phosphorous in Flame Containing Optical Trapping-Cavity Ring-Down Spectroscopy. J Anal Bioanal Tech 8: 360. doi: 10.4172/2155-9872.1000360
Copyright: © 2017 Doroodmand MM, et al. This is an open-access article distributed under the terms of the Creative Commons Attribution License, which permits unrestricted use, distribution, and reproduction in any medium, provided the original author and source are credited.
Visit for more related articles at Journal of Analytical & Bioanalytical Techniques
Abstract
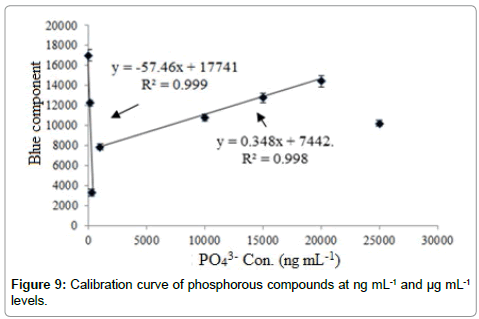
A new method has been introduced based on aerosol hygroscopic growth as a new factor for trace and ultra-trace determination of phosphorous in flame containing optical trapping-cavity ring down aerosol extinction (emission) spectrometer (OT-CRD-AES). In this study, a cavity ring down has been designed using hydrogen and air as fuel and oxidant during introduction of the aerosols containing phosphorous species using an ultrasonic generator (humidifier) from an acidic solution by a flow rate of N2 , followed by detection of the Mie scattering using a charged coupling device (CCD) system. Parameters having strong influence during following scattering of the aerosols during their hygroscopic growth inside the humidified flame (H2 /air), include: influence and amount of Na+ as radiation buffer (as light source), flow rates of H2 , air and N2 , kind and concentrations of acid, evaluation of the aerosols inside flame, etc. These parameters were optimized using simplex and one at a time methods. Based on the figures of merit under optimized condition, two linear calibration curves with reverse slopes were evaluated between 10.0 - 250.0 ng mL-1 and 1.0 - 20.0 µg mL-1 with correlation coefficients (R2 ) the same as 0.999 and 0.998, respectively. The calibration sensitivities were also estimated to 57.46 and 0.348 (a.u), respectively, with detection limit of 5.0 ng mL-1. The mechanism of the radiation (Mie scattering) was also evidenced based on i) dependency of the scattered radiations to the quantity of an alkali ions such as Na+ as well as the humidity, ii) presence of acceptable correlation between the response of the cavity with turbidometry, iii) observation of blue shift from green (color related to the luminescence of HPO* in H2 /air flame) to blue (scattered radiation) and finally iv) effect of hydration number during stability and growth of the aerosols inside the flames. No serious interference was evaluated during analysis of at least 500-fold excess of various foreign species. However, the only observed interference was evaluated during introduction of 200-fold excess of SO4 2-. Good correlation was also evaluated between the results obtained from this technique and ion exchange chromatography during analysis of wastewater samples that clearly revealed the reliability of this method for phosphorous detection and determination at µg mL-1 and ng mL-1 levels.
Keywords
Aerosol hygroscopic growth; Aerosol; Mie scattering; Reducing flame; Phosphorus determination
Introduction
Duo to the limitations such as effect of pH, low sensitivity, wide range of geometries, and/or because of significant dependency of the binding affinity of anionic species on solvent, anion recognition has been considered as a challenging task during the last decades [1]. These phenomena point to the importance of the introduction of a selective, sensitive and reliable method for recognition of anionic species [2]. Among various forms of anionic species, detection and determination of phosphorous species in the environmental samples has been important due to the essential information for monitoring the health of ecosystems, investigation of biogeochemical processes and checking compliance with legislation [3]. Also control of the quantity of phosphorous in fertilizers leads to an excessive growth (eutrophication) of aquatic plants and algae that disrupts aquatic life cycles [4]. Based on the perspective of biology, phosphorous species such as phosphate anion is considered as one of the most important electrolytes that plays role as an essential component in all living organisms [5].
Phosphorous also has major role in biological processes such as in the structure of ATP (Adenosine triphosphate) and DNA (Deoxyribonucleic acid) and also during control of pH in blood or lymph fluid [5]. In a clinical setting, phosphate level in serum is determined as part of a routine blood analysis [5]. Also knowledge about phosphorous level in the body fluids can provide useful information about several diseases such as hyperparathyroidism, vitamin D deficiency, and Fanconi syndrome [6]. Concentration fluctuations of salivary phosphate have been investigated as indicators of ovulation of women, uremic state, and risk of development of dental caries and formation of dental calculus [7]. All the mentioned information clearly shows that, analysis of phosphorous is considered as a biomarker for different diagnostic tests [5].
According to the literature review, concentration of phosphorous often varies between 0.2-10.0 mg L−1 in natural and wastewater samples and in the range of 0.2 to 50 mg kg−1 in soil [5]. In addition, maximum permissible concentration of phosphorous species in river and wastewater samples is estimated to be between 0.32 × 10⁻⁶ and 0.143 × 10⁻³ mol L−1, respectively [5]. As a diagnostic fluid, the concentration of phosphate ions in human saliva is usually found to vary between 5.0-14.0 mmol L−1 [8,9]. Whereas the concentration of phosphorous species is estimated between 0.81–1.45 mmol L−1 in the adult human serum [10,11]. Precise attention to these, the level of concentration of phosphorous in biological and environmental samples clearly points to the importance of introduction of accurate and sensitive methods for trace and ultra-trace phosphorous detection at both μg mL-1 and ng mL-1 levels.
During the last decades several analytical methods such as spectroscopy [12], potentiometry [13], voltammetry [14], chemiluminescence (CL) [15], immunoassay [15], and ion exchange chromatographic techniques [15] have been introduced for detection and determination of phosphorous in various real samples such as clinical, environmental, industrial, and biological samples. But most of these analytical techniques are often limited to low sensitivity, less improved detection limits, small sensitivity, negligible interference from real sample matrix, cost and/or fast response time for selective determination of phosphorous species [16-28]. Among these analytical techniques, CL can be considered as a promising detection system [15]. Compared to other analytical techniques [5] CL possesses significant advantages such as simplicity, low cost and high sensitivity and selectivity [5]. Consequently, CL-based detection has become considered as a quite useful and interesting technique for scientists in a wide variety of disciplines [29-31]. But in spite of great advantages of CLbased detection system, this technique has been still limited because of limitations such as low selectivity; small sensitivity and/or less improved detection limit [5]. These problems have not still completely solved even in the presence of catalytic reagents such as metal nanoparticles [5].
It seems that focusing on sample introduction can solve the current problems such as low selectivity; small sensitivity and less improved detection limit. Based on various types of sample introductions [32], nebulization seems to be considered as an appropriate method for direct introduction of samples by spraying process during the formation of aerosols.
Aerosols are defined as small solid or liquid particles suspended in the atmosphere for a period of a few hours to a few days depending on their size [33]. They have a complex chemical composition that mainly depends on their source, which may be natural and/or anthropogenic [33]. The interest to the molecular aerosols as large molecules with size distribution from sub nanometers to many microns has been increased significantly over the past few years [34]. This interest is due to the critical role in atmospheric/industrial processes, in air pollution where they pose health risks, and in astrophysical and astrochemical processes [34]. To improve the understanding of the impact of aerosols in these various fields, it is crucial to study their physical (size, shape, architecture, phase behavior), and chemical (composition, reactivity) properties, along with their formation processes such as aggregation, chemical reaction, agglomeration, and coagulation [34].
Most researchers efforts in aerosol characterization focus on physical properties such as size distributions [35]. Comparatively study on chemical properties of aerosol like chemical composition, thermodynamics, surface properties, spectral fingerprints, refractive index, etc. has been traditionally left behind [36]. To achieve a better understanding of the above-mentioned chemical properties of aerosol particles, it is necessary to have a fundamental study on single aerosol particles in different sizes, compositions, optical properties (absorbing or nonabsorbent), and surrounding environments using a highly capable technique [36].
During the last decades various researches have been focused on some physical and chemical properties of aerosols using optical trapping-cavity ring down spectroscopy (OT-CRDS) in combination with conventional aerosol characterization methods/techniques during the hygroscopic process [35]. In this work it is aimed to focus on a novel intrinsic behavior of hygroscopic growth factor of aerosols containing phosphorous compounds introduced to a novel OT-CRDS named as “Hygroscopy”, for their ultra-trace and trace detection and determination of at both ng mL-1 and μg mL-1 levels.
Experimental
Reagents
Stock solutions of 1000.0 μg mL-1 PO43-, PO23-, H2PO2− and P2O5(PO43-) were individually prepared by dissolving 1.885, 1.506, 0.675, and 0.7474 g of, Na2HPO4.12H2O (Merck, Darmstadt, Germany), Na3PO3.5H2O (Fluka), Ca(H2PO2)2 (Merck, Darmstadt, Germany) and P2O5 (Fluka), respectively, in 500 mL volumetric flask and diluted to the mark with deionized water. Standard solutions were prepared daily by successive dilution of the stock solutions. 500 mL solutions of different acids with pH 3.0 were prepared by dilution of each concentrated HCl (37%, Merck, Darmstadt, Germany), HNO3 (65%, Merck, Darmstadt, Germany), HClO4 (65% Merck, Darmstadt, Germany), acetic acid (100% Merck, Darmstadt, Germany) and H3BO3 (Fluka).
Instrumentation
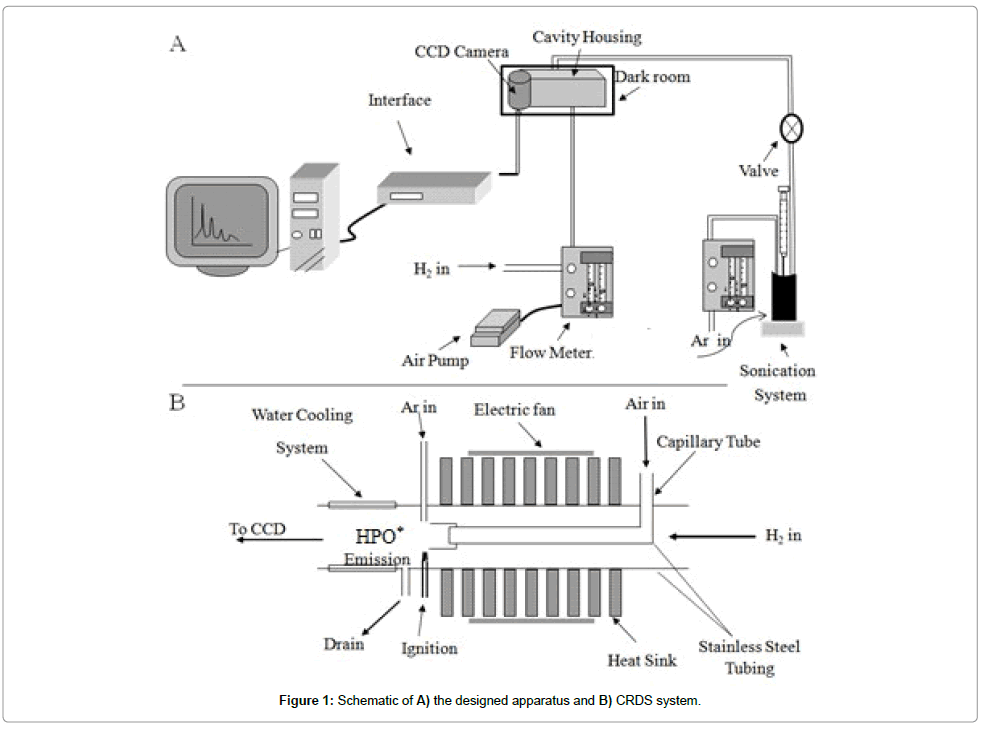
Detail of cavity ring down spectroscopy (CRDS) system is almost similar the molecular emission cavity analysis (MECA) system, described in the previous study [37]. In this experiment, some modifications are applied to the cavity in order to be used for phosphorous determination. The schematic of the modified cavity is shown in Figure 1. Briefly it consists of two concentric stainless steel tubes. The outer tube is 12.0 mm OD, 10.0 mm ID and the inner is a capillary tube with 3.0 mm OD tube. The end of the capillary tube is positioned 4.0 cm shorter from the inside tip of the outer tube. The inner capillary tube transfers air (air pump, model: pyeunicam ltd) and the outer carries hydrogen gas (H2 cylinder, Isfahan Petrochemical Company, purity: 99.996%). The flow of hydrogen and air is controlled using flow controllers. An ignition system is used for automatic ignition of the hydrogen/air flame. A drain is also located at the end part of the outer tube to transfer the generated water. To cool the cavity, small fans are used as shown in Figure 1A. The end part of the outer stainless steel tube is also cooled through water circulation. To introduce the samples into the flame, a reaction tubing cell with 20.0 mL volume is fabricated using glass. A sonicator (model: MIST MAKER, frequency: 500-KHz) is also positioned at the bottom of the reaction cell for the generation of aerosols. The generated aerosols are then carried to the flame through a tygon tubing (internal diameter: 3.0 mm) using N2 gas (N2 cylinder, purity: 99.9, Parsbaloon, Iran, Shiraz).
In this system, the blue emission of HPO* is monitored using a CCD camera. The CCD camera used as a detector is placed in front of the cavity. The cavity system was also placed inside a box (dark room, Figure 1B) to protect the system from any environmental stray lights. The image of the CCD is saved in a computer. The blue component of the color related to the chemiluminescence (CL) of phosphorous is analyzed for further processing using a program written in Visual Basic
For phosphorous speciation, an injection port is introduced for injection of phosphorous-containing compounds into the glass reaction cell (height: 12.5, diameter: 5.0). For phosphorous determination in the CRDS system using a stainless steel as the CL support. The phosphorouscontaining aerosols are directly introduced to the reaction cell during introduction of 3.0 mL of PO43- along with setting the flow rate of N2 as carrier gas to the cavity.
The temperature of the chemical reactions cell is controlled using an electric furnace surrounded the cell. The N2-bubbling reaction cell contains 20.0 mL of solution of HClO4 acid (pH=2.6) as well as 3.0 mL of solution unknown phosphorous determination. In this reaction cell, bubbled nitrogen is considered as carrier gas. Phosphorus-containing compound is introduced to this reaction cell through the injection port by a syringe using a septum. For turbidity analysis a turbidimeter (model: DRT-100) is adopted. The humidity of the system is also measured using a humidity sensor (model: GCH-2018).
Procedure
For phosphorus determination, a 3.0-mL sample container is halffilled with of HClO4 (pH=2.6). The temperature of the solution was set to 33°C using an electric furnace surrounded the reaction cell. The flow rates of hydrogen and air are controlled at 256 and 102 mL min-1, respectively. By injection of 3.0 mL of phosphorus solution into the vessel through the injection port, the generated phosphorus-containing aerosols are then swept into the cavity by a stream of N2.
Real sample analysis
The application of the recommended method is adopted for selective determination of phosphorus in various drinking water samples. For this purpose the sample preparation was achieved using the procedure reported in Ref [38]. Then the samples are individually diluted 10-time and determined using standard addition method. The reliability of these results is evaluated using ion exchange chromatography (IEC, model: ASI, 310).
Results and Discussion
“Hygroscopy” is the ability of a substance to attract and hold water molecules from the surrounding environment [34]. This property is achieved through either absorption or adsorption on the absorbing or adsorbing materials such as phosphorous species [39]. This property causes an increase in volume, stickiness, or other physical characteristics of the material, as water molecules become suspended among the material species in the process [39]. The quantity of this parameter is usually evaluated and estimated in a term called “Hygroscopic Growth Factor”. Atmospheric aerosols can scatter and absorb the incident light. Therefore the atmospheric visibility is reduced with the increase of their mass [39]. Furthermore, the visibility would sharply decrease when the ambient relative humidity (RH) is high at the same level of aerosol mass [39]. It seems that this factor can significantly promote the luminescent property of species such as phosphorous, even in a cool flame of H2/ air, especially when having water molecules as the product of the flame reaction. Therefore, it is expected to achieve major improvement in some figures of merit such as sensitivity and detection limit.
Among the current reported analytical techniques, “Cavity Ring- Down spectroscopy” (CRDS) seemed to be considered as selective and sensitive detection system for determination purposes. This method was also considered as a highly sensitive optical spectroscopic technique that enabled measurement of absolute optical extinction by samples that scatter and absorbed light. The CRDS has been widely used to study gaseous samples which absorb light at specific wavelengths, and in turn to determine mole fractions down to the parts per trillion levels [40-42]. Briefly a typical CRDS setup consisted of a laser that is used to illuminate a high-finesse optical cavity, in which its simplest form consists of two highly reflective mirrors. When the laser was in resonance with a cavity mode, intensity built up in the cavity due to constructive interference. The laser was then turned off in order to allow the measurement of the exponentially decaying light intensity leaking from the cavity [40-42].
In the CRDS system, the laser light was reflected back for about thousands of times between the mirrors giving an effective path length for the extinction on the order of a few kilometers. Some characteristics of this analytical technique included the independency of both the exponentially decaying light and the ring-down time from the fluctuations of the light source that caused to get accurate results during the detection purposes without any fluctuations [40-42]. These characteristics of the CRDS led to have significant advantages such as
i) high sensitivity due to the multi-pass nature (i.e., long path length) of the detection cell,
ii) possibility to shot variations in laser intensity during the measurement in a fixed rate constant,
iii) wide range use for a given set of mirrors; typically, ± 5% of the center wavelength,
iv) high throughput because of the individual ring down events, occurred in the millisecond time scale and
v) finally, no need for a fluorophore.
which made it more attractive for some techniques such as rapidly pre-dissociating. However, this method had disadvantages [40-42]. For instance, the spectra could not be acquired quickly due to the use of a monochromatic laser source. Also, analytes were limited only to the availability of tunable laser light at the appropriate wavelength as well as the availability of high reflectance mirrors at those wavelengths and iii) high expense. The requirement for laser systems and high reflectivity mirrors often made CRDS orders of magnitude more expensive than some alternative spectroscopic techniques [40-42].
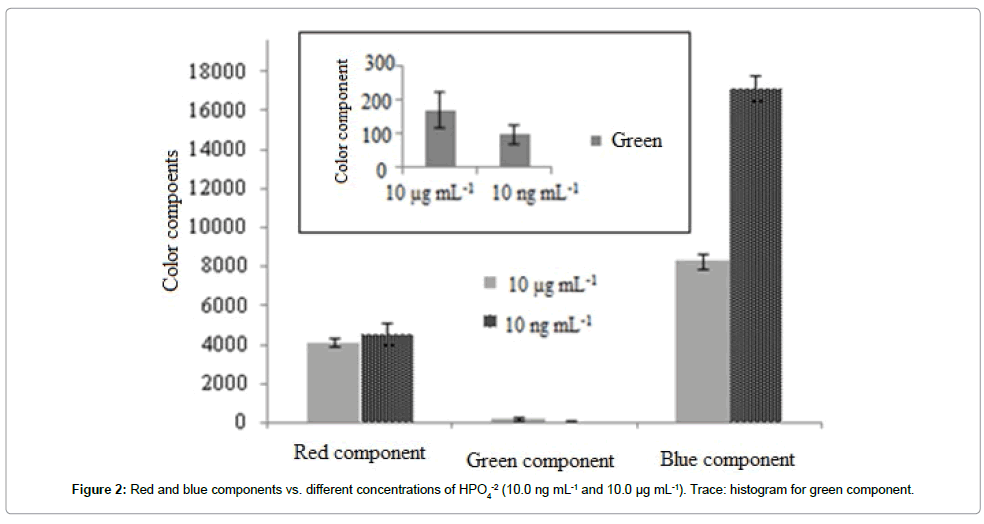
To solve these problems, hereby in this study for the first time a new, simple, sensitive and selective methodology has been introduced for trace and ultra-trace detection of phosphorous in various real samples without needing any external laser. In another word, presence of trace amount of Na+ as radiation buffer in the matrix of the sample solution provided the capability for playing role as initial light source during evaluation of the intensity of scattering throughout the determination process via the formation of aerosol. This detection system was based on the observation of blue emission (instead of green phosphorous emission) during the introduction of phosphorous samples to the analyzing volume via formation of aerosols. As shown in Figure 2 the RGB components for 10.0 ng mL-1 and 10.0 μg mL-1 of PO43- clearly revealed the blue component obvious. This detection system was therefore considered as an appropriate detection system for phosphorous detection and determination.
As shown in Figure 2, the green component can be attributed to the molecular emission of phosphorus species. As expected, the green component for 10.0 μg mL-1 (green component=171 a.u.) phosphorus species was more intensive than that for 10 ng mL-1 (green component=98 a.u.). Also, the red component can be attributed to the emission intensity of sodium introduced to the flame during phosphorous analysis. As evaluated partially, the same red components were detected during introduction of PO43- (from Na2HPO4) with 10.0 ng mL-1 and 10.0 μg mL-1. Unexpectedly, the intensity of the blue component for 10.0 ng mL-1 was significantly higher than that of 10.0 μg mL-1.
To interpret this phenomenon the influence of aerosols was evaluated in detail. For this purpose, aerosols containing phosphorous species were often generated via ultrasonically irradiation using a water humidifier (frequency: 500 KHz), followed by transferring into the analyzing system (CRDS) using N2 as carrier gas.
Parameters having strong influence during following luminescence and scattering of the generated aerosols as well as during their hygroscopic growth inside the humidified flame (H2/air) were the amount of Na+ as radiation buffer (initial light source(, flow rates of H2, air and N2 gases, kind and concentrations of acid during formation, introduction and evaluation of the aerosols inside flame, etc. These parameters should be well optimized to reach the highest sensitivity for HPO* emission on the stainless steel as support during introduction of phosphorous species through the port to the reaction cell. In this study, the optimization process was achieved using both one at a time and simplex methods as reported in detail in the supporting information 1.1 (Sections: 1.1. S.P.-1.3. (S.P.)).
Effect of Na+ as radiation buffer
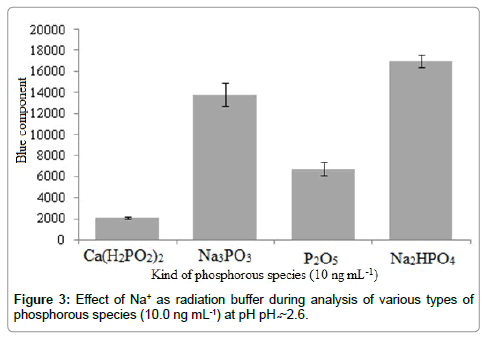
In this study, it was observed that no significant light emission was detected in the absence of alkali ions such as Na+ during only analysis of ultra-trace phosphorous species. The phenomenon was clearly evidenced when preparing phosphorus solution using phosphorus salts such as Ca(H2PO2)2 or P2O5 according to the histogram shown in Figure 3.
As phosphorus pentoxide was a chemical compound with molecular formula P4O10, this white crystalline solid reagent was the anhydride of phosphoric acid. Phosphorus pentoxide was therefore a potent dehydrating agent as indicated by the exothermic nature of its hydrolysis (Eq. 1.). In fact, both phosphorus salts using each P2O5 and NaH2PO4 reagents in aqueous media produced the same anion. This can be considered as suitable probe during using the effective role of Na+ as radiation buffer. It seemed that Na+ radiation with (wavelength=589.0 nm) played role as initial light source (pulsed laser), which made it as low cost and excellent module for phosphorus determination during several reflections between the aerosols inside the flame that acted as mirrors. This effect was attributed to the interaction between hydrogen radicals and Na+ (as radiation buffer) during scattering process according to the following reactions based on the Le Chatelier's principle (Eqs. 2 and 3). Therefore, trace quantity of sodium metals (with zero oxidation state) played role as the source of light at λmax of 589.0 nm. It should be noted that this effect was dependent to the H2 flow rates. At high H2 flow rates from one side, high concentrations of radical hydrogen reduced Na+ to the metallic form in the analyzing volume. From the other side, the temperature of the flame became so high that the generated sodium metal was oxidized inside the bulk solution in the flame. Consequently, competition between the other two factors (temperature and reducing behavior of the flame) determined the sensitivity of the system during analysis of ultra-trace of phosphorous species by scattering process.
P4O10+6H2O → 4H3PO4 (–177 kJ) (Eq. 1)
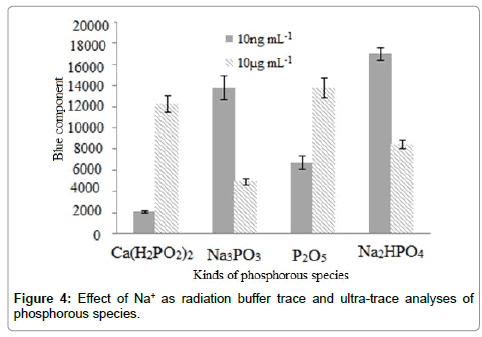
It be also noted that due to the necessity of the ring-down spectroscopy to an initial light source during the scattering process, trace amount of Na+ (~ 5 μg) was needed. This low quantity also prevented the light interfering effect of the sodium-containing impurities during the analysis of ultra-trace of phosphorous species using image processing. However this effect was further limited due to the high acidic environment of the solution (pH: 2.6) according to the Le Chatelier's principle based on Eq. 2. In addition, Figure 4 compares the emission and scattering. As clearly shown, during analysis of phosphorous species with 10.0 μg mL-1 concentration, the emission was predominant. But during ultra-trace determination of phosphorus species (10.0 ng mL-1) reverse sensitivities (blue component intensity) were detected due to the presence of Na+ in some phosphorous species (Na3MPO3, and Na2HPO4).
Na++H0 → Na*+H+ in the bulk solution (Eq. 2)
Na* → Na+hν (Eq. 3)
In this study, selection of Na+ as radiation buffer was attributed to its emission wavelength (λmax=589.0 nm), which was partially in the middle of the visible light range. For more evaluation of this phenomenon, the effect of Na+ was compared to that of K+ (λmax=766 nm). Based on result, no significant response was observed when K+ was used instead Na+. This phenomenon was probably due to wavelength emission of potassium that was shifted to red. Therefore Na+ solution was considered as the selective radiation buffer during the detection of the phosphorous emission radiations.
Chemical stability of the phosphorous solution
For investigating the stability of the phosphorous solutions, effect of some species such as ethylene diamine tetra acetic acid (EDTA) was also investigated. For this purpose, 3.0 mL of EDTA solution (1.0 mM) at pH ~2.6 was added to phosphorous standard solution (10.0 μg mL-1). Based on the results no significant change was observed in the results during the analysis in the presence and absence of EDTA. This result clearly revealed the stability of the phosphorous standard solutions during the analyses.
Proposed mechanism of the detection system
The mechanism of the radiation (Mie scattering) was also evidenced based on briefly
i) dependency of the scattered intensity to the presence of Na+,
ii) relationship between the scattered and both the humidity of the detection system,
iii) good correlation between the response of the cavity with turbidimetry,
iv) observation of blue shift from green (emission light related to the luminescence of HPO* in H2/air flame) to blue (scattered radiation) and
v) the effect of hydration number during stability and growth of the aerosols [39] inside the flames.
Details of these evidences are as follows:
As among the geometrical shapes sphere has minimum surfaceto- volume ratio therefore, maximum surface tension was estimated for sphere in comparison with other geometries. Consequently, aerosols intrinsically tend to have spherical shape. In many optical studies of aerosols, particles can be assumed to be spherical in shape, allowing the application of Mie scattering theory [34]. A Mie resonance often exhibits more than one maximum in the radial distribution of the light intensity within the droplet [34]. If the levitated particle is a homogeneous liquid droplet, then the light-scattering pattern consists of a parallel fringe structure (Mie scattering) [34]. This phenomenon was observed during analysis of phosphorous species at ng mL-1 levels.
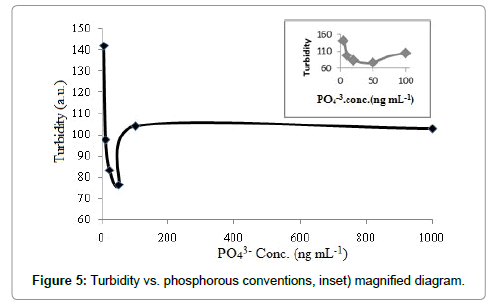
Good correlation as well as the same behavior was obtained between the results of the CRDS and the turbidimetry. The results are shown in Figure 5. It should be noted that due to low precision, small sensitivity, no linearity as well as presence of high interference, turbidimetry cannot be adopted for detection of phosphorous species instead of CRDS. Consequently, turbidimetry as the detection system was only used to approve the scattering phenomenon.
Phosphorus species like any other salt had tendency to hydration. This phenomenon, therefore, changed the size and thickness of the hydrated layer [39]. This effect also converted the hygroscopic growth factor, and thus changing in the scattering and turbidity.
In the H2/air flame, H2O was considered as a product according to the flowing reactions (Eqs. 4 and 5). Based on these results, aerosols containing compounds such as phosphorus species provide the ability to absorb H2O molecules from surrounding environment their size is larger [39]. The main reason for this was that the mass scattering efficiency of aerosols would increase when water soluble aerosols grow to become larger in diameter. Consequently, at low concentrations the scattering phenomenon was majorly occurred in comparison with luminescence radiation. This phenomenon can also be interpreted somewhat like the formation of crystal salts in a supper saturated solution. The lower concentration of salts, the larger crystalline size is generated; therefore, larger aerosols (i.e., more hydration no.) are expected from diluted phosphorous species.
H2+O2 → 2OH (Eq. 4)
H2+OH· → H·+H2O (Eq. 5)
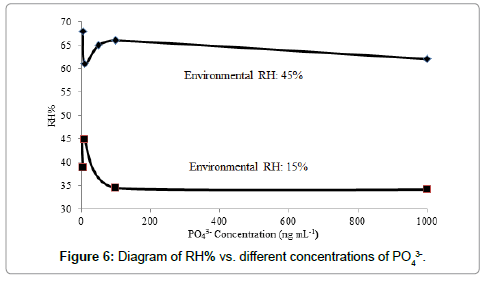
A reverse correlation was observed between the relative humidity percentage (RH%) and concentrations of PO43- at ng mL-1 levels in different environments such as about 15 and 45% RH according to the results shown in Figure 6. This behavior again pointed to the effective role of hygroscopic growth factor during scattering the phosphorous species inside H2/air flame, which generated water as the product of the reaction between hydrogen and oxygen (Eqs. 4 and 5). This result was in good agreement with the results obtained during estimation of the scattering radiation using instruments such as online forward-scatter visibility meter, integrating nephelometer and multi-angle absorption photometer [39].
Hygroscopic growth factor was also defined as the ratio of aerosol scattering coefficient, f(RH) at wet condition to that at dry condition (RH ≤ 30%) according to the equation reported in Ref. [39]. In this system, based on the results shown in Figure 6, the RH% of the two different conditions (RH% 15 and 45) was found to be 1.36, which pointed to the effective role of the environmental RH%. This factor was considered as aerosol particle backscatter coefficient, which was dependent on the size and morphology of the aerosols particles [43]. The relationship between the hygroscopic growth effects and the aerosol volume concentration was evaluated by observing a stronger increase in the fine mode volume concentration of the phosphorous-containing aerosols during increase in the quantity of RH% inside the H2/air flame.
The relationship between the size of aerosols and the phosphorous concentration can also be evaluated via following the hydration number of the phosphorous species. In this study, the same behavior can be observed for phosphorous species inside a humid flame generated using H2 and O2. However, hydration number of phosphorus aerosol can be discussed using the extended Debye-Hückel equation using the parameter called “mean distance approach of the hydrated ions”. Based on this term, the thicker the hydrated layer of phosphorus species, the more was the activity coefficient and the higher was the activity of phosphorus species.
The intensity of the scattered light was independent from that proposed by Saha equation [44]. The Saha ionization equation was an expression that relates the ionization state of an element to the temperature and pressure. In this study the Saha equation described the degree of ionization of the atomizer as a function of the temperature, density, and ionization energies of the species [45]. If Saha ionization occurred, the amount of emission would increase a little. However the Saha equation only held weakly ionized plasmas for in which the Deby length was large [46,47]. The independency of the scattered light with the Saha phenomenon was evidenced via observation of no significant response during independently analysis of inorganic species such as Na+, K+ or H3PO4. Consequently, this phenomenon clearly pointed to the presence of strong interaction between Na+ and phosphorous species during introduction of aerosols to the H2/air flame.
Based on this principle, trace quantity of Na+ ions as radiation buffer was stabilized inside the flame and played a role such as the incident laser light for scattering process, resulting to get blue radiation instead of green chemiluminescence of phosphorous species or even the emission of Na+/Na inside the flame. All these evidences pointed to the effective role of a parameter called hygroscopic growth factor during formation of aerosols.
Analytical figures of merit
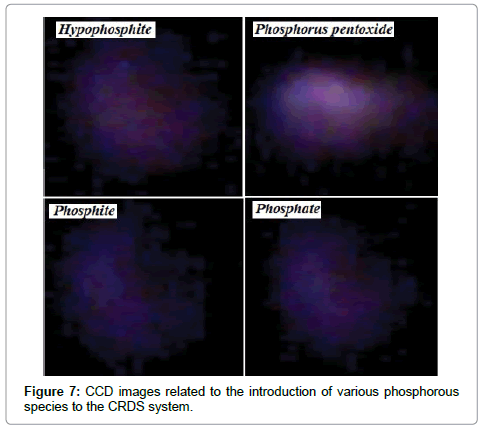
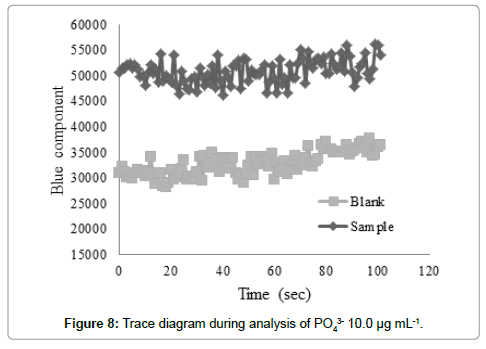
Figure 7 exhibits the CCD images related to the introduction of various phosphorous species to the CRDS system. Figure 8 shows sample trace diagram during analysis of po43- (10.0 μg mL-1) during the image analysis. The calibration curves had also been shown in Figure 9. As shown, the calibration curves had two significant linear ranges. Based on the calibration curve, sensitivity with positive slope was observed in the emission intensity depending on the concentration of phosphorus species at μg mL-1 levels during both scattering and luminescence phenomena. Whereas reverse behavior was exhibited during analysis of phosphorous compounds at ng mL-1 levels by the scattering phenomena. Based on the literature, this was related to the “Aerosol Hygroscopic Growth Factor” [39]. Two linear calibration curves with reverse slope was therefore observed between 10.0 – 250.0 ng mL-1 and 1.0 – 20.0 μg mL-1 with correlation coefficients (R2) of 0.998 and 0.999, respectively (Figure 9). The calibration sensitivity was also estimated to be 0.348 and -57.46 (a.u.), respectively.
The detection limit was defined as the concentration of phosphorous species giving a signal equal to the blank signal plus triple values of the standard deviation of the blank. Based on this definition, the limit of detection was found as 5.0 ng mL-1.
The relative standard deviation (RSD%, reproducibility) for 5 replicate analyses for each 10.0 ng mL-1 and 10.0 μg mL-1 PO43- wasfound to be 12.0 and 11.0%, respectively. Based on the definition of the response time, 90% of maximum response (t90), the maximum response time was evaluated to be ~10.0 s. Table 1 shows analytical figures of merit during phosphorus detection and determination.
| Linear dynamic range | Correlation coefficient (R) | Calibration sensitivity | RSD (%) | Detection limit (ng mL-1) |
|---|---|---|---|---|
| PO43- (1-20 µg mL-1) | 0.998 | 0.348 | 11.0 | - |
| PO43- (10-250 ng mL-1) | 0.999 | -57.46 | 12.0 | 5 |
Table 1: Analytical figures of merit during phosphorus detection and determination. Note: The data are the average of 70 sequential analyses.
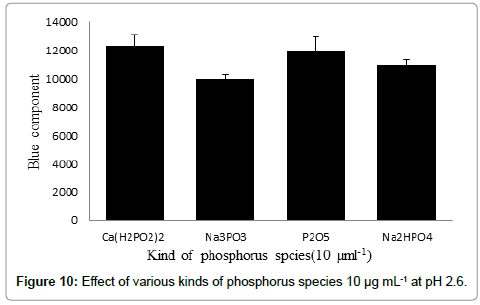
Figure 10 compares the HPO* emissions measured during the intro of 3.0 mL of each phosphorus in 10.0 μg mL-1 solution to the reaction cell containing 20.0 mL HClO4 at pH 2.6. As shown partially the same emission intensity was detected during introduction of 10.0 μg mL-1 of each phosphorous species such as Na2HPO4 (RSD=4.3%,n=28), Na3PO33 (RSD%=6.1%, n=37), Ca(H2PO2)2(RSD=6.1%, n=38),and P2O5 (RSD=6.8%, n=40) at pH ~2.6.
No serious interference was evaluated during analysis of at least 500-fold excess of various anions such as CH3COO−, Cl-, Br-, ClO4-,I-, CN-, CO32-, NO3-, I3- and various cations such as, NH4+, Na+, Fe3+,K+, Ni2+, CO2+, Ca2+ to a 10.0 μg mL-1 and 10.0 ng mL-1 of phosphate standard solution. The results are reported in Table 2. The only observed interference was evaluated during introduction of 200-fold excess of SO42-. These results clearly pointed to the selectivity of the recommended technique for rapid and sensitive determination of phosphorous species in various real samples without any interfering effects.
| Foreign species | Tolerance ratio | Interfering effect (%) | Comments |
|---|---|---|---|
| CH3−, Cl-, Br-, ClO4-, I-, CN-, COO-, CO32- | 1000 | No interference | -No interaction with phosphorus species-Not emission radiation |
| NO3- | 500 | ~3% enhancement | -No interaction with phosphorus species-Low emission radiation |
| K+, Co2+ | 500 | No interference | -No interaction with phosphorus species-Not emission radiation |
| NH4+ | 1000 | No interference | -No interaction with phosphorus species-Not emission radiation |
| Ca2+ | 500 | No interference | interaction with phosphorus species and formation precipitate Calcium phosphate (KSP=2.07×10⁻³³) |
| Fe3+ | 500 | No interference | interaction with phosphorus species and formation precipitate iron phosphate (KSP=1.3×10⁻²²) |
| Ni2+ | 500 | No interference | interaction with phosphorus species and formation precipitate nickel phosphate (KSP=4.74×10⁻³²) |
| SO42- | 200 | ~20% Enhancement | Molecular emission of sulfur |
Table 2: Effect of foreign species on phosphorus determination.
Real sample analyses
The reliability of this method was evaluated via selective determination of phosphorus in various drinking water samples according to the recommended preparation procedure. For this purpose standard addition method was used during the analyses of some drinking water samples. The results are reported in Table 3. As shown good correlation was evaluated between the results obtained from this technique and ion exchange chromatography during analysis of drinking water samples that clearly revealed the reliability of this method for detection and determination of species such as phosphorus compounds.
| Methods | Analyzed sample | Linear range | Detection limit | Reference |
|---|---|---|---|---|
| Spectrophotometry | Seawater | 0.034-1.134 µM(3.213-107.163 ng mL-1 ) | 1.4 nM(0.1323 ng mL-1) | [48] |
| Fluorimetry | River and marine waters | 0.3-4.0 µM(28.35-378 ng mL-1) | 0.3 µM(28.35 ng mL-1) | [49] |
| Spectrophotometry | Wastewater | 0.026-0.485 mM(2475-45832 ng mL-1) | 7.4 µM(699.3 ng mL-1) | [50] |
| Electrochemiluminescence | Water | 2.0×10⁻¹⁰-1.0× 10⁻⁸gmL-1(0.2-10 ng mL-1) | 8.0×10⁻¹¹ gmL−1(0.08ng mL-1) | [36] |
| Electrochemistry | Human serum sample | 1.0×10⁻⁶- 100.0×10⁻⁶mol L-1 (94.5-945000 ng mL-1) | 3×10⁻⁶mol L-1(283.5 ng mL-1) | [51] |
| Ion exchange chromatography | Drug product | 2-200 µg mL-1 (2000-200000 ng mL-1) | 1µg mL-1 (1000 ng mL-1) | [52] |
| Present study | Drinking water | 10.0-250.0 ng mL-1 and 1.0-20.0 µg mL-1or (1000-20000 ng mL-1) | 5.0 ng mL-1 | This work |
Table 3: Real sample analysis. Where, 1Ion exchange chromatography was considered as Ref. method [47].
Conclusions
In this study, a new method has been introduced based on aerosol hygroscopic growth as a new factor for trace and ultra-trace determination of phosphorus in flame containing OT-CRDS. The advantages and disadvantages of the technique for phosphorous determination have been compared to the articles shown in Table 4. Compared to these reports, this technique has significant characteristics such as high sensitivity, high selectivity, capability to determine phosphorus compounds in a wide range between 10.0 - 250.0 ng mL-1 and 1.0 to 20.0 μg mL-1 with improved detection limit, simplicity, and low cost. To the best of our knowledge this study is the first report that Mie scattering is followed for determination purposes using a simple design of OT-CRDS.
| Electrochemistry | Human serum sample | 1.0×10⁻⁶- 100.0×10⁻⁶mol L-1 (94.5-945000 ng mL-1) | 3×10⁻⁶mol L-1(283.5 ng mL-1) | [51] |
|---|---|---|---|---|
| Ion exchange chromatography | Drug product | 2-200 µg mL-1 (2000-200000 ng mL-1) | 1µg mL-1 (1000 ng mL-1) | [52] |
| Present study | Drinking water | 10.0-250.0 ng mL-1 and 1.0-20.0 µg mL-1or (1000-20000 ng mL-1) | 5.0 ng mL-1 | This work |
Table 4: Comparison between the introduced method and the previously reported method.
Acknowledgements
The authors wish to acknowledge the support of this work by the Shiraz University Research Council.
References
- Bao XP, Zhou YH, Yu JH (2010) N-Salicyloyltryptamine: An efficient fluorescent turn-on chemosensor for F− and AcO− based on an increase in the rigidity of the receptor. Luminescence 130: 392-398.
- Kaur N, Kaur S, Kaur A, Saluja P, Sharma H, et al. (2014) Nanoparticle-based, organic receptor coupled fluorescent chemosensors for the determination of phosphate. Luminescence 145: 175-179.
- Worsfold PJ, Gimbert LJ, Mankasingh U, Omaka ON, Hanrahan G, et al.(2005) Sampling, sample treatment and quality assurance issues for the determination of phosphorus species in natural waters and soils.Talanta 66: 273-293.
- Mulkerrins D, Dobson A, Colleran E(2004) Parameters affecting biological phosphate removal from wastewaters. Environment International 30: 249-259.
- Berchmans S, Issa TB, Singh P(2012) Determination of inorganic phosphate by electroanalytical methods: A review. Anal Chim Acta 729: 7-20.
- Kawasaki H, Sato K, Hasegawa JOY, Yuki H (1989) Determination of inorganic phosphate by flow injection method with immobilized enzymes and chemiluminescence detection. Anal Biochem 812: 366-370.
- Kwan RCH, Leung HF, Hon PYT, Cheung HCF, Hirota K, et al.(2005) Amperometric biosensor for determining human salivary phosphate. AnalBiochem 343: 263-267.
- Larsen MJ, Jensen AF, Madsen DM, Pearce EI(1999) Individual variations of pH, buffer capacity, and concentrations of calcium and phosphate in unstimulated whole saliva.Archiv Oral Biolog 44: 111-117.
- Tobey SL,Anslyn EV(2003) Determination of inorganic phosphate in serum and saliva using a synthetic receptor. Organic Lett 5: 2029-2031.
- Carey C, Vogel G(2000) Measurement of calcium activity in oral fluids by ion selective electrode: method evaluation and simplified calculation of ion acitivity products. ResNationInstitStandard Technol 105: 267-274.
- Gutiérrez OM, Isakova T, Enfield G, Wolf M(2011) Impact of poverty on serum phosphate concentrations in the third national health and nutrition examination survey. Renal Nutrition 21: 140-148.
- Mesquita RBR, Ferreira MTSOB, Tóth IV, Bordalo AA, McKelvie ID, et al.(2011) Development of a flow method for the determination of phosphate in estuarine and freshwaters-Comparison of flow cells in spectrophotometric sequential injection analysis. Anal Chim Acta 701: 15-22.
- Davey DE, Mulcahy GR (1990) O'Connell, Flow-injection determination of phosphate with a cadmium ion-selective electrode.Talanta 37: 683-687.
- GalePhA, Hursthouse MB, Light ME, Sessler JL, Warriner CN, et al.(2001) Ferrocene-substituted calix 4 pyrrole: a new electrochemical sensor for anions involving CHâ?Ż anion hydrogen bonds. Tetrahedron Lett 42: 6759-6762.
- Lara FJ, García-Campaña AM, Aaron JJ(2010) Analytical applications of photoinduced chemiluminescence in flow systems-A review. Anal Chim Acta 679: 17-30.
- Grabner EW, Vermes I, König KH(1986) A phosphate-sensitive electrode based on BiPOmodified glassy carbon. ElectroanalChemInterfElectrochem 214: 135-140.
- Quintana JB, Rodil R, Reemtsma(2006) Determination of phosphoric acid mono-and diesters in municipal wastewater by solid-phase extraction and ion-pair liquid chromatography-tandem mass spectrometry. Anal Chem 781: 644-1650.
- Zyryanov GV, Palacios MA, Anzenbacher P(2007) Rational Design of a Fluorescenceâ?Turnâ?On Sensor Array for Phosphates in Blood Serum. AngewandtChemInternation 46: 7849-7852.
- Zhang JZ, Chi J(2002)Automated analysis of nanomolar concentrations of phosphate in natural waters with liquid waveguide.Environmen SciTechnol 36: 1048-1053.
- Gilbert AT Jenkins S, Browning S (2009)Development of an amperometric assay for phosphate ions in urine based on a chemically modified screen-printed carbon electrode. Anal Biochem 393: 242-247.
- De Marco R, Clarke G, Pejcic B(2007) Ionâ?Selective Electrode Potentiometry in Environmental Analysis.Electroanal 19: 1987-2001.
- Parra A, Ramon M, Alonso K, ShLemos G, Vieira EC (2005)Nogueira, Flow injection potentiometric system for the simultaneous determination of inositol phosphates and phosphate: phosphorus nutritional evaluation on seeds and grains.Agricultur Food Chem 53: 7644-7648.
- Ganjali MR, Norouzi P, Qomi M,Salavati-Niasari(2006) Highly selective and sensitive monohydrogen phosphate membrane sensor based on molybdenum acetylacetonate. AnalChim Acta 567: 196-201.
- Akyilmaz E, Yorganci E(2007) Construction of an amperometric pyruvate oxidase enzyme electrode for determination of pyruvate and phosphate.Electrochim Acta 52: 7972-7977.
- Kwan RCH, Leung HF, Hon PYT, Barford JP, Renneberg R(2005) A screen-printed biosensor using pyruvate oxidase for rapid determination of phosphate in synthetic wastewater. ApplMicrobiolBiotechnol 66: 377-383.
- Villalba MM, McKeegan KJ, Vaughan DH, Cardosi MF, Davis J(2009) Bioelectroanalytical determination of phosphate: A review. MoleculCatal B: Enzym. 59: 1-8.
- Preechaworapun A, Dai Z, Xiang Y, ChailapakulO, Wang J(2008) Investigation of the enzyme hydrolysis products of the substrates of alkaline phosphatase in electrochemical immunosensing. Talanta 76: 424-431.
- Mousty Ch, Cosnier S, Shan D, MuSh(2001) Trienzymatic biosensor for the determination of inorganic phosphate. Anal Chim Acta 443: 1-8.
- Gámiz-Gracia L, García-Campaña AM, Huertas-Pérez JF, Lara FJ(2009) Chemiluminescence detection in liquid chromatography: Applications to clinical, pharmaceutical, environmental and food analysis-A review. AnalChim Acta 640: 7-28.
- García-Campaña AM, Lara FJ,Gámiz-Gracia L, Huertas-Pérez JF(2009) Chemiluminescence detection coupled to capillary electrophoresis. TrAC Trend. AnalChem 28: 973-986.
- Liu M, Lin Z, Lin JM(2010) A review on applications of chemiluminescence detection in food analysis. Anal Chim Acta 670: 1-10.
- Browner RF, Boorn AW(1984) Sample introduction techniques for atomic spectroscopy. AnalChem56: 875A-888A.
- Signorell R, Reid JP(2010) Fundamentals and Applications in Aerosol Spectroscopy. CRC Press.
- Kulkarni P, Baron PA, Willeke K(2011) Aerosol Measurement: Principles, Techniques, and Applications. John Wiley and Sons.
- Tang Y, Huang Y, Li L, Chen H, Chen J, et al.(2014) Characterization of aerosol optical properties, chemical composition and mixing states in the winter season in Shanghai, China. Environment Sci 26: 2412-2422.
- Ashkin A, Dziedzic J (1975) Optical levitation of liquid drops by radiation pressure. Science 187: 1073-1075.
- Doroodmand MM, Shafiee Z(2014) Design of a new flame-containing molecular emission cavity for speciation of sulfide, sulfite, sulfate, thiosulfate and thiocyanate in wastewater: catalytic behaviour of hydrogen ion.Internation J Environment Anal Chem 94: 1223-1242.
- Masson P, Morel Ch, Martin E, Oberson A, Friesen D(2001) Comparison of soluble P in soil water extracts determined by ion chromatography, colorimetric, and inductively coupled plasma techniques in PPB range. CommunicatiSoil Sci Plant Anal 32: 2241-2253.
- Liu X, Gu J, Li Y, Cheng Y, Qu Y, et al. (2013)Increase of aerosol scattering by hygroscopic growth: Observation, modeling, and implications on visibility. Atmosphere Res 132: 91-101.
- Stelmaszczyk K, Fechner M, Fechner M, Rohwetter P, Queiber M, et al.(2009) Towards supercontinuum cavity ring-down spectroscopy. Appl Phys B 94: 369-373.
- Stelmaszczyk K, Rohwetter Ph, Fechner M, Queiber M, CzySewski A, et al.(2009) Cavity ring-down absorption spectrography based on filament-generated supercontinuum light. Optics express 17: 3673-3678.
- Nakaema WM, Hao ZQ, Rohwetter Ph, Wöste L, Stelmaszczyk K (2011) PCF-based cavity enhanced spectroscopic sensors for simultaneous multicomponent trace gas analysis. Sensors 11: 1620-1640.
- Granados-Muñoz MJ, Navas-Guzmán F, Bravo-Aranda JA, Guerrero-Rascado JL, Lyamani H, et al. (2014)Hygroscopic growth of atmospheric aerosol particles based on active remote sensing and radiosounding measurements. Atmosphere MeasurTechniqu Discuss 7: 10293-10326.
- Saha MN (1920) Ionization in the solar chromosphere, London Edinburgh Dublin Philosophical Magazin. J Sci40: 472-488.
- Fridman A(2008) Plasma Chemistry. Cambridge University Press.
- van de Sanden MCM, Schram PPJM, Peeters AG, van der Mullen JJAM, Kroesen GMW(1989) Thermodynamic generalization of the Saha equation for a two-temperature plasma. Phys Rev A 40: 5273
- Ruiz-Calero V, Galceran M(2005) Ion chromatographic separations of phosphorus. species: a review.Talanta 66: 376-410.
- Ma J, Yuan D, Liang Y(2008) Sequential injection analysis of nanomolar soluble reactive phosphorus in seawater with HLB solid phase extraction. Marin Chem 111: 151-159.
- Frank C, Schroeder F, Ebinghaus R, Ruck W(2006) A fast sequential injection analysis system for the simultaneous determination of ammonia and phosphate. Microchimica Acta 154: 31-38.
- Mas F, Muñoz A, Estela JM(2000)Estela Simultaneous spectrophotometric determination of phosphate and silicate by a stopped-flow sequential injection method. International Journal of Environmental Analytical Chemistry 77: 185-202.
- RahmanMd, Park DS, Chang S, McNeil CJ, Shim YB (2006) The biosensor based on the pyruvate oxidase modified conducting polymer for phosphate ions determinations.BiosensBioelectron 21: 1116-1124.
- Samy R, Faustino PJ, Adams W, Yu L, Khan MA, et al. (2010) Development and validation of an ion chromatography method for the determination of phosphate-binding of lanthanum carbonate.Pharmaceut Biomed Anal 51: 1108-1112.
Relevant Topics
Recommended Journals
Article Tools
Article Usage
- Total views: 3074
- [From(publication date):
June-2017 - Apr 03, 2025] - Breakdown by view type
- HTML page views : 2225
- PDF downloads : 849

