A Ten Years Household Fish Catch Monitoring Study in the Xe Bangfai River (Lao PDR): Assessment of Fisheries Evolution before and after the Start of Nam Theun 2 Hydropower Operations
Received: 27-Nov-2018 / Accepted Date: 24-Dec-2018 / Published Date: 31-Dec-2018 DOI: 10.4172/2332-2608.1000286
Abstract
Changes in fisheries in the Xe Bangfai River (Lao PDR) were assessed thanks to a fish catch monitoring program implemented for a ten-year period. Household fish catches were collected before and after the start of hydro-power operations of the Nam Theun 2 project in 2010. Data underlined a succession of three periods that consisted in (i) a long term pre-project decline in the fish catch, (ii) a second period defined as an immediate project related decline in the catch to finally reach (iii) the third period where changes in the catches are better influenced by climatic conditions or likely caused by other factors like the increase in commercial fishing, cumulative effects of increased development and water management in the Xe Bangfai and wider Mekong basin. Followed indicators underlined a decline in the household catch in the mainstream river of 19% (vs. 40-60% predicted), no impact on species composition and little variation in income with an increase of this last indicator since the operation. Finally, it is encouraging to note that catch trends post-operation are not merely pointing at a continuing decline. This shows ecological resilience and that fisheries still are a viable livelihood and continues to offer access to high value protein for riparian households.
Keywords: Fish catches; Hydropower project; Downstream river; Riparian household; Impact assessment
Introduction
The Mekong basin is known for its high hydropower potential. The number of hydropower projects has been estimated at 200 in the “Greater Mekong Sub-region” area, which includes Thailand, Cambodia, Myanmar, Vietnam, Yunnan Province (China) and Lao PDR [1]. Although many projects are contractually obligated to perform an Environmental Impact Assessment (EIA) and conduct studies after Commercial Operations Date (COD) to assess changes in environmental parameters, results from such long-term monitoring of downstream impacts are only rarely published. Changes in the fisheries in newly created reservoirs after impoundment is widely reported [2-5]. Downstream effects are much less studied and, in most cases, studies refer to impacts of dams on the rivers that are impounded [6-8]. In those cases, blocking of migration routes, changes in hydrological connectivity between aquatic habitats, both in space and time and changes to the sediment load, water quality, and hydrology, seem to be the main factors that affect fish bio-diversity and fisheries [9-13].
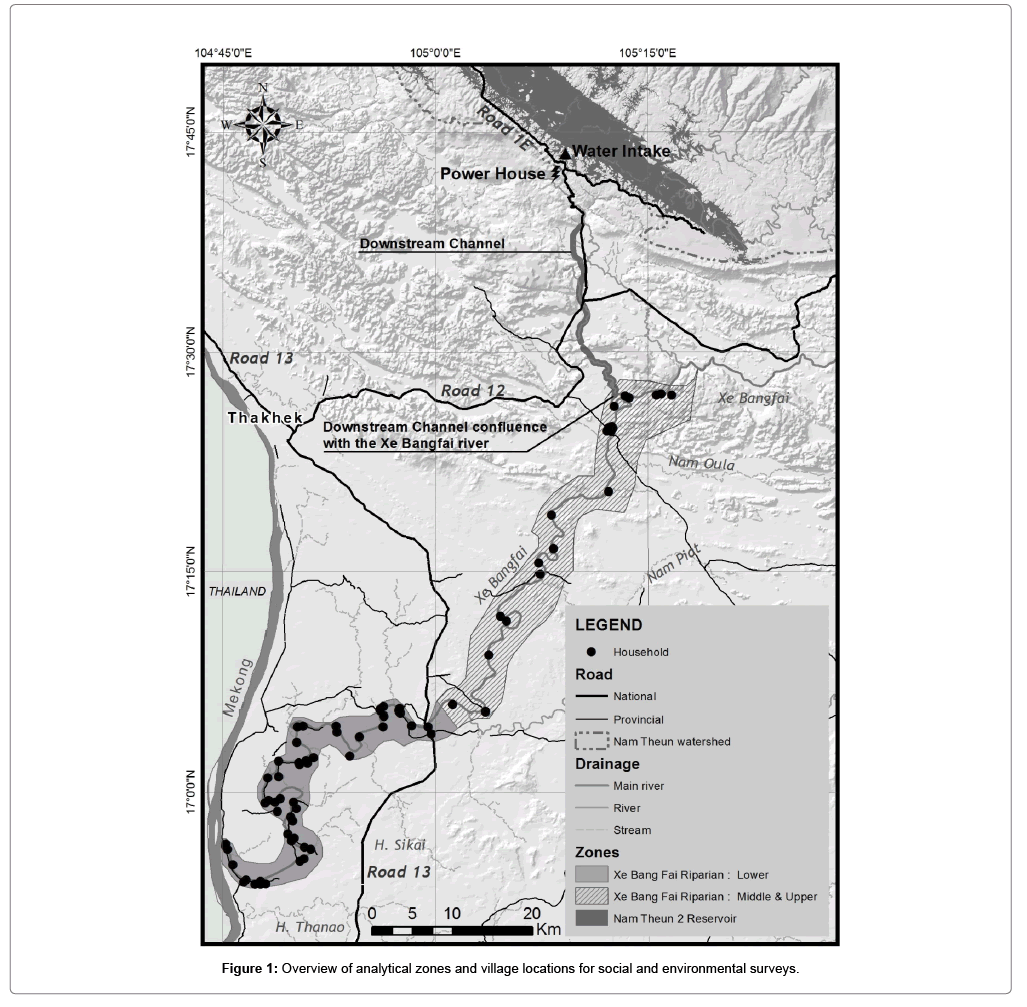
The Nam Theun 2 (NT2) Project is a trans-basin hydropower scheme located in the Mekong Basin, Lao Peoples Democratic Republic (PDR), Khammouane Province (Figure 1). Its main characteristic is to divert water from the Nam Theun basin (from Nam Theun 2 Reservoir) to the Xe Bangfai basin southwards through the NT2 Downstream Channel that empties into the Xe Bangfai River, a Mekong tributary. To assess changes in the fisheries in the Xe Bangfai River, a fish catch monitoring program was implemented for a ten year period. It aimed to (i) quantitatively establish pre-project fishery resources in portions of the downstream area which would be affected by operation of the NT2 project, and (ii) evaluate fisheries trends over a period of five years after the commercial operation started, until the end of 2015.
In 2005, the Social Development Plan of the Nam Theun 2 Project estimated that the potential impact for the riparian villages could range up to 40% loss in mainstream fisheries during the rainy season and up to 60% loss during the dry season [14]. Hence, the current paper aims (i) to present key fisheries indicators from 2006 to 2015 especially for the mainstream fisheries over the entire time-series, and (ii) to expand the previous findings based on the in-depth analysis of the fish catch monitoring program data.
Materials and Methods
Hydrological and physicochemical background
All detailed features of the NT2 area (civil works and monitoring programmes) are described in [15] and evolution of physical-chemical parameters is described in [16].
The climate is moist sub-tropical with 3 distinct seasons (i) a warmwet season (June to October), (ii) a cool-dry season (November to February) characterised by wind events and (iii) a warm-dry season (March to May).
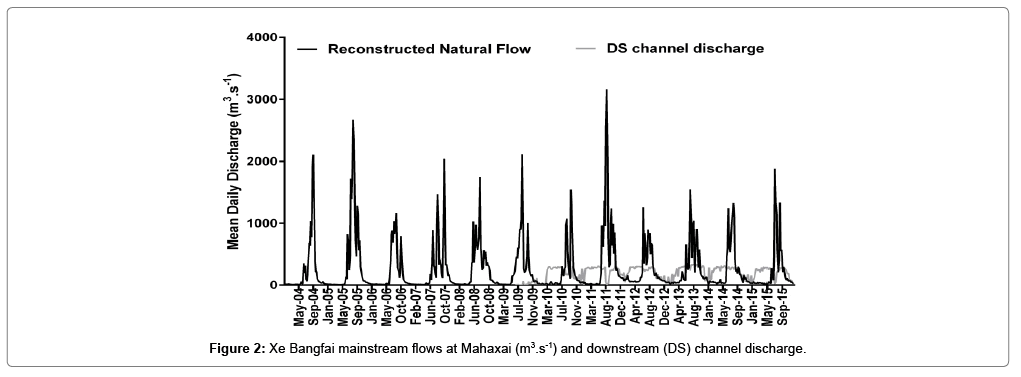
The main change in terms of river hydrology is an additional discharge ranging from 0 to 333 m3.s-1 to the Xe Bangfai River depending upon NT2 operations (Figure 2). However, since the operations started, the additional discharge has remained stable except during main outages and obligations linked to the concession agreement and energy demand. The additional discharge linked to NT2 operations is further indistinguishable from the natural flow during peak rainy season from July onwards (Figure 2). Furthermore, the discharge does not cause hydro-peaking in the Xe Bangfai River as operations are strictly linked to the Concession Agreement with the Government of Laos to minimize environmental impact on the downstream area.
The physicochemical characteristics of the water from Nakai reservoir are different from those in the Xe Bangfai River. These differences are mainly caused by differences in geology between the two basins. While the Nam Theun basin is mainly characterized by sandstone (e.g. low conductivity in water), the Xe Bangfai basin consists mainly of limestone formations [16]. Changes in water quality are mainly observed during the dry season. After 2010, a drop of the conductivity occurred in the Xe Bangfai downstream of the confluence of the downstream channel. The elevation of the Nakai reservoir and the intake of a mixed of cooler reservoir bottom water with surface water also creates a temperature differential, with the temperature of water released in the downstream channel lower than that in the Xe Bangfai upstream. This has some distinct effects immediately below the confluence, especially during natural low flow periods in the dry season from January-May. No adverse effects on oxygen content were observed post-COD, with the oxygen level always above the minimum requirement for aquatic life [16].
Fish catch monitoring
The monitoring activities implemented were based on the requirements included in a Concession Agreement between NTPC and the Lao Government. It specifically calls for a fisheries monitoring program to establish pre-project fishery resources baseline in portions of downstream areas affected by the operation of the NT2 project in particular the Xe Bangfai River. The monitoring program was required to continue during 5 years after Commercial Operation Date in April 2010, to assess changes in the fisheries.
In this context, a panel of fisheries surveys were implemented by NTPC from April 2006 to December 2015. A description of the survey methodology is included in [17]. Among all available data, only the data collected by the daily catch logbook (DCL) of households living near mainstream Xe Bangfai are considered as it is known to contain more detailed and reliable information [17]. This represents a total sample of 85 households (HH) in 17 villages. Although the target household sample is 85, the number of households fishing for each surveyed month is between 51 and 88. The sample households represented 1.2% of the total number of riparian households. Due to the special requirements for this particular type of survey (i.e. willingness to be involved and sufficient literacy), the households were considered as a panel of fishing households with preferential selection of households with different levels of dependency on fishing.
In addition, the attrition rate of households for the logbook survey was defined as the percentage of original sampled households still involved in the survey at the end of each year. The annual attrition was calculated as 1-(1-q)1/T where q is the overall attrition rate and T is the number of years of the survey. Households that left the survey were replaced to retain the required sample size and coverage, using households with a similar fishing pattern.
Data were collected on daily basis for (i) daily fish species catch by household (kg) (ii) boat and gear use, (iii) the disposal of the fish catch (kg) for the consumption, sale or processing, and (iv) the reported fisheries income. A 9-month gap in data collection from July 20007 to March 2008 was used to evaluate the methodology and assess the available data. Some data is available during this period but has been excluded from analysis.
The trend for the median household monthly catches was quantified by calculating the difference between subsequent years. Because of the period without survey coverage, periods were defined to allow comparison between years. The first period compared included data for April-June (late dry season) allowing to integrate data from 2007, and the second period compared included data for April-December (dry and wet season) except for 2007.
Significance of the difference between medians was assessed using the Wilcoxon rank-sum test when 2 groups of values (samples) were compared and the Kruskal-Wallis one-way analysis of variance if there were more than two groups. Observed significance probabilities of 0.05 or less were considered evidence that the distributions across factor levels were not centred at the same location and hence are statistically different. The level of significance (p) is indicated with asterisks with the number indicating the level of significance found.
The catch composition for the riparian households fishing in the mainstream was followed for the period April-December from 2006 to 2015 with the exclusion of the year 2007 in the data analysis. The top 25 species, defined as the group of species representing more than 85% of the total weight of the yearly catch, was followed as well as their rank, based on their yearly contribution of the total weight catch, from 2006 to 2015. Groups of species were defined as “spp.” when genera were represented by several species in the catches but defined by households using a single Lao common name only. Migratory species were defined based on [18,19].
The catch disposal was considered for the catch from all habitat fished by the sample of riparian village. This included the catch from the mainstream, the tributaries and wetland as the data collection did not allow disaggregating the disposal of the catch per habitat. However, it gives a good representation for the mainstream that is the main fishing habitat for the riparian villages. Finally, the median of riparian household monthly reported income (Laotian Kip-LAK) were compared with a Kruskal-Wallis one-way analysis of variance.
Results
Households’ attrition
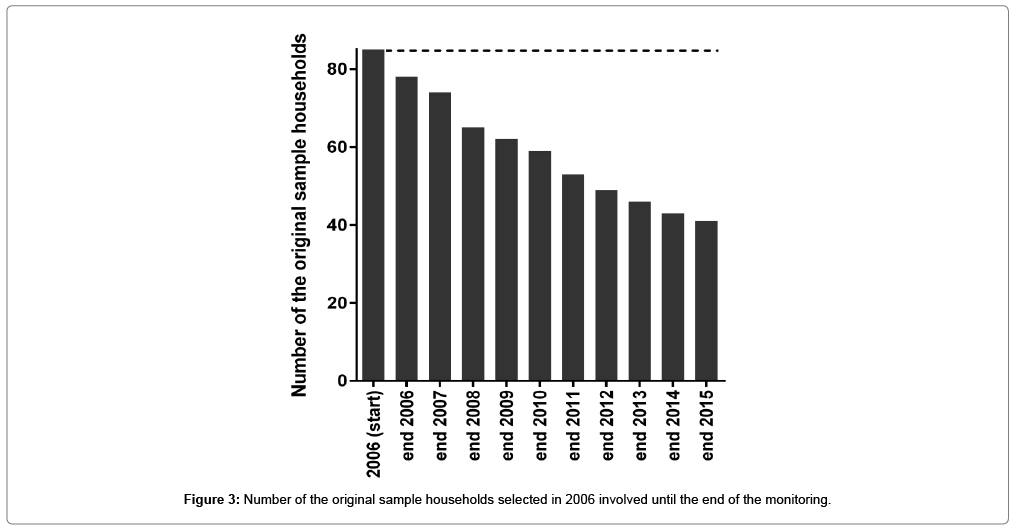
The original number of Households involved was 85 in 2006 (Figure 3). It progressively declined to 78 (end of 2006), 74 (end of 2007), 65 (end of 2008), 62 (end of 2009), 59 (end of 2010), 53 (end of 2011), 49 (end of 2012), 46 (end of 2013), 43 (end of 2014), and 41 (end of 2015). At the end of 2009 just before COD, 62 original riparian households were still involved (73.0%), with only a limited additional attrition until the end of 2015 down to 41 households (48.2%). The attrition indicated a gradual decline in the number of original sample households of on average 7.8% per year.
Households’ fish catch
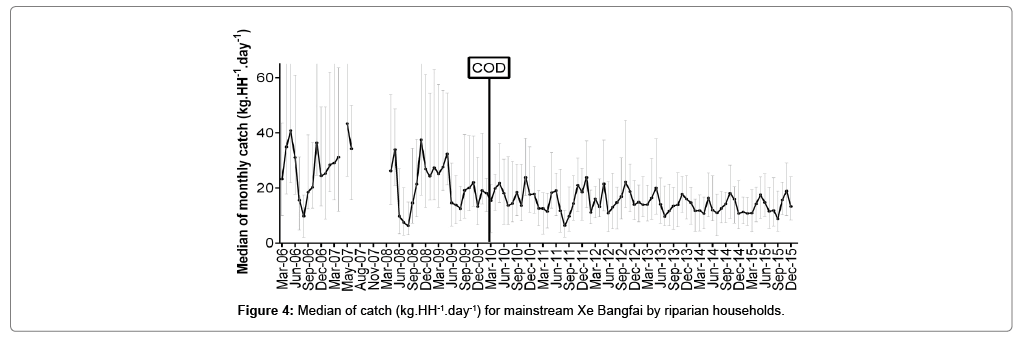
The median of riparian household fish catch showed a pre-project decline until mid-2009 (Figure 4) by 23% (41 kg.HH-1.day-1 in May 2006 versus 32 kg.HH-1.day-1 in May 2009). Afterwards median catch remained stable until 2013, when it experienced another decline. Peaks of catches were observed at the end of the dry season (May) and end of the rainy season (October-November) while the lowest catches were observed at the peak rainy season (July-August) with the lowest values observed in the rainy season 2008 (6 to 7.5 kg.HH-1.day-1) and August 2011 (6.4 kg.HH-1.day-1).
In terms of median of monthly household fish catches (Table 1), the largest significant changes for the April-December period occurred in 2010 (-12.8%, p<0.05) which is the year of COD and 2014 (-17.3%, p<0.05). A significant increase was further noticed for the year 2012 (10.6%, p<0.05). For the April-June period, the significant changes were observed in 2008 (-27.9%, p<0.05), 2010 (-27.5%, p<0.05) and in 2014 (-23.7%, p<0.05). The last year of the monitoring (2015) showed an increase of the median of monthly catch for both periods (23.1% for April-June period, 9% for April-December period). Comparing the changes between the two periods, the declines were greater for the April-June period. Despite considerable variation between individual years there was no absolute decline in the estimated monthly household catches by comparing the year 2010 and the year 2015 (Table 1).
| Median monthly household catch (kg.HH-1.month-1) | ||||||||||
|---|---|---|---|---|---|---|---|---|---|---|
| Apr-Jun | 2006 | 2007 | 2008 | 2009 | 2010 | 2011 | 2012 | 2013 | 2014 | 2015 |
| Median | 34 | 32.1 | 23.1 | 26.7 | 19.4 | 17.4 | 18.2 | 20.1 | 15.4 | 18.9 |
| Change | -4.90% | -27.90% | 15.40% | -27.50% | -10.00% | 4.60% | 10.40% | -23.70% | 23.10% | |
| P | - | ** | - | *** | - | - | - | * | - | |
| Apr-Dec | 2006 | 2007 | 2008 | 2009 | 2010 | 2011 | 2012 | 2013 | 2014 | 2015 |
| Median | 22 | 21.2 | 20.1 | 17.5 | 16.5 | 18.2 | 19.3 | 16 | 17.4 | |
| Change | -3.70% | -5.30% | -12.80% | -5.70% | 10.60% | 5.80% | -17.30% | 9.00% | ||
| P | - | - | *** | - | * | - | ** | - | ||
Table 1: Change in the median of monthly household catch (kg.HH-1. month-1) between subsequent years for selected periods. Significant change and level of significance are indicated by the P value (*= significant, **= very significant, and ***= highly significant). Change for Apr-Dec for 2008 is calculated relatively to 2006.
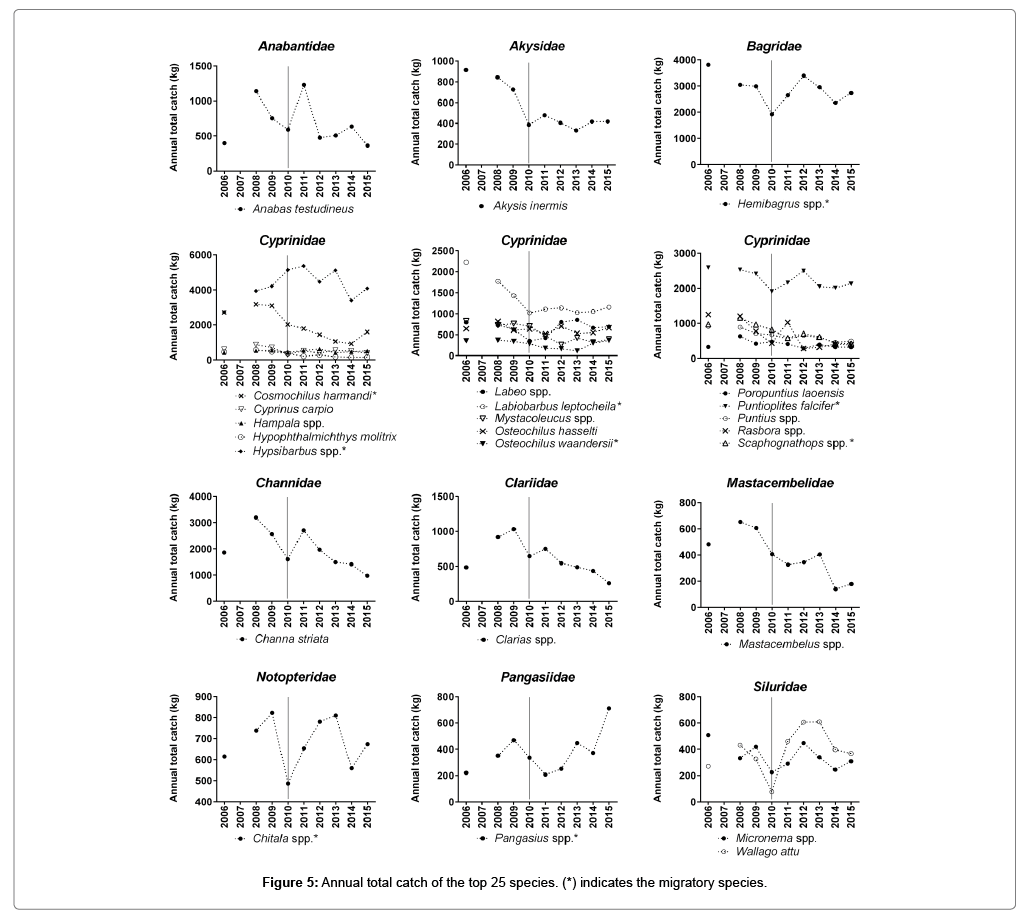
Species catch composition: The Household DCL included catches for more than 120 fish species. The yearly reported catch for the top 25 species for riparian catches shows a diverse evolution (Figure 5). A total of 13 species experienced a decline between 2006 and 2009. For instance, pre-COD decline could reach 38% for Rasbora spp., 36% for Labiobarbus leptocheila or around 21% for Hemibagrus spp. and Akysis inermis. These declines were followed by stable catches after the COD (e.g. Labiobarbus leptocheila, Hemibagrus spp., Akysis inermis). Some species experienced a continuous decline from pre- COD period until the end of the monitoring in 2015 such as Channa striata, Mastacembelus spp. and the exotic species Cyprinus carpio. An accentuated decline from the riparian catches was observed for some species between 2014 and 2015 (e.g. Anabas testudineus, Channa striata, and Clarias spp.).
For the post-COD period (2010-2015), a total of 13 species experienced an absolute increase. These species are for instance Chitala spp., Pangasius spp., Micronema spp., Wallago attu (Figure 4). In term of contribution, the 25 top species remained the same before and after COD with a change in the rank of the species changed according to the year (Table 2). The top 5 species are mainly represented by migratory species. These are Hemibagrus spp., Hypsibarbus spp., Cosmochilus harmandi and Puntioplites falcifer that are part of the top five species for all the monitoring period except for C. harmandi in 2014. Labiobarbus leptocheila, another migratory species, was part of the top five species in 2006, 2014 and 2015 (Table 2).
| Species | 2006 | 2008 | 2009 | 2010 | 2011 | 2012 | 2013 | 2014 | 2015 |
|---|---|---|---|---|---|---|---|---|---|
| Hemibagrus spp.* | 1 | 4 | 3 | 3 | 3 | 2 | 2 | 2 | 2 |
| Hypsibarbus spp.* | 2 | 1 | 1 | 1 | 1 | 1 | 1 | 1 | 1 |
| Cosmochilus harmandi* | 3 | 3 | 2 | 2 | 5 | 5 | 5 | 6 | 4 |
| Puntioplites falcifer* | 4 | 5 | 5 | 4 | 4 | 3 | 3 | 3 | 3 |
| Labiobarbus leptocheila* | 5 | 6 | 6 | 6 | 7 | 6 | 6 | 5 | 5 |
| Channa striata | 6 | 2 | 4 | 5 | 2 | 4 | 4 | 4 | 6 |
| Rasbora spp. | 7 | 7 | 10 | 15 | 8 | 22 | 23 | 17 | 17 |
| Scaphognathops spp.* | 8 | 8 | 8 | 7 | 11 | 9 | 9 | 15 | 13 |
| Akysis inermis | 9 | 13 | 13 | 18 | 16 | 17 | 22 | 16 | 14 |
| Puntius spp. | 10 | 11 | 14 | 9 | 12 | 11 | 11 | 13 | 12 |
| Mystacoleucus spp. | 11 | 17 | 11 | 8 | 17 | 23 | 17 | 21 | 15 |
| Labeo spp. | 12 | 16 | 16 | 20 | 19 | 7 | 7 | 7 | 8 |
| Osteochilus hasselti | 13 | 14 | 17 | 11 | 14 | 10 | 13 | 10 | 10 |
| Chitala spp.* | 14 | 15 | 9 | 13 | 10 | 8 | 8 | 9 | 9 |
| Cyprinus carpio | 15 | 12 | 15 | 22 | 15 | 18 | 12 | 11 | 16 |
| Micronema spp. | 16 | 25 | 23 | 24 | 22 | 16 | 21 | 23 | 22 |
| Clarias spp. | 17 | 10 | 7 | 10 | 9 | 14 | 15 | 14 | 23 |
| Mastacembelus spp. | 18 | 18 | 18 | 17 | 21 | 19 | 19 | 25 | 24 |
| Hypophthalmichthys molitrix | 19 | 20 | 21 | 19 | 24 | 20 | 24 | 24 | 25 |
| Hampala spp. | 20 | 21 | 19 | 16 | 13 | 12 | 18 | 12 | 11 |
| Anabas testudineus | 21 | 9 | 12 | 12 | 6 | 15 | 14 | 8 | 19 |
| Osteochilus waandersii* | 22 | 23 | 24 | 23 | 25 | 25 | 25 | 22 | 20 |
| Poropuntius laoensis | 23 | 19 | 22 | 14 | 20 | 21 | 20 | 20 | 21 |
| Wallago attu | 24 | 22 | 25 | 25 | 18 | 13 | 10 | 18 | 18 |
| Pangasius spp.* | 25 | 24 | 20 | 21 | 23 | 24 | 16 | 19 | 7 |
Table 2: Yearly rank based on the yearly relative biomass of the top 25 species caught by the Xe Bangfai riparian household (*) indicates the migratory species.
Fishing effort and practices
Monthly fishing days showed a slight increase over the entire timeseries, without any apparent change immediately after COD (Table 3).
| 2006 | 2007 | 2008 | 2009 | 2010 | 2011 | 2012 | 2013 | 2014 | 2015 | |
|---|---|---|---|---|---|---|---|---|---|---|
| Total fishing days | 15 | 13 | 15 | 15 | 14 | 17 | 17 | 16 | 18 | |
| Days w/o consumption | 2 | 3 | 3 | 3 | 3 | 4 | 4 | 4 | 5 |
Table 3: Annual Median reported household total fishing days and fishing days when all the catch was sold in mainstream Xe Bangfai (period April-December).
There is significant increase in the number of reported fishing days after 2011, for the period April-December. The median reported number of household fishing days is 14 for the baseline period and 16 for the period post COD (p < 0.0001). In the same way, the median reported number of fishing days in which all the catch is sold is 3 for the baseline period and 4 after COD (p < 0.0001).
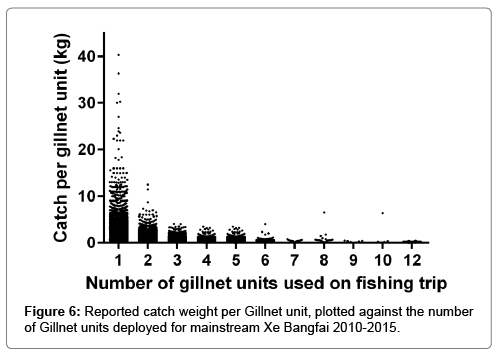
For the entire post-COD period, the additional catch obtained with more than 2 gillnet units is low (Figure 6), which is the reason that for more than 90% of the reported fishing trips either 1 (66.5%) or 2 (23.7%) gillnet units are used.
Catch disposal and household reported income
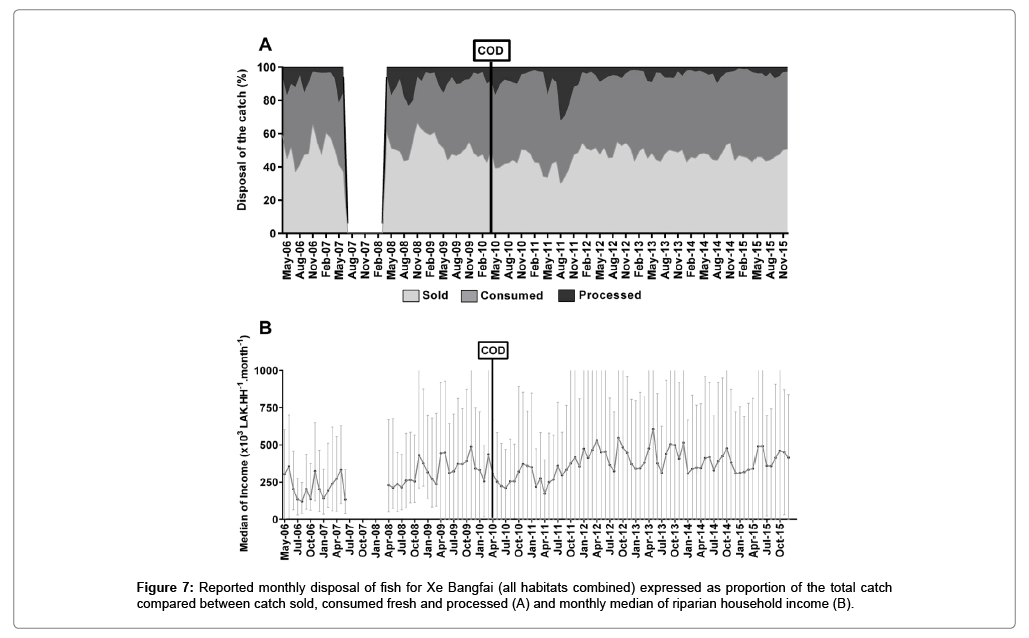
The proportion of the catch that is consumed and sold is 48.8% and 43.3% respectively over the entire time-series. Disposal has shifted more towards selling; comparing the baseline levels with those after COD, with the proportion consumed declining from 52.4% to 46.2%, while the proportion sold increasing from 38.0% to 46.9% (Figure 7A). Not all households report a monthly fisheries income. However, medians were based on reported income with a minimum of contributing households of 41 (June 2008) and 79 (November 2008, Figure 7B). Median reported income from fishing showed variations related to the total catch and level of other livelihood activities of the households with the highest income reported for the end of the dry season (around May) and at the end of the wet season (around October-November). Median monthly reported income varied between 174,000 LAK (April 2011) and 655,000 LAK (May 2013). Furthermore, since September 2011, the median reported income was maintained above 300,000 LAK. A trend of an increasing reported income is observed. However, observed differences are insignificant (p>0.5).
Discussion
The ten-year fish catch monitoring allowed to gather a unique set of data in the Xe Bangfai River, a Mekong tributary recognized as an important system for the Middle Mekong Basin [20]. The longterm study provided a five-year long data series after the commercial operation started. This long-term data series has more chance to include influences of the different yearly climatic condition [21]. Indeed, the Xe Bangfai River is affected by hydropower operations that modified the baseline flow since 2010 with an increased average minimum flow during the dry season. Environmental analysis underlined changes in the water quality that occurred mainly during the dry season period (e.g. temperature) in the Xe Bangfai mainstream but without stress linked to dissolved oxygen nor turbidity [16]. These changes are maintained since the operations started.
A potential factor influencing fisheries results to consider in the long-term data series is the household attrition. Indeed, the impact of attrition of the household sample on the data that was collected and used to design a general scheme of fisheries in the Xe Bangfai River is of special interest. Although for every household that leaves the survey, a replacement was selected, bias caused by socio-cultural factors may influence the usability of the available data. Some estimates were provided for attrition for household surveys that were repeated at various intervals, where the attrition varied from 1.5-32.2% per year [22]. Although a DCL where households need to submit a logbook on daily catches, is difficult to compare to socio-economic survey rounds that are repeated on a multi-annual basis, it indicates that the attrition for the current study is relatively low and within acceptable limits. The main reasons households leave the survey was linked to (i) changes in composition of the household, (ii) the household moving to another village and in only a few cases (iii) the household losing interest in the survey.
The possible impact of attrition on survey results are discussed in [22] and it concluded that “estimates of behavioural relations may not be biased due to attrition”. Comparing the median reported monthly household catch in mainstream Xe Bangfai, between panel and nonpanel households shows that there is a significant difference (N = 108, p = 0.0019), with the panel households reporting a 2 kg lower monthly household catch than replacement households. This suggests that replacement households have different fisheries dependency than the original households or alternatively that long-term involvement makes for more consistent reporting. Since the emphasis is on assessing changes in the fisheries, including replacement households in the analysis improves the robustness of the estimates. Therefore, it seems valid not to limit the analysis just to panel households and to consider all available data. The effect of any bias is important, because of the nonrandom nature of the sample. Verification of the representativeness of the data obtained from the DCL was assessed using an interviewbased catch assessment survey with a 4-days recall period, taking a random household sample in selected riparian villages [17]. The results indicated that the households involved in the DCL seem to be better in keeping their catches stable than the average randomly selected household. Therefore, DCL data can be used as indicator for change in the fishery, but that calculated changes in fishery indicators and trends may not be representative for all fishing households. In addition, the lack of a time-series on the general involvement of households in the fisheries makes interpreting trends and changes difficult. However, by considering these elements, general trends and results could be better interpreted and discussed.
For the entire time series, the total reported catch showed a seasonal variation with the lowest catch reported for the peak flow period. Fish catches in the Xe Bangfai River were strongly related to the flood cycle which is known to influence the catchability of fish [12] as well as the seasonality of other livelihood activities, especially rice planting and harvesting activities. There are a number of distinct phases of fishery associated with river hydrology [17] that are (i) the dry season when fishing concentrates in dry season refuge areas (deep pools and areas below rapids), (ii) the waxing water levels when fishing concentrates on targeting migratory species moving upstream and onto flood plains, (iii) peak flooding when fishing in the main river channel is reduced due to high flow and fishing focuses on floodplain areas and tributaries and finally (iv) weaning water levels when fish moving from floodplains are targeted.
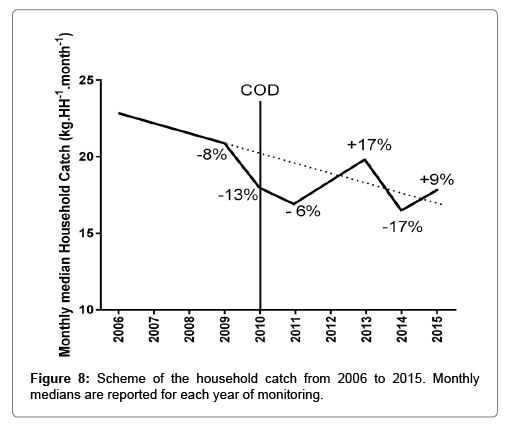
The fisheries are recognized to be an important livelihood resource in developing countries especially for rural population [23]. The preproject concerns included the risk of a decline in fisheries for households living along the Xe Bangfai River. The median of the monthly reported household catches survey provides a good indication of the main trends for the development of the fisheries in mainstream habitats. Although there are some differences between the upper-middle and lower Xe Bangfai River, they follow the same general development. A general scheme was developed to summarize the yearly fisheries production based on the DCL survey (Figure 8).
The scheme allowed identifying three periods with different trends in term of catch. The first period, from 2006 to end of 2009, is characterized by a pre-operation decline (-8%). The pre-project period is followed by a second period (2010-2011) characterised by a post- COD decline. This decline represents a loss in the catch of 13% in 2010 compared to the year 2009 and with a total decline of 19% until the end of 2011. This decline mainly linked to the start of the operation, was predicted in the pre-project assessment. Poff and Zimmerman (2010) Reported modification of ecological metrics that include fish, linked to altered flow regime of rivers was inventoried in [24]. Based on the literature review gathering 165 papers in [24], 92% reported negative impact on ecological metrics. The review also underlined that fish experienced negative responses to alteration in flow magnitude [24]. The changes observed in flow regime during the dry season and starting in April 2010 in the Xe Bangfai River may be the main factors of the catch decline. Interestingly, the estimated decline for the mainstream village catch (-19%) remained less than the 40% to 60% predicted decline respectively for the rainy and the dry season [14]. The estimated decline remain further lower than the decline in the downstream fisheries over all fishing habitats of the Xe Bangfai river reported to 35% for 2010 and of 25% for 2011 [25]. This period of the 19% decline could be qualified as a transition and adaptation phase toward a new ecological system. Finally, the last period of the monitoring is defined as a period influenced by factors others than operations (2012-2015) as changes linked to NT2 operation became a permanent feature and relatively constant as the operations system is maintained. This period started with a clear increase for 2012-2013 (+17%) during which fisheries were positively affected by the previous strong rainy season 2011. However, this positive effect on fisheries was not maintained. Indeed, another decline occurred in 2014 followed by an increasing trend for 2014-2015. Although the data presented a clear effect of the operations on the fish catches, this seems to be a fixed immediate impact effected in 2010-2011. The observed decline during the second period can be categorised as transitional and a period of adaptation to the new ecological system mainly during the dry season. It is then argued that any variation in the fisheries decline after full impact in 2011, corresponding with the third period of the monitoring, are likely due to other factors that influence fish catches. These factors are for instance the strength of the flood season (e.g. rainy season 2011). Indeed, catches are recognized to be influenced by the intensity of the flooding that occurred in previous years [26]. Fisheries are also strongly influenced by the ongoing development in the Xe Bangfai basin, increased fishing pressure or the effect of increased development in the wider Mekong basin. For instance, the observed increase in the number of fishing days in the mainstream Xe Bangfai River, as well as the observed trend over the time-series in number of fishing days on which all the catch is sold, suggested an increase of the fishing pressure. The commercial fishing is then suspected to be comparatively more important despite decreasing catches, which would put more pressure on existing resources. The overfishing in the lower Mekong area of some species was already reported [26] especially for the large migratory species. This could have been also the case for the other species that experienced a pre-project decline. This finding appears to be the main explanation for the pre-project decline observed in the first period of the monitoring.
In the absence of a dam on the Xe Bangfai River, there is no physical barrier to migrations. This is confirmed by the presence of migratory species that spend part of their life cycle outside of the Xe Bangfai basin. However, annual variation in total catches of migratory species is noticed. The available data indicates that no species disappeared from the fisheries, but that individual species have quite distinct reaction to changes in the Xe Bangfai basin. Migratory species have become relatively more important for the fisheries and are less affected by the changes than non-migratory species. For instance, some species that are normally associated with wetlands and tributaries (e.g. Channa striata and Mastacembelus spp.) have seen considerable declines until the end of the monitoring. Changes might be related to change in the habitat and potential fishing pressure on both these species in the wetlands before the project. After the start of operations, the changes in the hydrology might have add an additional pressure on these two species. Pre-existing pressure on fisheries in the pre-project period is also supported by the decline of other species in the pre-project period such as the migratory species L. Leptocheila, Hemibagrus spp., and A. inermis.
Finally, inland fishery is known to contribute largely to the household income in Southeast Asia [23]. Change in trends and species composition within the household catch may lead to a change in the income of the households. Disposal of the catch in the Xe Bangfai river from the sampled household and considering all habitats experienced a small change overall between categories as proportion of the total catch. The fishery income in the present study indicates encouraging trends with increases since the start of operations. Despite the increase in fishing for income, the fisheries in the Xe Bangfai is a subsistence fishery. Fishing is overwhelmingly done first and foremost to support protein consumption in the household with surplus fish either sold or processed, as seen during the exceptional flood in August 2011. The disposal then is highly dependent on the catch amounts, as fresh fish cannot be stored for an extended period. Over-supply during peak catches, mainly during the peak flooding period, shows an increase in processing, as fish traders cannot absorb all the fish landed. All in all, the income from fishery is another indicator pointing that fishery as a livelihood resource is maintained for at least 5 years after the operation.
Conclusion
The present study underlined the importance to have a long-term data series (with at least a 5-year period before a project) to better analyse the trend of fishery and better discriminate the changes linked to a project, climatic condition (that might include extreme events) and general development activities within a watershed. The main lesson learned from the ten years monitoring in the Xe Bangfai River is that the lack of a time-series on the development of the number of households actively involved in the fisheries makes it difficult to draw any definitive conclusions about the impact of the NT2 project. It is important to emphasise that the pre-existing long-term decline in fish catches that might be due to overfishing, destructive fishing practices and destruction or conversion of fish habitats and other non-fisheries related factors that affect fish and fisheries must also be considered. However, any comparison to try to quantify impacts, even between subsequent years, e.g. 2009 and 2010 is hampered by natural differences between years. Consequently, it appears impossible to clearly quantify the impact linked to NT2 operations alone as it is a part of a combination of factors. The potential loss of fisheries described in [14] has been the guiding principle for the livelihood development and implemented compensation scheme. The fish catch monitoring confirmed that NT2 operations are having an impact on fisheries. However, due to many factors contributing to fisheries production, including socio-cultural changes, it appears not possible to accurately assess the contribution of NT2 operations on the changes. The data clearly showed that a strong wet season can increase the fish production significantly (in the presence of ecological functional wetlands), which would confirm that NT2 operations are not the main factor influencing differences in fisheries production between years after 2010, but rather natural flooding events. The high decline found for 2014 is a further evidence that fish catches are under the influence of other factors impacting the fisheries besides NT2 operations. Even if the total decline suspected to be related to NT2 operation reached a total of 19%, it is encouraging to note that catch trends post-operation are not merely pointing at a continuing decline. This could indicate ecological resilience and that the fisheries still are a viable livelihood and continues to offer access to high value protein for surrounding population.
Acknowledgement
This research has been conducted by the Environmental and Social Division of the Nam Theun 2 Power Company in Lao PDR whose Shareholders are Électricité de France, Lao Holding State Enterprise and Electricity Generating Public Company Limited of Thailand.
Authors would like to thank local authorities, Reservoir Management Unit, and all villagers that provide their precious time and data for the monitoring period. Authors also would like to address a special thanks to all to the fish catch monitoring team since the beginning (Downstream Program and especially N. Wongwai and M. Ovenden), Technical Branch of NTPC and the Environment Dept. with especially K. Kue and S. Xayabounpheng, Hydrology Team, and GIS specialist for providing all requested environmental data for the Xe Bangfai River. Finally, authors would like to thanks Dr. V. Chanudet (EDF-CIH), Mr P. Guédant and O. Didry (NTPC) for their helpful comments for the manuscript improvement.
References
- Souksavath B, Nakayama M (2013) Reconstruction of the livelihood of resettlers from the Nam Theun 2 hydropower project in Laos. Int J Water Resources Development 29: 71-86.
- Bhukaswan T (1980) Management of Asian Reservoir Fisheries. FAO Fisheries Technical Paper No. 207 Rome.
- De Silva SS, Funge-Smith S (2005) A review of stock enhancement practices in the inland water fisheries of Asia. FAO Publication 12 Â Asia-Pacific Fishery Commission.
- van Zwieten PAM, Béné C, Kolding J, Brummett R, Valbo-Jørgensen J (2011) Review of tropical reservoirs and their fisheries - The cases of Lake Nasser Lake Volta and Indo-Gangetic Basin reservoirs. FAO Fisheries and Aquaculture Technical Paper 557 Rome FAO.
- Cottet M, Visser TAM (2017) Fish Catch and fishing practices in the Nam Theun 2 Reservoir and watershed (Lao PDR). Lakes and Reservoirs Research and Management 22: 334-348.
- Jackson D, Marmulla G (2001). The influence of dams on river fisheries. In Dams, fish and fisheries: opportunities, challenges and conflict resolution. FAO Fisheries Technical paper No. 419 Rome.
- World Commission on Dams (2000)Â Dams and development:Â a new framework for decision-making: the report of the World Commission on Dams. Earthscan Publishing London and Sterling.
- Yi Y, Yang Z, Zhang S (2010) Ecological influence of dam construction and river-lake connectivity on migration fish habitat in the Yangtze River basin China. International Society for Environmental Information Sciences 2010 Annual Conferences. Procedia Environmental Science 2: 1942-1954.
- Petr T (1978) Tropical man-made lakes -  their ecological impact. Archiv für Hydrobiology 81: 368-386.
- De Mérona B, de Morais LT (1997) Ichthyological studies related to the construction of the Petit-Saut dam: an initial assessment and recommendations. Applied Hydroecology 9: 241-262.
- Dudgeon D (2000) Large-scale hydrological changes in tropical Asia: Prospects for riverine biodiversity: The construction of large dams will have an impact on the biodiversity of tropical Asian rivers and their associated wetlands. Bio Science 50: 793-806.
- Kolding J, van Zwieten P (2006) Improving productivity in tropical lakes and reservoirs. Challenge Program on Water and Food. Aquatic Ecosystems and Fisheries Review Series. Theme 3 of CPWF Worldfish Center Cairo.
- Baran E, Guerin E, Nasielski J (2015) Fish sediment and dams in the Mekong: Worldfish and CGIAR Research Program on Water Land and Ecosystems (WLE). Penang Malaysia.
- SDP (Social Development Plan of the Nam Theun 2 Power Company) (2005) Environmental Assessment and Management Plan - Nam Theun 2 Hydroelectric Project. Nam Theun 2 Power Company, Vientiane.
- Descloux S, Guédant P, Phommachanh D, Luthi R (2016) Main features of the Nam Theun 2 hydroelectric project (Lao PDR) and the associated environmental monitoring programme. Hydroécologie Appliquée
- Chanudet V, Guédant P, Rode W, Guérin F, Serça D, et al. (2015) Evolution of the physico-chemical water quality in the Nam Theun 2 Reservoir for the first 5 years after impoundment. Hydroécologie Appliquée.
- Visser TAM, Ovenden MD, Wongyai N (2016) Developing approaches for establishing a fisheries baseline: Case-study for Xe Bangfai basin (Lao PDR). Hydroécologie Appliquée.
- Baird IG, Flaherty MS (2004) Beyond national borders: Important Mekong River medium sized migratory carps (Cyprinidae) and fisheries in Laos and Cambodia. Asian Fisheries Science 17: 279-298.
- Ziv G, Baran E, Nam S, Rodriguez-Iturbe I, Levin SA (2012) Trading-off fish biodiversity, food security, and hydropower in the Mekong River basin. Proc Natl Acad Sci USA 109: 5609-5614.
- Poulsen AF, Ouch P, Sintaving V, Ubolratana S, Nguyen TT (2002) Fish Migrations of the Lower Mekong River Basin: implications for development planning and environmental management. Mekong River Commission Technical paper 8. Phnom Penh.
- Penczak T, Głowacki L, Galicka W, Koszaliński H (1998) A long-term study (1985-1995) of fish populations in the impounded Warta River Poland. Hydrobiologia 368: 157-173.
- Alderman H, Behrman JR, Kohler HP, Maluccio JA, Watkins SC (2001) Attrition in Longitudinal Household Survey Data: Some Tests for Three Developing-Country Samples. Demographic Research 5: 79-124.
- Smith LED, Khoa SN, Lorenzen K (2005) Livelihood functions of inland fisheries: policy implications in developing countries. Water Policy 7: 359-383.
- Poff NL, Zimmerman JKH (2010) Ecological responses to altered flow regimes: a literature review to inform the science and management of environmental flows. Freshwater Biology 55: 194-205.
- McDowell D, Scudder T, Talbot LM (2012) Nam Theun 2 Multipurpose Project: nineteenth report of the international environmental and social panel of experts. Washington DC: The World Bank.
- Allan JD, Abell R, Hogan Z, Revenga C, Taylor BW, et al. (2005) Overfishing of Inland Waters. Bio Science 55: 1041-1051.
Citation: Cottet M, Visser TAM (2018) A Ten Years Household Fish Catch Monitoring Study in the Xe Bangfai River (Lao PDR): Assessment of Fisheries Evolution before and after the Start of Nam Theun 2 Hydropower Operations. J Fisheries Livest Prod 6: 286. DOI: 10.4172/2332-2608.1000286
Copyright: © 2018 Cottet M, et al. This is an open-access article distributed under the terms of the Creative Commons Attribution License, which permits unrestricted use, distribution, and reproduction in any medium, provided the original author and source are credited.
Select your language of interest to view the total content in your interested language
Share This Article
Recommended Journals
Open Access Journals
Article Tools
Article Usage
- Total views: 3554
- [From(publication date): 0-2018 - Oct 01, 2025]
- Breakdown by view type
- HTML page views: 2701
- PDF downloads: 853
