A Study on the Analysis of CO, HC, CO2 from Vehicles and their Impact on the Environment
Received: 28-May-2021 / Accepted Date: 12-Oct-2021 / Published Date: 19-Oct-2021 DOI: 10.4172/2167-7719.1000141
Abstract
The relocation of cities to Delhi NCR has led to rapid growth in the number of vehicles in relation to Population growth and motivation. Discharges from vehicles are currently calculated among the major sources of air pollution in Delhi. This affects the air quality. Approximate emissions of pollutants such as Carbon Monoxide (CO) and Particulate Matter (PM), which comes from a variety of vehicles and different types of fuel, various facts and details were calculated and analysed with reference to standard values set through national Pollution Schemes. Based on this statistical data obtained and analyses, conditions related to future vehicle growth and their impact on air quality is meant to overcome discharge problems. In this paper, we have collected data on different kinds of vehicles like two-wheelers, four-wheelers, mini trucks, trucks, and buses. Carbon monoxide, hydrocarbons, and RPM of different kinds of vehicles are measured in this study.
Keywords
ehicular Pollution; Air Pollution; Carbon Monoxide; Hydrocarbons; Particulate Matter
Introduction
India is one of the world's largest sources of pollution, and vehicular pollution is one of the major sources of pollution. This paper includes the study of Hydrocarbon (HC), Particulate Carbon Monoxides (CO), Carbon Dioxide, Hartridge Smoke Unit (HSU), and rpm. Hydrocarbon (HC) molecules are not fully burned during vehicular emission. And the presence of sunlight and oxides of nitrogen forms the groundbased ozone. Ozone formation causes smog’s and eye irritation nose and also damages the lungs. Some exhaust releases the HCs which is harmful too, it can cause cancer. Carbon Monoxide (CO) is also produced by the incomplete burning of hydrocarbons based on fuels. It is a poisonous gas colourless and odourless [1]. An increase in more vehicles means that more people can now afford cars and this is bad for the environment. Vehicular pollution is Dangerous for animals too and growing at an alarming rate due to growing Urbanization in India. Symptoms on humans due to air pollution are ugh, headache, nausea, irritation of eyes, various bronchial and visibility problems. Diesel Engines Emit less CO2sup> and Greenhouse Gases (GHG) but we blame diesel engines for polluting more. On-road and highway, motor vehicles including bikes, cars, trucks, buses, two and three-wheelers are the principal contributors to global anthropogenic emission of air pollutants. The burning of fuels in automobiles emits the impurities such as Particulate Matter (PM), Oxides of Nitrogen (NOX), Sulphur Dioxide (SO2), Carbon Monoxide (CO), and unburned hydrocarbons were released into the atmosphere. Dust particles are also playing a crucial role in vehicular pollution. Dust is made up of small solid particles predominantly larger than those found in colloids and capable of temporary suspension in the air or other gases. Dust is produced by crushing, grinding, etc., the country has taken several measures for the improvement of air quality in cities such as improvement in the fuel quality and take necessary action in legislation and enforcement of vehicle emission standards, planning, and management of traffic. Hydrogen and carbon atoms together form hydrocarbons to form petrol and diesel. In a complete fire, oxygen converts all hydrogen into water and carbon dioxide into carbon dioxide. But this complete fire does not work in cars due to various emissions. Various pollutants from pollutants pollute the air as they come in contact with them and have devastating effects on humans and the environment. Car pollution is hard to avoid as pollution from cars occurs at very high altitudes. This is the level of space in which people live and breathe [2].
Methodology
Monitoring is an important aspect of health and environmental protection. However, general testing of flue electricity prices in certain areas should not be underestimated. The combination of a few metals can prove very useful here. Technology has now advanced so far that you have the opportunity to combine different metals and compare prices with each other. Therefore, for example with oil heating systems in particular, it makes sense to use a smoke detector again. Exhaust analysis is used to obtain standard values, and a nanoparticles measurement tool can be used to evaluate nanoparticle exposure in the environment. It works to protect the lives of people working in close proximity to industrial equipment that can be expected to emit nanoparticles. The combined results of the instruments mean that you benefit from a more detailed, reliable test [3].
The basic purpose of a smoke meter is to measure the emissions of exhaust gases through filter paper. Darkening the filter paper is measured with a reflectometer and shows the auxiliary content in the exhaust power supply. The smoke collected by the filter and darkening of the filter depends primarily on the concentration of the lead and the effective filter length the volume of the exhaust gas relative to the filter area. The measurement principle of the smoke meter is shown in Figure 1. The folded filter paper is fed into the exhaust gas chamber where the particle particles are advertised on the surface. The filter paper is then handed over to the measuring section. Here the blurring of the filter paper is measured with a reflectometer and further forward from this chamber. The filter paper used is rolled into a spool [4].
Quantification of Emissions
The type of transport system and fuel used in vehicles are measured
component of emission on road vehicular pollution.
ET = Σ (vehicle × dl) × efl
ET = Total Emission of compound Vehicle = Number of Vehicle per type
dl = distance travelled in a year by different vehicles efi, km = Emission of the compound, vehicle type per driven kilo metre
The chemical reactions occurring during ideal combustion stages as follows:
Fuel (HC) + Air (O2, N2)− → CO2 + H20 + unaffected Nitrogen
Similarly, the typical engine combustion which occurred in vehicles represented as
Fuel (HC) + Air (O2, N2)− → Unburned HC + NOx + CO + CO2 + H2O
Experiment setup
In this section, we performed the tests and test procedure for the analyzer gas we used. As per the specifications of the fabricator, the power supply is checked to perform a test on vehicles. The electrical calibration should be checked. All the functionality of the device needs to be checked [5].
The span and zero calibrations are checked in the gas Analyser. The sampling System should also leak-proof. The printer is working properly or not should be checked and print-out information should also be checked.
The smoke meter test procedure should also be checked. Some of the required steps needed to be administered on smoke meters. It is checked that if the calibration of the meter is at zero and midscale point while the neutral density filter is out there, after the warm-up of the meter. The ideal value must lie within 0.1 m−1. The Component, like the internal pipe and sample hose, etc. Need to be checked if they are damaged and ensure that are no leakages. The functionality of the heating plant for the optical chamber is checked the purge air system and visual displays should even be checked, to ascertain they're are working correctly. The functioning of the oil temperature and Revolutions Per Minute (RPM) sensor also must be checked. Finally, it is checked if the printer is working efficiently and the print-out information is correct, and the instrument casing should be proper, with a proper electrical earthling [6].
The prescribed standard for different fuel-type vehicles consists of acceptable values of Carbon Monoxide gas (CO), Hydro Carbon (HC), and Carbon Monoxide gas (CO2). Here, CO and HC have emitted pollutants. The estimation of the pollutants emitted in the diesel vehicle and it's based on the prescribed Hartridge Smoke Unit (HSU) and measured HSU. HSU (Hartrigde Smoke Unit) is a unit of measurement used to measure the capacity of exhaust gases for emissions, especially in diesel engines [7] (Table 1).
| BS III norms | BS IV norms | |||||
| Vehicle type | Petrol and CNG vehicles | HSU (for diesel vehicles) | For petrol and CNG vehicles | HSU (for diesel vehicles) | ||
| CO ppm | HC ppm | CO ppm | HC ppm | |||
| Four wheeler and more | 0.5 | 750 | 65 | 0.3 | 200 | 50 |
| Two wheelers | 3.5 | 450 0 | - | 3 | 300 0 | - |
Result Analysis
The analysis shows that few parameters need to be a concern for reducing the pollutants emission by vehicles. These major parameters are the high survival rates, decrease in annual mileage, and major enforcement for three- to five-year-old vehicles. We can track out that a large number of old vehicles are used in different regions after the various notifications regarding banning old vehicles by the Government of India. These old vehicles are the major source of vehicle pollutants [8].
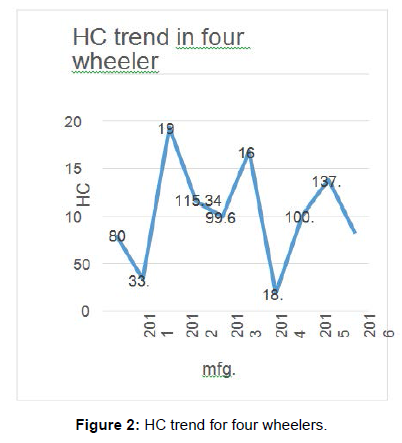
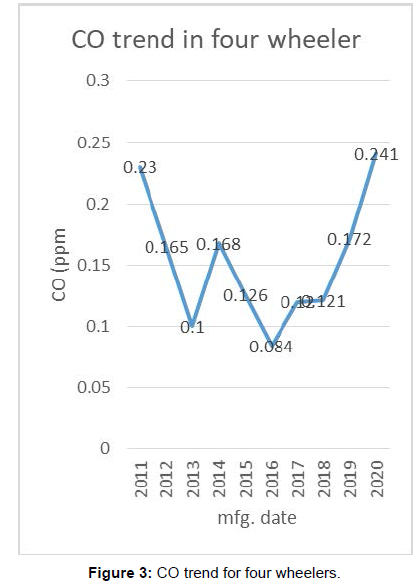
This chart is showing the trends of HC in four wheeler, petrol and CNG driven vehicles. The permissible limit for HC is 200 ppm (Figure 2). This chart is showing the trend of CO for four wheeler permissible limit for CO is 0.3 ppm. Some vehicles were exceeding the permissible limit as shown in chart (Figure 3).
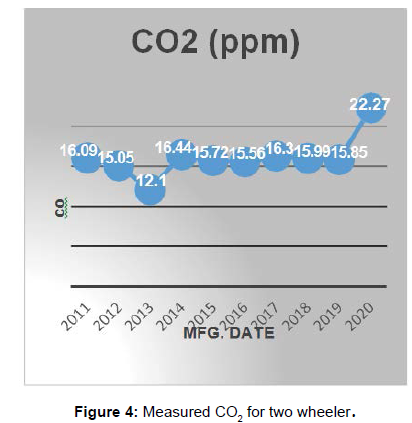
This chart is showing the trend of CO2 in four wheeler vehicle. The data was from 2011 to 2020. The range of CO2 is varying from 12 to 22 (Figure 4).
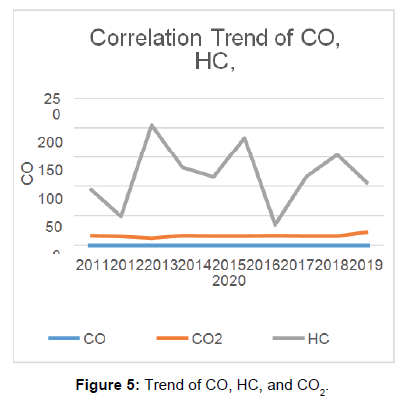
This chart is showing a correlation between CO, HC, and CO2. The value of CO is within 0.3 ppm and HC IS within 200 ppm (Figure 5).
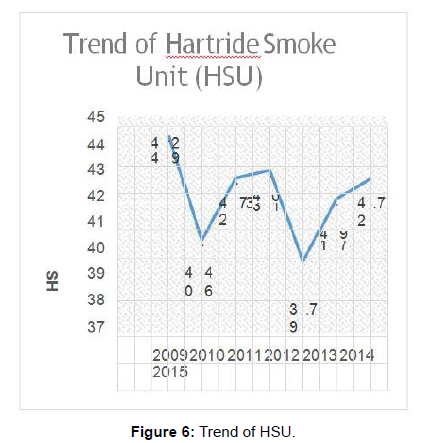
In this chart the HSU limit is shown with respect to Different years. The permissible HSU limit was 65 in BS III and 50 in BS IV. HSU is measured only for diesel vehicles (Figure 6).
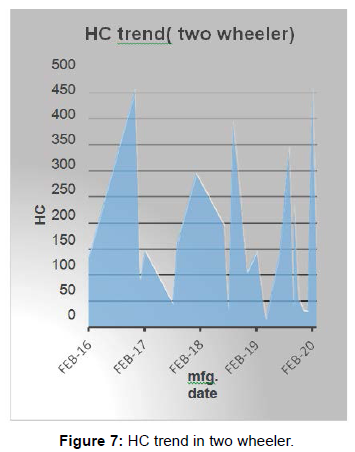
The trend of hydrocarbons for two wheeler is shown in this in this chart. The permissible limit of HC for two wheeler is 3000. The measured values are within the permissible limits as shown in chart (Figure 7).
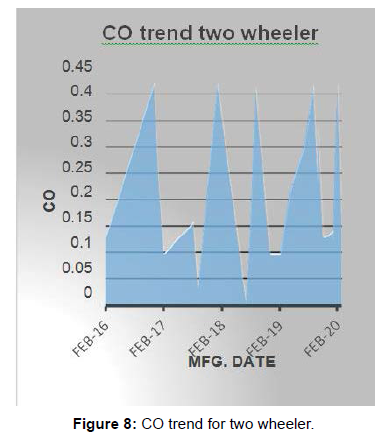
The measured values of CO for two wheeler are shown in this chart. The permissible limit is 3 ppm and measured values are within the permissible limit (Figure 8).
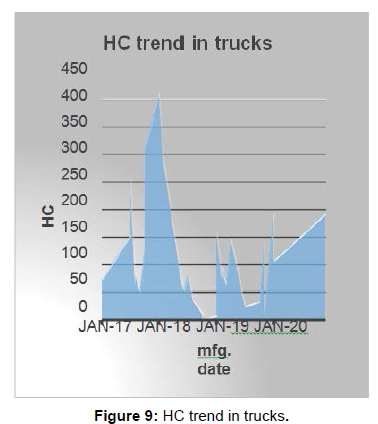
The measured values of HC were within the permissible limits and some trucks were exceeding the permissible limit. The permissible limit of HC for truck is 200 ppm (Figure 9).
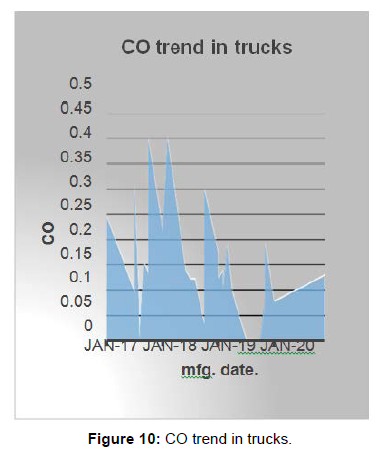
The value of CO is shown in this chart for trucks the permissible limit of CO for truck is 0.3 ppm. The measured values were found within the limits and some trucks were exceeding the permissible limit (Figure 10).
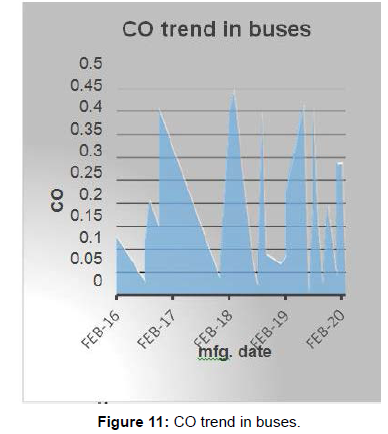
In this chart the measured values of CO for buses is shown. The permissible limit of CO for buses is 0.3 ppm but on testing some buses were exceeding the permissible limits (Figure 11).
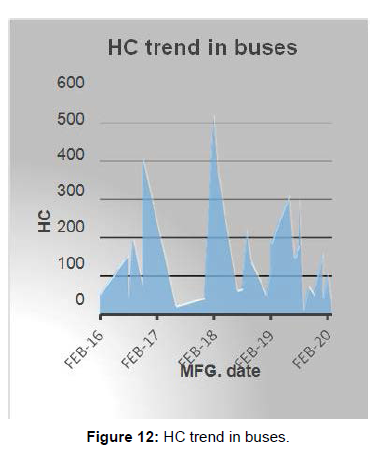
The permissible limit of HC for buses is 200 ppm. When ppm was measured for buses some buses were exceeding the permissible limit as shown in chart (Figure 12) [9].
Discussion
The data was collected from different pollution checking centers in Delhi. For different vehicles i.e., four-wheeler, two-wheeler, trucks, mini trucks and buses. The values of CO, HC, and rpm of vehicles were measured and compared with prescribed standards given by govt. while checking it was found that some vehicles were exceeding the permissible limit. The HSU was measured for diesel vehicles. The vehicles that were exceeding the permissible limits are a great threat to the environment. The data of around 256 vehicles were collected and their descriptive statistics are also given. The mean of hydrocarbons for all vehicles is found 143 which is overall within the permissible limit. And the mean of carbon monoxide is 0.20 it is also within the permissible standards [10-12].
Conclusion
In this study, we have measured different pollutants like carbon monoxide and hydrocarbon for petrol and CNG vehicle. The Hartridge Smoke Unit (HSU) is measured for diesel vehicles. The emission of around 150 vehicles was measured including 2 wheeler, 4 wheeler, mini trucks, trucks, and buses. This study includes BS- III, BS-IV, and some BS-VI Vehicles. In BS-III the prescribed limit for HSU for diesel vehicles was 65 and in BS-IV it was 50. The average measured values were 41.99 and 42.27 in BS-VI and BS-IV respectively. These values were within the prescribed limit. The emission of carbon monoxide and hydrocarbons was measured for petrol and CNG driven vehicles. The values of some vehicles were found higher than prescribed limits. Mostly the old vehicles have higher limits of CO and HC. Some new vehicles were also exceeding the prescribed limits. The main reason for this, no proper maintenance of vehicles [13].
The BS-VI is now compulsory for all vehicles in all over India. These standards are made to combat the air pollution caused by vehicles. The limits of different pollutants and fuels are prescribed in these standards. Due to improper maintenance of vehicles, some vehicles exceed the prescribed limits of emissions. Which is a measured cause for air pollution by vehicles? Some CNG vehicles also exceeded the prescribed limit. The vehicles which are running within the permissible limit also exhaust some pollutants. In Delhi, as the numbers of vehicles are increasing day by day the air pollution is also increasing because the quantity of pollutants will increase in a particular area as the numbers of vehicles increase [14].
Overall, the govt should prescribe emission norms after few years and the maintenance of vehicles should be done as per their scheduled time. Proper maintenance of vehicles can help in maintaining the emission limits prescribed by the concerned authority. The new standards have fuel containing 10 ppm of sulphur as compared to 50 ppm in BS-IV. It will improve the quality of fuel and make it less harmful to the environment [15].
References
- West SE (2004) Distributional effects of alternative  vehicle  pollution   control policies. J Public Econ 88: 735-757.
- Cubbin MC, Donald R, Delucchi MA (1999) "The health costs of motor-vehicle-related air pollution." J Transp Econ Policy 253-286.
- Zhang K, Batterman S (2013) Air pollution and health risks due to vehicle traffic. Sci Total Environ 450: 307-316.
- Tiwari S, Thomas A, Rao P, Chate DM, Soni VK, et al. (2018) Pollution concentrations in Delhi India during winter 2015-16: A case study of an odd-even vehicle strategy. Atmos Pollut Res 9: 1137-1145.
- Goel R, Guttikunda SK (2015) Evolution of on-road vehicle exhaust emissions in Delhi. Atmos Environ 105: 78-90.
- Kathuria V (2004) Impact of CNG on vehicular pollution in Delhi: A note. Transp Res D Transp Environ 9: 409-417.
- Goyal P (2003) Present scenario of air quality in Delhi: a case study of CNG implementation. Atmos Environ 37: 5423-5431.
- Burr ML, Karani G, Davies B, Holmes BA, Williams KL (2004) Effects on respiratory health of a reduction in air pollution from vehicle exhaust emissions. Occup Environ Med 61: 212-218.
- Hu S, Herner JD, Robertson W, Kobayashi R, Chang MCO, et al. (2013) Emissions of Polycyclic Aromatic Hydrocarbons (PAHs) and Nitro-PAHs from heavy-duty diesel vehicles with DPF and SCR. J Air Waste Manag Assoc 63: 984-996.
- Marr LC, Kirchstetter TW, Harley RA, Miguel AH, Hering SV (1999) Characterization of polycyclic aromatic hydrocarbons in motor vehicle fuels and exhaust emissions. Environ Sci Technol 33: 3091-3099.
- Zielinska B, Sagebiel J, Arnott WP, Rogers CF, Kelly KE, et al. (2004) Phase and size distribution of polycyclic aromatic hydrocarbons in diesel and gasoline vehicle emissions. Environ Sci Technol 38: 2557-2567.
- Singh TS, Verma TN, Nashine P, Shijagurumayum C (2018) BS-III diesel vehicles in imphal, India: An emission perspective. J Air Pollut Control 73-86.
- Kalghatgi G (2018) Is it really the end of internal combustion engines and petroleum in transport ?. Appl Energy 225: 965-974.
- Chong HS, Kwon S, Lim, Y, Lee J (2020) Real-world fuel consumption, gaseous pollutants, and CO2 emission of light-duty diesel vehicles. Sustain Cities Soc 53: 101925.
- Heck RM, Farrauto RJ (2001) Automobile exhaust catalysts. Appl Catal A: General 221: 443-457.
Citation: Gour A, Prajapati B, Gautam K, Kumar A (2021) A Study on the Analysis of CO, HC, CO2 from Vehicles and their Impact on the Environment. Air Water Borne Dis 10: 141. DOI: 10.4172/2167-7719.1000141
Copyright: © 2021 Gour A, et al. This is an open-access article distributed under the terms of the Creative Commons Attribution License, which permits unrestricted use, distribution, and reproduction in any medium, provided the original author and source are credited.
Select your language of interest to view the total content in your interested language
Share This Article
Open Access Journals
Article Tools
Article Usage
- Total views: 3151
- [From(publication date): 0-2021 - Nov 16, 2025]
- Breakdown by view type
- HTML page views: 2425
- PDF downloads: 726
