A Study of the Performance and Carbon Credit Analysis of a 6 KWP Rooftop Solar Photovoltaic Power Plant at Sanjay Group Aurangabad, India
Received: 29-Mar-2019 / Accepted Date: 16-Apr-2019 / Published Date: 23-Apr-2019
Abstract
The performance analysis of a solar Photo Voltaic power plant is important aspect as far as concern with technology and economic analysis. Due to seasonal variation standalone system cannot provide a continuous power supply. Therefore, in recent years Photo Voltaic energy systems that combine solar energy and other conventional conversion units are becoming more popular and efficient fulfill the consumers load demand. Solar energy is clean, infinite and environment friendly source of energy. The performance of Photo Voltaic technology depends upon the operating conditions like module operating temperature, solar insolation, shading and dusting on the module. This paper presents overall performance and economic analysis of a 6 kW off grid solar Photo Voltaic system over a period of February 2017 to January 2018. By keeping a goal to study the performance and carbon credit analysis of solar roof top Photo Voltaic systems on the yearly basis, the power generation achievement as per target value is close to 83%. Also, on the basis of actual power generation the payback period of this rooftop mounted system is 9 years.
Keywords: Solar energy; Carbon credit; Solar photo voltaic; Power plant
Introduction
Energy consumption of a country is one of the important indicators of its socioeconomic development. With the ever increasing energy demand, load shedding, pollution and global warming we have to switch over to environment friendly options like renewable energy resources. Our country has shown rapid deployment of renewable energy technologies such as solar, wind and bioenergy. Solar energy is clean, inexhaustible, environment friendly, abundant and freely available resource among the various renewable energy options [1].
Photovoltaic (PV) means the direct conversion of sunlight in to electricity. It is an attractive alternative to conventional sources of electricity for various reasons: it is silent, non-polluting, and renewable; it is reasonably reliable; requires simple maintenance; also, can be installed anywhere as per requirement.
In addition this technology has additional benefits as: day by day the system costs largely reduced; power is produced at the point of end use; so that transmission and distribution costs are significantly reduced and deduce theft of electricity. India has an average 250-300 clear sunny days out of 365 days and average incident solar radiation is an around 4-7 kWh/m2 per day [2]. Today different companies are developing PV panels with several manufacturing technologies. These PV panels can have the almost same maximum power at standard test condition, but the technical information provided from standard test conditions may never occur in practice [3], not only due to spectral reactions, temperature coefficients, voltage and current values which are different, but also to their reactions to environmental factors like radiation, temperature and wind speed.
However, grid-connected PV systems will not be attractive unless power production is large scale and the cost of electrical energy produced by it is comparable to other conventional energy sources [4,5]. Several types of research work, in different places in the world, about the performance and characteristics of grid connected systems have been found in the literature [6,7]. Recently Indian government launched net metering system for domestic and commercial application, in which any one can install solar PV set up as load per sanctioned by energy Distribution Company. Energy generated from solar PV system can be used for regular use; if they don’t need of electricity then they can sell to government.
We have injection moulding machine plant, which requires too much electricity for moulding. For sustainable development to use of natural resources we have installed 6 kWp solar plant on terrace roof. This paper presents overall performance, payback period and carbon credit analysis of 6 kWp roof top PV plant on the basis of experimental data collected over a specific period.
Methodology and Plant Details
The 6 kWp rooftop solar PV plant is installed in Feb 2017 at company premises of Sanjay Techno Product Pvt Ltd. It consists of 19 modules, each module rated at 315 Wp. All modules were divided into two strings and connected them in series for each string. Two strings have been wired to an inverter rated 6.9 kWp. The PV plant is located in Aurangabad district of Maharashtra state with latitude 19.87°N, and longitude 75.34°E. All modules were inclined and tilted equal to their site's optimum inclination angle (30°) toward the equator to get better output, as shown in Figure 1. The installed PV systems have been fully monitored and supervised to study its performance. More detailed specifications of the PV module and the inverter are described Table 1.

Figure 1: A photograph of rooftop mounted 6 kW solar PV plant.
| Parameter | Value | Unit |
|---|---|---|
| PV Panel Type | JAP6-72-315/4BB | |
| Module size | 990 × 1960 | mm2 |
| Voltage at max. power of single module (Vm) | 37.19 | V |
| Current at max. power of single module (Im) | 8.47 | A |
| Open circuit voltage (Voc) | 45.95 | V |
| Short circuit current (Isc) | 8.98 | A |
| Total no. of modules | 19 | No |
| Module capacity | 315 | Wp |
| Power of the system (Pmax) | 5.985 | kW |
| Inverter Type | Polycab/PSIT-6K | |
| Power PDC max | 6.9 | kW |
| VDC max | 1 | kV |
| IDC max | 15 | A |
| VDC start-up | 330 | V |
| VAC normal | 400 | V |
| FAC normal | 50 | Hz |
| I AC max | 10 | A |
| Power factor | -0.8 to +0.8 | |
| Temperature range | -25 to 60 | °C |
Table 1: Technical parameters of installed 6 kW SPV and inverter system.
The performance results of installed PV systems had been monitored from February 2017 to January 2018 to investigate operational characteristics of setup. The daily output power generation of PV array for the month of April 2017 is shown in Figure 2. The variation in solar radiation and weather condition can affects the daily power generation. The maximum power produced 27 kWh which was observed on 5th and 12th day of April 2017. As far as considered Aurangabad's solar potential daily power generation per kW of installed capacity is about 4 to 4.25 kWh, thus the targeted value about 24 kWh. In this month average power was 21 kWh and minimum power was 14 kWh generated on 1st and 21st day of April 2017.

Figure 2: Energy generation per day in April 2017 from 6 kW solar photo voltaic plant.
Figure 3 shows the monthly average power generation. The average power generation during this period was 17 kWh, maximum power can generated during summer (22 kWh) whereas, lowest power generated in July month i.e. monsoon season (11 kWh). During this period the total power production from this plant was 6005 kWh.

Figure 3: Monthly average power generation.
Figure 4 Shows total month wise power generation during the period of Feb 2017 to Jan 2018). During this recorded period the system produced energy with average value of 500 kWh. Maximum energy produced during this period was 633 kWh in the month of April 2017; minimum energy produced in July and it was 340 kWh.

Figure 4: Monthly power generation from 6 KW solar photo voltaic plant.
The power output from solar PV system increases according to clear solar radiation, ambient temperature and cleaning frequency. The Figure 5 below shows monthly variation in power generation and cumulative power generation.

Figure 5: Monthly energy generation and their cumulative generation from 6 kW solar photo voltaic plant.
As per weather condition of our city and technical data for daily power generation form this plant we set daily power generation 24 kWh is target value, whereas, monthly 700 and yearly 7200 kWh. On the basis target value and actual power generation we calculate percentage of achievement, which is shown in Table 2. We achieved target up to 71% on monthly basis and 83% on annual basis.
| Parameter | Monthly generation | Yearly generation |
|---|---|---|
| Target value, kWh | 700 | 7200 |
| Actual generation, kWh | 500 | 6005 |
| Achievement % | 71 | 83 |
Table 2: Power generation achievement as per targeted value.
Economic Analysis
The 6 kWp commercial rooftop PV plant had been built and set up completely by a specialized company. The investment total cost is ₹415002, including 19 PV modules, 6 kW inverter, accessories and labour cost to build the plant. Table 3 collects important data to calculate the Net Present Value (NPV) of the PV project.
| Parameter | Value | Unit |
|---|---|---|
| Plant capacity | 6 | kW |
| Plant total cost | 415002 | ₹ |
| Feed in tariff rate | 8 | ₹/unit |
| Initial annual yield | 6005 | unit |
| Initial annual yield | 48040 | ₹ |
| Yield reduction rate | 0.05 | % |
| Project period | 20 | years |
Table 3: Economic data of the 6 kW PV plant.
The Net Present Value (NPV) is profit value calculated by subtracting the present values of cash outflows from the present values of cash inflows over a period of time. It is shown by equation below [8,9].
To generate NPV curve by
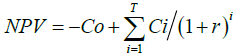
Where
Co: Plant total cost (investment),
Ci: Incoming cash flow,
r: Discount rate,
i: Time step (year),
T: Time period (20 years for this project),
Ci: can be calculated as
Ci= Ci-1X (1-Yield reduction rate)
The Figure 6 shows complete generated NPV curve in which there are two plots one is actual power generated. From the above figure the cash flow from this rooftop PV plant will positive after 9th year until 20th year with (₹) 495227 profit. Initial invest is high for such technology but is a reliable investment.

Figure 6: The 6 kWp rooftop PV plant NPV profile.
Carbon Credit
Carbon credits are a key component of national and international emissions trading schemes that have been implemented to mitigate global warming. They provide a way to reduce greenhouse effect emissions on an industrial scale by capping total annual emissions and letting the market assign a monetary value to any shortfall through trading. Credits can be exchanged between businesses or bought and sold in international markets at the prevailing market price. Credits can be used to finance carbon reduction schemes between trading partners and around the world.
A carbon credit is a generic term for any tradable certificate or permit representing the right to emit one tonne of carbon dioxide or the mass of another greenhouse gas with a carbon dioxide equivalent (tCO2e) equivalent to one tonne of carbon dioxide.
CO2 Reduction
The reduction of carbon dioxide emission by Solar Photovoltaic Power Plants installed all over the world has been compiled by Denis Lenordic. Data for CO2 emission reduction by the top 200 Solar Photovoltaic Power Plants are available at http://www.pvresources.com/en/top50pv.php [10]. The data available on this link which include power produced per annum in MWh, annual carbon emission reduction. Average annual carbon emission reduction per MWh of electricity produced, for the top 100 solar voltaic power plants, data of electricity produced in MWh and emission reduction per annum for which are available, comes to 0.932 tons of carbon dioxide emission reduction per MWh of electricity produced [8,9].
So, we get, 1 KWh of energy generated by any solar photovoltaic power plant= 0.932 kg of carbon dioxide reduction. Taking this average value (0.932 kg of carbon dioxide emission reduction per KWh for the Solar PV plant installed in India).
The carbon dioxide emission reduction= 0.932 * 6= 5.6 tons of CO2/annum.
If the life of project is 20 years then the total carbon dioxide reduction =111.93 tons of CO2
Carbon Credit earned by the plant
If CO2 emission reduction at present is traded @ €21/tCO2e, as per European Climate Exchange policy [11], then the carbon emission reduction by this SPV Power plant in 20 years is as follows.
So, yearly carbon credit earned by this SPV Power plant=5.6 × 21 × 83.56=9822 ₹/year
(Where, 1€=₹ 83.56 as on 29th October 2018)
Thus, the Carbon credit earned by this SPV Power plant over 20 year’s plant life is 9822 × 20=196430 ₹
Conclusion
Initial cost of this technology is high but government giving subsidy, net metering system so, the cost of these technologies is affordable. Also, the output of the plant mainly depends on the availability of clear sunlight over the year, location and its maintenance (i.e. cleaning). If the system is single or dual axis its performance suddenly increases but technology cost also increases. Yearly CO2 reduction about 5.6 ton and over a life of plant it reaches up to 112 ton. By considering actual power generation simple payback period of this plant is 9 years without considering carbon credit. If we consider the carbon credit the payback period reduces up to 4 to 5 years. Also, we can achieve power generation up to 83% of the target value. There is scope for improvement the performance of this plant by time to time maintenance.
References
- Patil RG, Kale DM, Panse SV, Joshi JB (2014) Numerical study of heat loss from a non-evacuated receiver of a solar collector. Energy Convers Manag 78: 617-626.
- Sharma D (2011) Performance of solar power plants in India. Central Electricity Regulatory Commission.
- Durisch W, Tille D, Wörz A, Plapp W (2000) Characterisation of photovoltaic generators. Appl Energ 65: 273-284.
- Mellit A, Pavan AM (2010) Performance prediction of 20 kWp grid-connected photovoltaic plant at Trieste (Italy) using artificial neural network. Energy Convers Manag 51: 431-2441.
- Ghiani E, Pilo F, Cossu S (2013) Evaluation of photovoltaic installations performances in Sardinia. Energy Convers Manag 76: 1134-1142.
- Kymakis E, Kalykakis S, Papazoglou TM (2009) Performance analysis of a grid connected photovoltaic park on the island of Crete. Energy Convers Manag 50: 433-438.
- Micheli D, Alessandrini S, Radu R, Casula L (2014) Analysis of the outdoor performance efficiency of two grid connected photovoltaic systems in northern Italy. Energy Convers Manag. 80: 436-445.
- Prabhakant, Tiwari GN (2008) Evaluation of carbon credits earned by a solar energy park in Indian conditions. The Open Fuels & Energy Science Journal 1: 57-66.
- Tiwari GN, Dubey S (2010) Fundamentals of photovoltaic modules and their applications. Cambridge: The Royal Society of Chemistry.
- Progress report to Parliament Committee on Climate change (2009) Meeting carbon budgets - the need for a step change.
Citation: Kale D, Kokil P (2019) A Study of the Performance and Carbon Credit Analysis of a 6 KWP Rooftop Solar Photovoltaic Power Plant at Sanjay Group Aurangabad, India. Innov Ener Res 8:226.
Copyright: © 2019 Kale D, et al. This is an open-access article distributed under the terms of the Creative Commons Attribution License, which permits unrestricted use, distribution, and reproduction in any medium, provided the original author and source are credited.
Share This Article
Recommended Journals
Open Access Journals
Article Usage
- Total views: 4206
- [From(publication date): 0-2019 - Apr 01, 2025]
- Breakdown by view type
- HTML page views: 3253
- PDF downloads: 953