Case Report Open Access
A Strategy for GC/MS Quantification of Polar Compounds via their Silylated Surrogates: Silylation and Quantification of Biological Amino Acids
Marco Guida1, Maria Michela Salvatore1 and Francesco Salvatore2*
1Dipartimento di Biologia, Università degli Studi di Napoli “Federico II”, via Cintia, 21, Napoli, Italy
2Dipartimento di Scienze Chimiche, Università degli Studi di Napoli “Federico II”, via Cintia, 21, Napoli, Italy
- *Corresponding Author:
- Francesco Salvatore
Dipartimento di Scienze Chimiche
University of Naples “Federico II”
Via Cintia, 21-80126 Napoli, Italy
Tel: 39 081 674389
E-mail: frsalvat@unina.it
Received date: July 19, 2015; Accepted date: July 28, 2015; Published date: August 04, 2015
Citation: Guida M, Salvatore MM, Salvatore F (2015) A Strategy for GC/MS Quantification of Polar Compounds via their Silylated Surrogates: Silylation and Quantification of Biological Amino Acids. J Anal Bioanal Tech 6:263 doi:10.4172/2155-9872.1000263
Copyright: © 2015 Salvatore F, et al. This is an open-access article distributed under the terms of the Creative Commons Attribution License, which permits unrestricted use, distribution, and reproduction in any medium, provided the original author and source are credited.
Visit for more related articles at Journal of Analytical & Bioanalytical Techniques
Abstract
Substitution of polar functionalized compounds with silylated (e.g., trimethylsilylated) surrogates prior to GC/ MS analysis is a widely used analytical strategy. Calibration is a most demanding step of this strategy. In fact, a calibration function is usually acquired by converting known amounts of the pure analyte to its silylated surrogate using the same conditions employed for processing unknown samples. The cumbersome need of acquiring a new calibration function prevents, to a large extend, the possibility of modifying silylation and instrumental settings on a sample by sample basis as would be appropriate in a number of cases. The modified standard additions calibration method, suggested in this paper, overcomes this difficulty by integrating in a single analytical procedure calibration and sample analysis. Furthermore, the suggested procedure compensates for matrix effects which may be a serious source of inaccuracy and is a tool that can be used during method development in order to find the most suitable silylation conditions for a given analyte. The implementation and benefits of the modified standard additions calibration method are explored in this paper on the basis of a symbolic but enlightening experiment dealing with the very representative GC/MS quantification of biological amino acids via their trimethylsilylated derivatives.
Keywords
Derivatization; Silylation; Gas chromatography; Mass spectrometry; Amino acids; Standard additions; Internal standard
Introduction
Silylation, i.e., the substitution of hydrogen atoms of carboxylic, alcoholic, amino, etc. groups with tri-alkylsilyl groups (-SiR3), is a very powerful and convenient single step derivatization strategy which, in abstract, could convert a variety of polar compounds to trialkylsilyl derivatives which are eminently suitable for GCGasChromatography/ MSMassSpectrometry analysis [1,2].
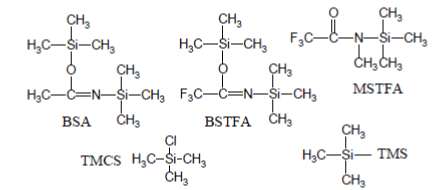
The most popular silylation reagents are trimethylsilyl (TMS) donors (e.g., BSA↵[N,O-bis(triGC/MS experiment, called MSAMmethylsilyl)acetamide]; BSTFA↵[N,Obis( trimethylsilyl)trifluoroacetamide]; MSTFA↵[N-Methyl-N-(trimethylsilyl) trifluoroacetamide]) eventually enriched with trimethylchlorosilane (TMCS) [2-4]:
Typically, silylation procedures consist of a preliminary step in which the sample to be analyzed is carefully dried since water (and protic solvents) destroys silylation reagents. The anhydrous residue is then treated with a small volume of a mixture of silylation reagent and an aprotic solvent in a small vial which, finally, is hermetically sealed and forced through a heat treatment (which is necessary for most analytes because silylation reactions often progress slowly at room temperature).
Usually, heat is applied by mounting the sealed vial in a metallic block heated at a prescribed temperature for a prescribed length of time or, in alternative, incubating the sealed vial for a few minutes in a microwave oven [3,5].
When this process has been completed about 1 micro litre of the cooled reaction mixture containing silylated derivatives is injected in the GC/MS.
The yield of silylation reactions and, at the end, the nature and amount of silylated products, in the reaction mixture which is presented to the GC/MS, is controlled and modulated by a plethora of factors which comprise the nature of the derivatization agent and solvent, the temperature, the length of time and mode of the heat processing [6].
For qualitative applications, silylation is generally recognized as the most convenient and universal way in which a variety of functionalized substances, which as such do not have suitable gas chromatographic properties, can be made amenable to gas chromatography.
However, consensus on the usefulness of silylation drops dramatically when, in addition, quantification of detected analytes is required.
For instance, Villas-Bôas et al. [7], compared the analytical performance of silylation with MSTFA and alkylation with methyl chloroformate, prior to GC/MS analysis of a number of amino and non-amino organic acids, and concluded that alkylation was preferable because of the poorer reproducibility of procedures based on trimethylsilylation.
In practice, derivatization procedures are only an implementation of a general and very old principle of analytical chemistry according to which a substance to be analyzed is substituted by another substance (a surrogate) which is more easily determined than the original substance.
In abstract, when a surrogate is substituted for the original analyte, calibration for quantitative analysis can take place according to one of two ways.
If the surrogate is available as a pure substance and the degree of conversion of the original analyte to its surrogate is constant and known one can use pure solutions of the surrogate for calibration.
On the contrary, if the surrogate cannot be isolated in a pure form and/or the degree of conversion of the original analyte to its surrogate is unknown and is dependent on the particular conditions under which substitution takes place, calibration must be performed by converting known amounts of the original analyte to its surrogate (using the same procedure employed for processing unknown samples).
Because silylated compounds cannot be isolated and the efficiency of silylation procedures is usually unknown, calibration for quantitative GC/MS analysis via silylation takes always place by converting known amounts of the pure analyte to its silylated surrogate (using exactly the same silylation procedure to be employed for the measurement of unknown samples).
Obviously, for accurate and reproducible quantitative results, it is mandatory that the ratio between the amount of the original substance and the amount of its silylated surrogate be maintained constant throughout the whole analytical process of calibration and samples measurements.
The weakness of quantitative GC/MS analysis via silylation depends entirely on difficulties in maintaining a constant degree of conversion of the analyte to its silylated product (or products) both during measurement of the calibration function and analysis of unknown samples. Among other things, the sample matrix may substantially contribute to this difficulty since it is well known that a variety of substances (e.g., salts, acids and bases) may influence the yield of silylation reactions and then the degree of conversion of an analyte to its silylated surrogate [6,7].
In GC/MS, stable isotope dilution analysis elegantly overcomes problems connected with the variable degree of conversion of the analyte to its surrogate, during calibration and analysis. In fact, isotope dilution analysis is a form of internal standardization in which a known amount of the stable isotope labelled analyte is added to the sample prior to derivatization and analysis and this, in practice, makes each analyzed sample auto calibrating [8,9].
Nevertheless, isotope labelled compounds are very expensive or in some cases may be unavailable, so much so that the search for alternative procedures which can cope with the special problems introduced by the silylation step before quantification via GC/MS is a worth undertaking.
In this paper we describe an analytical procedure, which for brevity is indicated as MSAM (modified standard additions method), which (as opposed to a rigid protocol to be implemented exactly in the same way during calibration and analysis) introduces flexibility on a sample by sample basis (since calibration and analysis are integrated in a single procedure) and, in addition, has many attributes which can improve reproducibility and accuracy of quantification via GC/MS after silylation.
In fact, the modified standard additions method is a combination of the conventional standard additions and internal standard calibration methods which compensate both for matrix effects on the sample response (as it is typical of the conventional standard additions calibration method) and for the intrinsic erratic nature of the GC/MS response (as it is typical of the internal standard calibration method) [10].
Within the context of GC/MS quantification via silylation, in our laboratory we frequently perform an introductory or preparatory GC/MS experiment, called MSAM basic experiment, in which an accurately measured volume of the standard solution of the analytes to be quantified (which in the frame of the standard additions method is used to perform on a given sample the known standard additions) is in all respects regarded as the sample to be analyzed using the MSAM procedure. Although, at first sight, it may appear odd that a solution of the analytes is used in the same experiment as a standard solution for calibration and as the sample to be quantified, the MSAM basic experiment is very useful to provide the information necessary to accurately determine analyte concentration in real samples.
In the following the modified standard additions method is presented by carrying out the MSAM basic experiment on a standard solution of the biological amino acids.
Because of their variety and variability of behaviour with respect to silylation reactions, biological amino acids hardly can all be determined on the basis of a single analytical protocol based on a fixed silylation agent, solvent and heat processing. Then, biological amino acids are eminently suitable to show the use of the MSAM basic experiment and, by extension, the benefits of a sample oriented approach in which silylation conditions and instrumental settings can be modified ad hoc, case by case, according to the analyst judgment, to target specified analytes (without the cumbersome need of collecting a new calibration function each time silylation conditions are modified or, for instance, when the mass analyzer mode is switched from scan to SIM).
Modified Standard Additions Calibration Method (MSAM)
MSAM basic experiment
The MSAM basic experiment described below and discussed in this paper in order to present the modified standard addition method was performed using a 100 μM solution of all biological amino acids plus Norleucine in 0.05M HCl.
First, 25 μl of the above standard solution were transferred into each of four small vials (labelled Vial0, Vial1, Vial2 and Vial3).
Then, standard additions of 25 μl, 75 μl and 175 μl of the same standard solution of amino acids, were made, respectively, to Vial1, Vial2 and Vial3.
After this, the four specimens in the four vials were carefully dried by warming the vials at a temperature of about 60°C under vacuum.
Then, to the anhydrous content of each vial, 25 μl of acetonitrile containing 200 μM Naphthalene internal standard and 25 μl of BSTFA/1%TMCS silylation reagent were added.
Finally, the four vials (containing each 50 μl of silylation mixture) were tightly sealed, mounted, for the heat processing, on a rotating shaft which was immersed in a flux of air heated at about 100°C and kept for one hour.
At the end of the heat treatment the four vials were cooled, placed in a queue and, about 1 μl of reaction mixture was injected, in sequence, in the GC/MS which was programmed to execute the GC/MS method described below in the scan mode of the mass analyzer and collected four GC/MS data file.
For convenience, the GC/MS data file acquired by injecting the reaction mixture in VialX will be designed as GC/MSdataX.
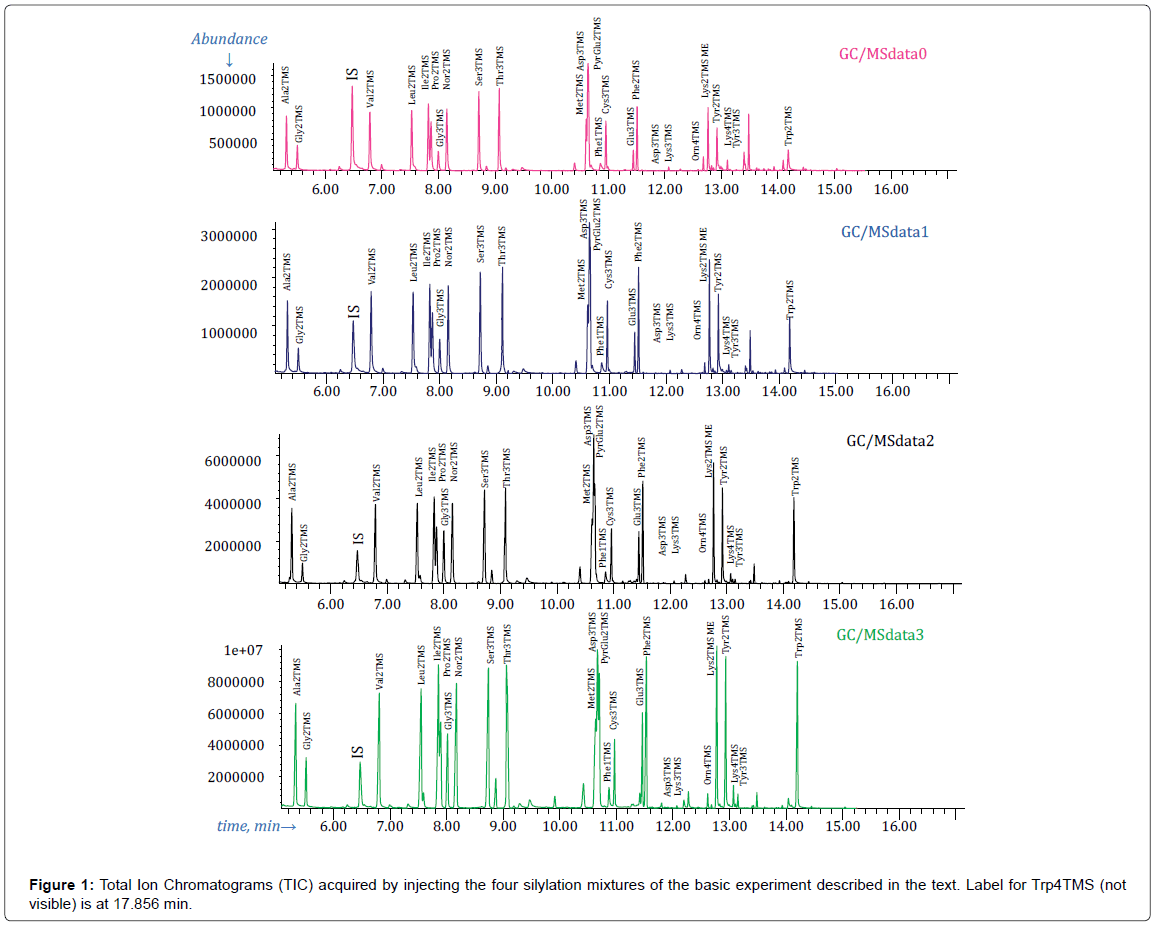
Total Ion Chromatograms (TIC) reconstructed from GC/MSdata0, GC/MSdata1, GC/MSdata2 and GC/MSdata3 files, acquired in the course of the MSAM basic experiment described above, are presented in Figure 1.
In the following we shall also refer to two modified forms of the main basic experiment described above. In the basic experiment indicated as MW basic experiment, the heat treatment of the main basic experiment was replaced with a short heating in a domestic microwave oven (5 min at a microwave power output of 800 W) and pure BSTFA was substituted for BSTFA/1%TMCS. In a third version of the basic experiment, which will be indicated as 4% basic experiment, the BSTFA/1%TMCS silylation mixture of the main basic experiment was substituted with BSTFA/4%TMCS and a prolonged heat treatment (2.5 h) was performed by mounting the four vials in a metallic block at 95°C.
In the course of our study of amino acids silylation reactions a conspicuous number of experiments on amino acids solutions were performed for a variety of purposes and basic experiments were replicated several times, although not all data will presented or mentioned in the following.
General features of MSAM procedure
In the MSAM basic experiment described above the initial 25 μl of standard solution are regarded in all respects as the hypothetical sample to be analyzed.
During the application of the modified standard additions method to a real sample, a measured volume of sample is substituted for the 25 μl of standard solution of the basic experiment.
Norleucine, which on a real sample is not a biological amino acid to be quantified, is used as a pilot compound in the MSAM basic experiment and procedure, in a sense that will be explained below.
Because of this, the MSAM procedure prescribes that, when a real sample non containing Norleucine is processed for biological amino acids, Norleucine be added in a known and constant amount to each of the four vials (using a standard solution of Norleucine). Eventually, Norleucine can be substituted with another compound, proved to be suitable, when non amino acids analytes are concerned.
The three standard additions of 25 μl, 75 μl and 175 μl performed respectively into Vial1, Vial2 and Vial3, transfer into the 50 μl of reaction medium, respectively, 50 μM, 150 μM and 350 μM of each amino acid. These concentrations are mentioned in the frame of MSAM procedure as added concentrations.
Analogously, the sample transfers to the reaction medium a concentration of each amino acid to which we shall refer as reaction medium sample concentration. For instance, in the case of the basic experiment, 25 μl of the hypothetical sample (which is assume to be 100 μM in each analyte) transfers to the reaction medium a sample concentration of 100?25/50=50 μM.
In each vial there will be a total concentration of each analyte which is the sum of the added concentration and the reaction medium sample concentration.
The reaction medium sample concentration (which coincides with the concentration of a given analyte in Vial0) is the most direct result of the modified standard additions procedure. The actual sample concentration is calculated by multiplying the reaction medium sample concentration by the ratio between reaction medium and sample volumes.
Please note that, in all cases, the reaction mixtures in the four vials have exactly the same volume and composition, except for the concentrations of the analytes in the solution used to make standard additions. These are exactly the conditions postulated for the ideal operation of the standard additions calibration principle and are realized automatically because of the drying step before derivatization.
By applying existing analysis protocols, in which measurement of calibration points and of sample response are nonconcurring, it is mandatory a strict control of temperature and time of the heat processing during calibration and samples measurements.
This need is much relaxed by applying MSAM procedure since the four vials are processed simultaneously and are exposed automatically to the same temperature for the same length of time.
Although we generally use three standard additions during the application of the MSAM procedure, which in our experience are generally sufficient and reduce to a minimum work and time for an analysis, the number of standard additions is not a mandatory prescription of the MSAM procedure and it can be increased in order to enhance confidence in the results.
Materials and Methods
Reagents
100 μM standard solutions of all 20 biological amino acids plus Norleucine were prepared by diluting, with HCl 0.05M, concentrated 5.000 mM aqueous standard solutions of each amino acid. The concentrated standard solutions were prepared by dissolving the appropriate reagent grade amino acid (>99%) in 0.05 M HCl and were stored at 4°C.
BSTFA (Aldrich 155195; Fluka 15222) and Trimethylchlorosilane (Fluka 89595) have been used.
Naphthalene internal standard and acetonitrile HPLC grade were purchased from Carlo Erba Reagents (Italy).
Silylation procedure
Silylation reactions have been performed inside of two ml screw top vials with interlocked 300 μl insert (e.g., Supelco 29109-U). Screw polypropylene hole caps fitted with double faced PTFE/silicone/PTFE septa have been used to prevent leakages of the reaction mixture during heat processing (which is detrimental for precision and accuracy) and to avoid siloxanes contamination (which takes place if the volatile reaction mixture contacts the silicone carrier layer of septa for high temperature applications).
The drying step before silylation was performed by maintaining vials containing specimens at 60°C under vacuum.
Heat processing was performed either in the conventional way by mounting the vials in a heated aluminium block with holes for vials (4% basic experiment), or in a domestic microwave oven (MW basic experiment).
Heat processing during the main basic experiment is based on an in house built device constituted by a shaft, with houses for vials, which can be rotated at a selectable speed; the rotating vials are exposed to a stream of air heated at a selectable temperature (50-120°C) for a selected time interval; when the prescribed time is expired the warm air flux automatically turns to cold air (~10°C) while the shaft keeps rotating so that the vials are efficiently cooled. This configuration of the heat treatment provides continuous stirring of the reaction mixture which favours silylation reactions.
GC/MS method
All data presented in the following were acquired on an Agilent GC/ MS system consisting of the 6850 GC and 5973 Inert MSD controlled by the Agilent ChemStation data system.
The GC was equipped with a HP5MS capillary column (30 m, 0.25 mm, 0.25 μm) and ultra-high purity helium was used as a carrier at a flow rate through the column of 1 ml/min.
The split/splitless injector was held at 250°C. The oven initial temperature was 70°C (hold 1 min) and was programmed to ramp to 170°C at 10°C/min; then was ramped to 280°C at a rate of 30°C/min and held for 5 min. The total run time for each acquisition was 19.66 min but, in general, all silylated amino acids were eluted in about 15 minutes.
The electron impact (EI) ion source was operated at 70 eV and at 200°C. The quadrupole mass filter was kept at 250°C and, in the scan mode, was programmed to scan the range 45-550 Th at a frequency of 3.9 Hz.
In order to keep retention times reproducible (so that they can be used for identification in addition to mass spectra) the GC/MS method was locked on anthracene at 12.500 min [11].
Discussion and Results
Basic MSAM data analysis
In the application of MSAM procedure, reviewing the data in GC/ MSdata0 file is of the outmost importance since only analytes whose surrogates can be detected from this data file are deemed to be present in the sample and eventually submitted to quantitative evaluation.
Labels in Figure 1 must be interpreted as placeholders roughly indicating the expected retention time of the indicated amino acid derivative as deduced by silylating and analyzing, with the same GC/ MS method, pure solutions of each amino acid under a variety of silylation conditions.
There is no label for Histidine derivatives since we have never succeeded in preparing detectable amounts of any of the expected trimethylsilyl derivatives of this amino acid. This is somewhat puzzling since, for instance, in ref. [14], Histidine is reported to be silylated to His2TMS, in an aqueous plant extract, after a short heat treatment in a microwave oven (3 min at 180 W), although the exact reagents and amounts are not mentioned in the publication.
Apart from that, visual inspection of the TIC reconstructed from GC/MSdata0 file (first chromatogram in Figure 1) shows that most of the labels correspond to well-developed peaks. Obviously, this is interpreted as a strong indication that the corresponding derivative was present in the injected mixture and it is confirmed on the basis of the mass spectrum.
In practice, GC/MSData0 file was conveniently searched for amino acids trimethylsilylated derivatives using the NIST program AMDIS (Automated Identification and Deconvolution System) [12] (http:// chemdata.nist.gov/mass-spc/amdis/downloads/) and a custom MS target library with mass spectra and retention times of an assortment of amino acids silylated derivatives acquired by silylation of pure solutions of amino acids under a variety of conditions (using the GC/MS method described above) [13].
AMDIS analysis of GC/MSdata0 file identified, in a matter of seconds, all derivatives which have a label in Figure 1, except Asn3TMS, Lys3TMS, Lys4TMS, Tyr3TMS, Orn4TMS, Trp3TMS and Trp4TMS.
From this we conclude that these amino acids derivatives have not been produced in detectable amounts under the conditions of the basic experiment and, by consequence, cannot be employed for quantification of the corresponding amino acid (although the fact that a label is present in Figure 1 implies that under different conditions the corresponding derivative has been produced in detectable amounts).
In order to avoid interferences from coeluting substances and from ions in the background and ambiguities in integrating overlapping peaks, for each amino acid, an extracted ion chromatogram (EIC) at the mass of a selected target ion characteristic of the amino acid silylated derivative has been used for quantification.
Targets ions for each of the silylated amino acids which have a label in Figure 1 are presented in Table 1 (where also are reported the expected retention times of each derivative and of Naphthalene internal standard).
| Amino Acidtrimethylsilylderivative | RT(min) | Target Ion(Th) | Amino Acidtrimethylsilylderivative | RT(min) | Target Ion(Th) |
|---|---|---|---|---|---|
| Ala2TMS | 5.306 | 116.15 | Phe1TMS | 10.858 | 120.10 |
| Gly2TMS | 5.495 | 102.10 | Cys3TMS | 10.957 | 220.20 |
| Naphthalene IS | 6.470 | 128.10 | Glu3TMS | 11.445 | 246.20 |
| Val2TMS | 6.779 | 144.15 | Phe2TMS | 11.513 | 192.20 |
| Leu2TMS | 7.524 | 158.15 | Asn3TMS | 11.848 | 116.10 |
| Ile2TMS | 7.817 | 158.15 | Lys3TMS | 12.110 | 84.10 |
| Pro2TMS | 7.864 | 142.20 | Orn3TMS | 12.608 | 142.00 |
| Gly3TMS | 7.990 | 174.15 | Lys2TMS methyl ester | 12.766 | 174.00 |
| Nor2TMS | 8.174 | 158.20 | Tyr2TMS | 12.923 | 179.15 |
| Ser3TMS | 8.708 | 204.20 | Tyr3TMS | 13.059 | 218.20 |
| Thr3TMS | 9.081 | 218.2 | Lys4TMS | 13.070 | 174.15 |
| Met2TMS | 10.611 | 176.20 | Trp2TMS | 14.186 | 202.15 |
| Asp2TMS | 10.637 | 232.20 | Trp3TMS | 14.210 | 202.15 |
| PyrGlu2TMS | 10.653 | 156.20 | Trp4TMS | 17.856 | 202.15 |
Table 1: Target ions and expected retention times of amino acids trimethylsilyl derivatives and Naphthalene internal standard.
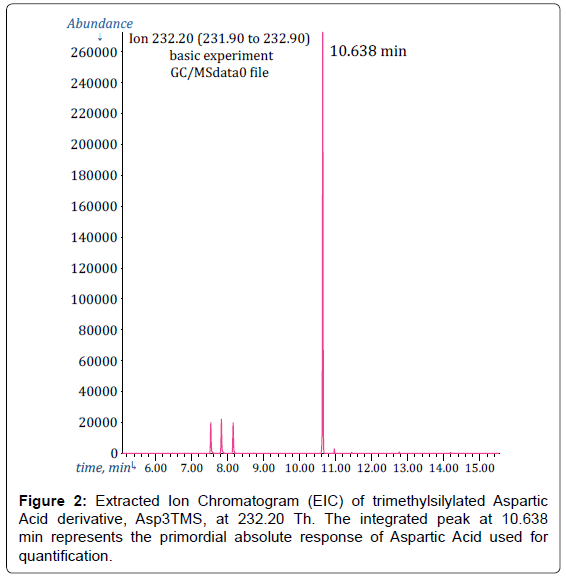
For instance, in Figure 2, it is presented the EIC at m/z=232.2 Th (which corresponds to the target ion of Asp3TMS surrogate of Aspartic Acid) extracted from GC/MSdata0 file. As can be seen, there is a peak in the EIC at 10.638 min which is very close to the expected Asp3TMS derivative retention time.
Please note that, although in the TIC peak of Asp2TMS overlaps with peak of Met2TMS surrogate of Methionine and with peak of PyrGlu2TMS surrogate of Glutamine and Glutamic Acid (see discussion in the next paragraph), no overlapping can be seen in Figure 2, simply because neither Met2TMS nor PyrGlu2TMS produce fragments at 232 Th.
Furthermore, the standard additions calibration method principle requires, for accurate results, that the background be subtracted from the analyte response and this is, in general, automatically obtained by using the integrated signal in the EIC which ascend from a practically null background.
Then, the EIC peak of Asp2TMS is integrated without ambiguities and the area under this peak represents the primordial experimental datum for quantification of Aspartic Acid through its Asp2TMS surrogate.
However, using the target ion EIC for quantification does not suppress the intrinsic variability of the GC/MS response which would be the cause of irreproducibility.
For this reason (as it is typical of the internal standard calibration method), the normalized ratio between the absolute area under the peak of each target ion and the area under the peak of Naphthalene target ion at m/z=128.15 Th has been used for quantification (instead of the absolute EIC response).
Please note that Naphthalene internal standard has been introduced at the same concentration in all reaction mixtures through the solvent.
Finally, from each of the four GC/MSdataX files, for each of the amino acids derivatives detected in the sample, a number is calculated, which for brevity will be called the target ion response ratio (TargetIonRR), representing the ratio of the area under the peak of its target ion and the area under the peak at m/z=128.15 Th of Naphthalene.
In practice, TargetIonRR are calculated by using the standard resources of GC/MS data system which, if suitably programmed, takes care of integrating the EIC peaks of targets and internal standard and then calculates their ratio.
From the four acquisition of the MSAM procedure, four target ion response ratios have been obtained for each detected amino acid derivative. Then, each target ion response ratio has been coupled with the corresponding calculated added concentration in the reaction mixture (0 μM, 50 μM, 150 μM and 350 μM) so that, finally, for each silylated derivative detected, a standard additions plot with four (TargetIonRR, AddedConc) experimental points can be constructed (plotting the four target ion response ratios as a function of the added concentrations).
In the present case, as can be seen from the first column of Table 2, 20 amino acids silylated derivatives, corresponding to 18 different amino acids have been detected in the GC/MSdata0 file so that, in abstract, 20 different standard additions plots can be constructed.
| Amino AcidTMSderivative | Slope(μM-1) | Responseaxisintercept | R2 | Calculated concentration in the standardsolution(μM) | |
| Notreviewed | Reviewed | ||||
| Nor2TMS | 1.095E-02 | 5.547E-01 | 0.999 | 101.4 | accepted |
| Leu2TMS | 1.058E-02 | 5.375E-01 | 0.999 | 101.6 | accepted |
| Ala2TMS | 7.45E-03 | 3.848E-01 | 0.999 | 103.3 | accepted |
| Gly2TMS | 2.30E-03 | 1.075-01 | 0.971 | 93.4 | rejectedsee text |
| Gly3TMS | 3.00E-03 | 1.436E-01 | 0.986 | 95.6 | rejectedsee text |
| Val2TMS | 8.71E-03 | 4.55E-01 | 0.995 | 104.5 | accepted |
| Ile2TMS | 9.16E-03 | 5.33E-01 | 0.999 | 103.5 | accepted |
| Pro2TMS | 9.18E-03 | 4.108E-01 | 0.997 | 89.5 | 96.8 |
| Ser3TMS | 6.95E-03 | 3.302E-01 | 0.997 | 95.0 | accepted |
| Thr3TMS | 3.333E-03 | 1.583E-01 | 0.994 | 95.0 | accepted |
| Met2TMS | 4.87E-03 | 2.295E-01 | 0.998 | 94.2 | accepted |
| Asp2TMS | 5.86E-03 | 3.029E-01 | 0.993 | 103.4 | accepted |
| PyroGlu2TMS | 9.70E-03 | 5.274E-01 | 0.995 | 108.7 | 103.9 |
| Glu3TMS | 3.06E-03 | 1.63E-02 | 0.993 | 10.65 | rejectedsee text |
| Phe1TMS | 1.25E-03 | 7.093E-02 | 0.998 | 113.4 | rejectedsee text |
| Phe2TMS | 4.16E-03 | 1.448E-01 | 0.997 | 69.6 | rejectedsee text |
| Lys2TMS ME | 6.57E-3 | 2.36E-1 | 0.949 | 71.84 | rejectedsee text |
| Cys3TMS | 1.48E-3 | 1.89E-01 | 0.949 | 255.4 | rejectedsee text |
| Tyr2TMS | 6.99E-03 | 2.46E-01 | 1.000 | 70.39 | rejectedsee text |
| Trp2TMS | 1.015E-03 | 2.201E-02 | 0.983 | 43.4 | rejectedsee text |
Table 2: Equations of the regression line through the (TargetIonRR, AddedConc) experimental points in the standard additions plots and calculated concentrations of the standard 100 μM solution of amino acids (data from the main basic experiment in Figure 1). Only concentrations which are affected by an uncertainty (evaluated from the standard additions plot) which does not exceed the set threshold of ± 6% have been accepted.
The hope is that the four points of each plot fall on a straight line since it is the extrapolated intercept, on the concentration axis, of the regression line through the experimental points, which is of analytical significance in the modified standard additions method.
The usefulness of the basic experiment depends on the fact that, as a consequence of the fact that sample and standard solution used for standard additions share exactly the same concentrations, the intercept of the regression line through the (TargetIonRR, AddedConc) experimental points on the x-axis is fixed a priori exclusively from the assumed concentrations of the amino acids and their actual concentrations in the sample and standard solution are completely irrelevant. So much so that we can a priori state that, if all the fundamental assumptions on which quantification via a surrogate of the analyte rests are maintained during the experiment, the (TargetIonRR, AddedConc) experimental points in the standard additions plots of all analyte must be well fitted by a straight line which, within the uncertainties introduced through volume manipulations and response measurements, intercepts the added concentrations axis at -50 μM.
Any departure from this fundamental a piori condition must be interpreted as a warning that assumptions have been violated (and cannot be ascribed to inaccuracies of the analytical variables).
Interpretation of standard additions plots from MSAM basic experiment
Interpretation of data from the MSAM basic experiment (which is employed to prove that silylation and measurement conditions are appropriate for a given analyte) is fundamentally based on a very special function assigned to Norleucine.
This special role has been conferred to Norleucine following a conspicuous number of ad hoc silylation experiments which have demonstrated that Norleucine is readily and consistently silylated to Nor2TMS with BSTFA and BSTFA/TMCS silylation agents, provided that broadly reasonable derivatization conditions are maintained.
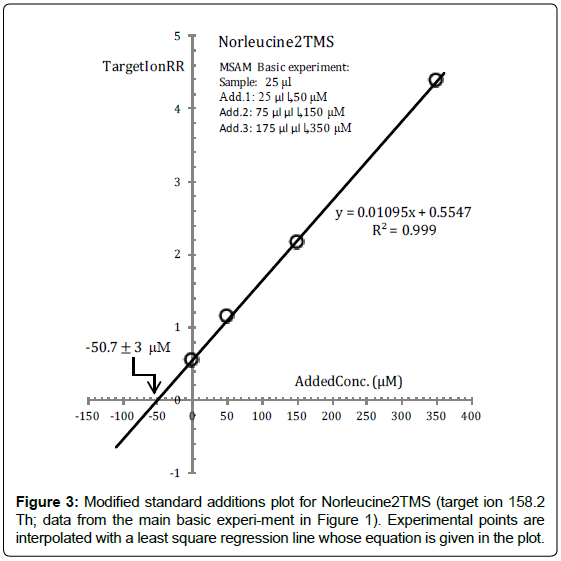
This anticipated very desirable behaviour of Norleucine is clearly demonstrated in Figure 3 which is the standard additions plot of Nor2TMS constructed from data from the main basic experiment.
As can be seen from Figure 3, experimental (TargetIonRR, AddedConc) points are almost perfectly interpolated by a straight regression line which intercepts the concentration axis at -50.7 μM. This is interpreted to mean that the reaction medium sample concentration of Norleucine is found to be 50.7 μM, which can be compared with the a priori known value (50 μM). From this value the concentration of Norleucine in the standard solution is readily calculated to be 50.7(50/25)=101.4 μM.
Because of the proved almost ideal behaviour of Norleucine with respect to silylation reactions, we may infer that dispersion of experimental points around the regression line in the standard additions plot of Nor2TMS is completely ascribable to unavoidable casual variations of volumes and response measurements.
Since these sources of dispersion are exactly the same for all analytes submitted to the MSAM basic experiment, dispersion of experimental points in the standard additions plot of an analyte, exceeding the physiological dispersion exposed by the standard additions plot of Norleucine, must be ascribed to chemical factors connected with the efficiency of silylation reactions.
In other words, during the analysis of the MSAM basic experiment data, we consider the standard additions plot of Norleucine in Figure 3 as a milestone signing the boundary beyond which chemical effects must be invoked to explain observed dispersion of experimental points.
Experimental points’ dispersion around the standard additions regression line can be measured in a variety of ways. However, in order to be practical, we have selected the standard error on the intercept of regression line on the x-axis, symbolized by ESx, as a measure of the spread of the experimental points. In fact, ESx has a very direct analytical significance and is readily evaluated from the coordinates of the experimental points, for instance, with the ERR.STD.YX function of MS Excel.
For instance, from data in Figure 3 we obtain ESx ≈ 3 μM which can be translated into a relative percent uncertainty on the reaction medium sample concentration of Norleucine of ~ ± 100?3/50.7 ≈ ± 6%.
Finally, on the basis of the above considerations, we take the broad view that an uncertainty on reaction medium sample concentration of an analyte (derived from its MSAM basic experiment standard additions plot) substantially exceeding the ± 6% threshold deduced from Figure 3, is a warning of possible violations of fundamental constraints of chemical analysis via surrogate due to badly chosen silylation conditions.
The role of the Norleucine during the analysis of unknown samples is much simpler, since in such a case it is assumed that silylation conditions appropriate for the targeted analytes have been employed and inspection of Norleucine MSAM standard additions plot only serves as a general control that the MSAM procedure has been properly carried out. In fact, as a general rule, if satisfying results are not obtained for Norleucine, hardly they will be obtained for any other analyte. Apart from that, MSAM standard additions plots of analytes are evaluated during analysis of real samples exactly as conventional standard additions plots [10].
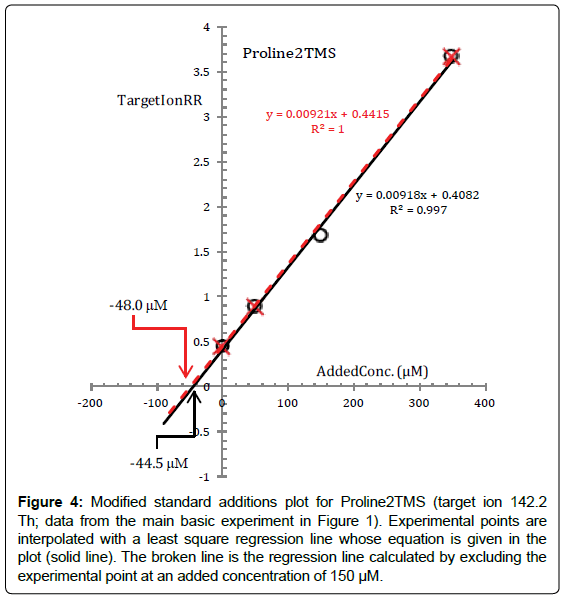
To touch by hand how the above statements operate in interpreting data from the basic experiment, the standard additions plot for Pro2TMS surrogate of Proline (calculated from data in Figure 1) is presented in Figure 4.
Figure 4: Modified standard additions plot for Proline2TMS (target ion 142.2 Th; data from the main basic experiment in Figure 1). Experimental points are interpolated with a least square regression line whose equation is given in the plot (solid line). The broken line is the regression line calculated by excluding the experimental point at an added concentration of 150 μM.
A brute linear regression through the (TargetIonRR, AddedConc) experimental points, as for Norleucine, produces a reaction medium sample concentration of Proline of 44.5 μM which, obviously, is substantially lower than expected, even if Proline has been submitted exactly to the same events as Norleucine. Furthermore, the reaction medium sample concentration of Proline determined from the standard additions plot is affected by an uncertainty (~ ± 20%) which is much higher than the threshold of ~ ± 6% derived from the standard additions plot of Norleucine. This is interpreted to mean that there must be a problem in the data. The problem is seen at blink of an eye from Figure 4, and it concerns the measured target ion response ratio of Pro2TMS in Vial2 (corresponding to an added concentration of 150 μM). It seems that, for unknown reasons, the fraction of Proline which has been converted to Pro2TMS in Vial2 is lower and inconsistent with the silylation efficiency in other vials.
In fact, from Figure 4 we see that the broken line, which is the regression line calculated by excluding this point, intercepts the x-axis at -48.0 μM with an uncertainty which is much under the threshold of ± 6%.
The lesson we learn from this is that Proline could be more susceptible than other amino acids to even minimal alterations either of the reaction medium environment or of the physical processing. In this respect it is useful to remember that the composition of the reaction medium is very complex with dozens of chemical species simultaneously present.
The above example helps in the interpretation of Table 2 which presents, for each amino acid, the equation of the regression line through the experimental (TargetIonRR, AddedConc) points in the standard additions plot (derived from a brute linear interpolation of data) and the corresponding calculated concentration in the standard solution.
The outcomes of a critical revision of standard additions plots, on an amino acid per amino acid basis (as exemplified for Proline), are reported in the <Reviewed> column of Table 2. Only concentrations derived from standard additions plot for which the standard error on the intercept on the x-axis does not substantially exceed the set ± 6% threshold have been accepted. From Table 2 one can see that a number of amino acids concentrations have been rejected.
Justifications for rejections are the most instructive part of the basic experiment and are presented below.
Lysine, Tyrosine and Tryptophan standard additions plots
Trimethylsilylation usually involves substitution of H atoms on oxygen, nitrogen, sulphur, etc., with trimethylsilyl, -Si(CH3)3, groups. However, under certain conditions, unexpected derivatives are formed. These unexpected derivatives are mentioned as artifacts.
Derivatization of pure Lysine solutions with BSTFA/1%TMCS produces bis(trimethylsilyl)-Lysine methyl ester (Lys2TMS methyl ester) artifact of Lysine:

Under the conditions of the basic experiment, Lysine methyl ester artifact is the only derivative of Lysine which is detected and, by consequence; it is used as the surrogate for Lysine quantification.
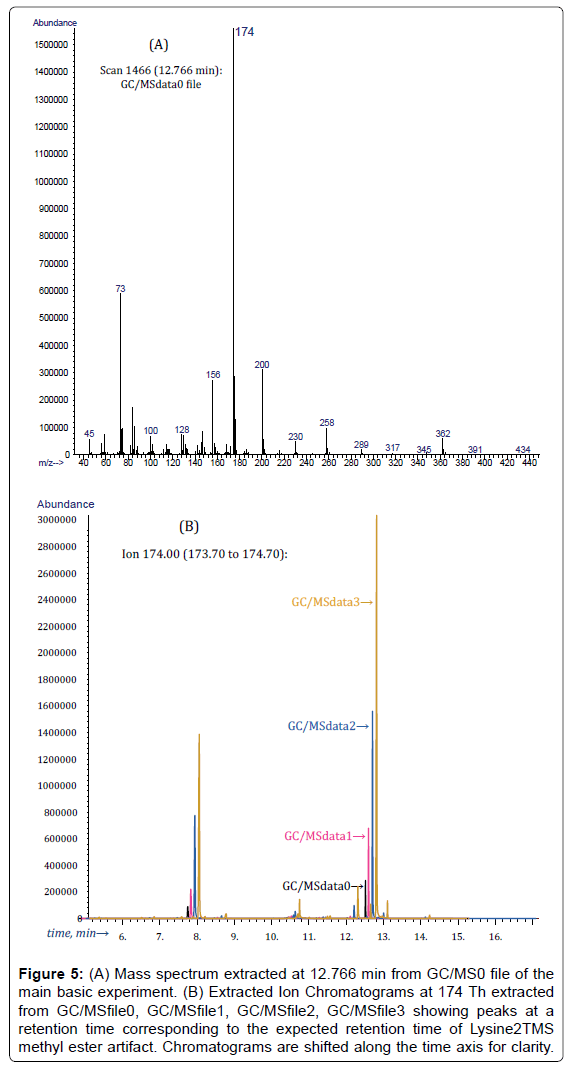
Lys2TMS methyl ester is easily recognized from GC/MSdata0 file from the peak at 12.766 min in the EIC at 174 Th (which are, respectively, the retention time and the target ion of Lys2TMS methyl ester) and the corresponding mass spectrum (Figure 5).
Figure 5: (A) Mass spectrum extracted at 12.766 min from GC/MS0 file of the main basic experiment. (B) Extracted Ion Chromatograms at 174 Th extracted from GC/MSfile0, GC/MSfile1, GC/MSfile2, GC/MSfile3 showing peaks at a retention time corresponding to the expected retention time of Lysine2TMS methyl ester artifact. Chromatograms are shifted along the time axis for clarity.
As expected, EIC peaks at 174 Th and 12.766 min grow in an apparently regular way after additions of the standard solution.
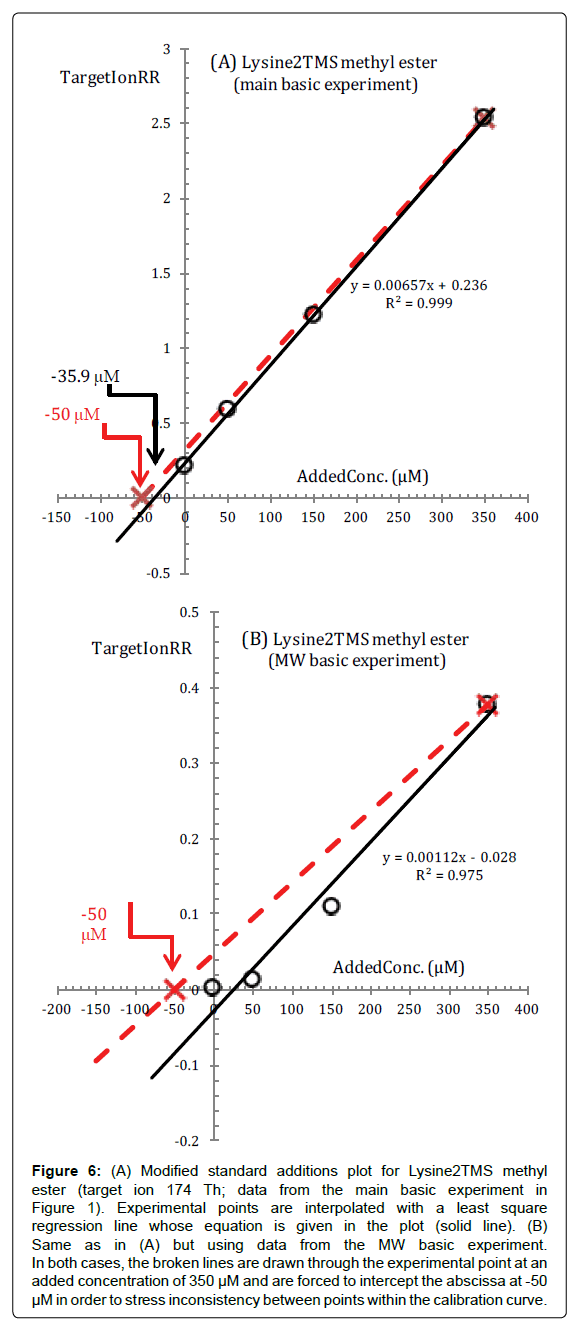
One can see from the standard additions plot in Figure 6A, that experimental (TargetIonRR, AddedConc) points fall, at first sight, on a straight line and this is taken as an indication that our assumptions are correct.
Figure 6: (A) Modified standard additions plot for Lysine2TMS methyl ester (target ion 174 Th; data from the main basic experiment in Figure 1). Experimental points are interpolated with a least square regression line whose equation is given in the plot (solid line). (B) Same as in (A) but using data from the MW basic experiment. In both cases, the broken lines are drawn through the experimental point at an added concentration of 350 μM and are forced to intercept the abscissa at -50 μM in order to stress inconsistency between points within the calibration curve.
However, the regression line in Figure 6A extrapolates to -35.9 μM and the uncertainty of the calculated reaction medium sample concentration of Lysine is evaluated to be about ± 13%. From our point of view these values, which deviate substantially from the expected values, are symptoms that under the conditions of the basic experiment, not all fundamental assumptions on which interpretation of the experiment is based are maintained for Lysine.
The problem with Lysine becomes apparent if, in Figure 6A, we draw a line through the experimental point at an added concentration of 350 μM of Lysine (corresponding to the largest standard addition) and force this line through the abscissa at - 50 μM which, in the basic experiment, is the a priori known intercept of all regression lines (broken line in Figure 6A).
After this, we see from Figure 6A that all the experimental points calculated from GC/MSdata0 (the sample), GC/MS/data1 (first standard addition), GC/MSdata2 (second standard addition) fall under the broken line and the distance of experimental points from the broken line increases by decreasing Lysine concentration.
Hardly one can escape the suggestion that, under the conditions of the basic experiment, the fraction of Lysine which has been converted to its surrogate is not exactly the same in all four vials but, apparently, increases (although very little) as its concentration in the reaction medium is increased.
In other words, under the conditions of the present experiment, points at low concentrations lag behind points at high concentrations and trudge toward the expected position in the plot.
The fundamental effect of this phenomenon is that regression lines through experimental points have higher slopes and less negative intercepts on the concentration axis.
When using the conventional internal standard method for calibration, the described effect may produce internal standard calibration lines with a negative intercept on the response axis. For instance, in ref. [15], under silylation conditions similar to those of the main basic experiment, an internal standard calibration line with a negative intercept on the y-axis is obtained for Lysine.
In order to support this explanation we present in Figure 6B the standard additions plot of Lys2TMS methyl ester calculated from data acquired during the MW basic experiment.
Because the heat treatment in a microwave oven is much shorter (5 min in the present case) and no TMCS is used, the differences between the slower response at the lowest concentrations and the faster response at the highest concentrations of Lys2TMS methyl ester artifact should be enhanced. From Figure 6B, we see that, in effect, the fraction of Lysine which is converted to its surrogate is actually very low at the lowest concentrations and suddenly increases at the highest concentrations. Furthermore, note as the response of Lysine2TMS methyl ester artifact is much lower in the MW experiment compared to the basic experiment. Although in Figure 6B a regression line is drawn through the experimental points, it is clear that it cannot be accepted since the response practically does not increase at all after the first standard addition and even because, after all, it has a positive intercept on the concentration axis.
In general, the described effect can be overcome either by allowing a longer heat processing in order for points at the lower concentrations to catch up with points at the highest concentrations and/or by using as silylation reagent BSTFA enriched with several percents of TMCS, although these conditions may be not favourable for other amino acids.
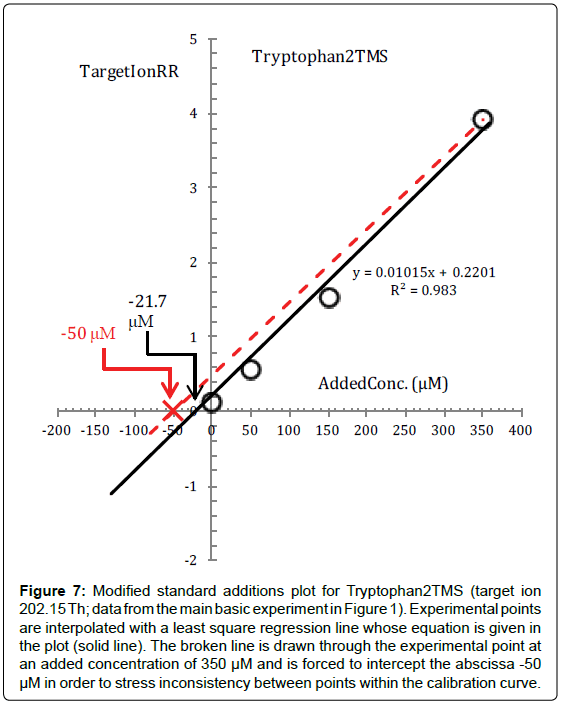
As can be deduced from the low concentrations of Tyrosine and, especially, Tryptophan reported in Table 2, standard additions plots of Tyr2TMS and Trp2TMS also may be affected by this very insidious inconsistency of points at low concentrations which do not catch up with points at high concentrations, so much so that a dependence of the response from the square of concentration may be simulated (as can be deduced from the standard additions plot of Trp2TMS in Figure 7).
Figure 7: Modified standard additions plot for Tryptophan2TMS (target ion 202.15 Th; data from the main basic experiment in Figure 1). Experimental points are interpolated with a least square regression line whose equation is given in the plot (solid line). The broken line is drawn through the experimental point at an added concentration of 350 μM and is forced to intercept the abscissa -50 μM in order to stress inconsistency between points within the calibration curve.
Finally, from the present experiment we learn the lesson that we have to be very vigilant toward the inset of this very insidious inconsistency between points at low concentrations which apparently require more time to reach the same degree of conversion of points at higher concentrations.
Apart from that, from Table 2 one can see that the concentrations of Lysine, Tyrosine and Tryptophan, calculated from standard additions plots, have been rejected, simply because they have uncertainties which do not comply with the set threshold.
Cysteine standard additions plots
From Table 2 we see that for Cysteine a much larger concentration (255 μM) than expected and the lowest determination coefficient (0.949) is obtained performing a brute linear interpolation of experimental (TargetIonRR, AddedConc) points.
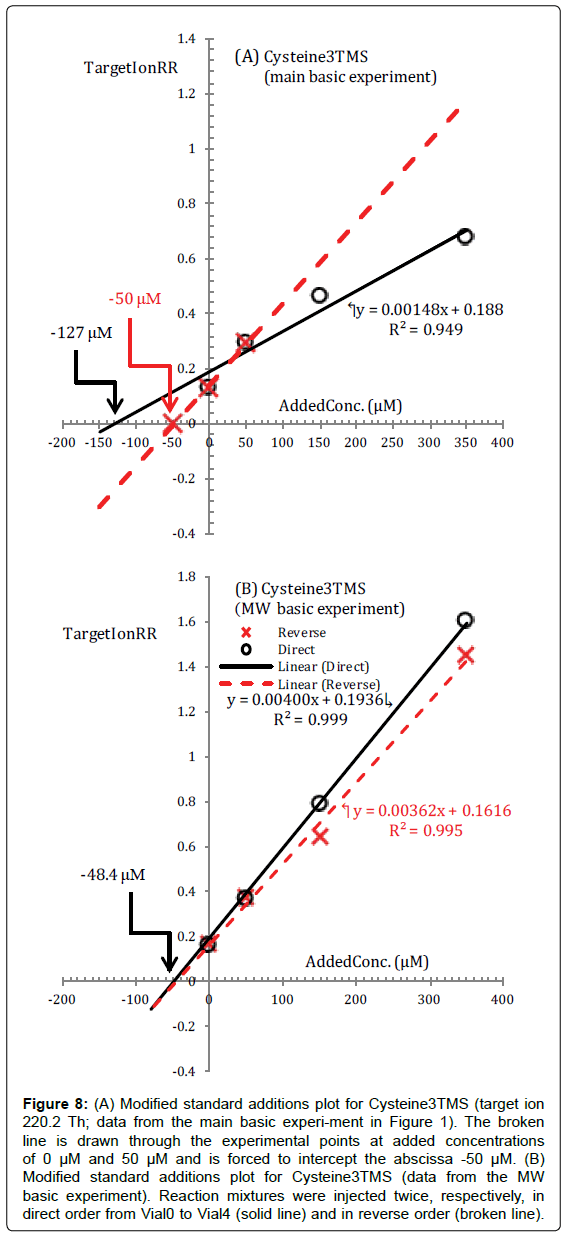
The standard additions plot for Cysteine, calculated from data acquired in the main basic experiment, is presented in Figure 8A.
Figure 8: (A) Modified standard additions plot for Cysteine3TMS (target ion 220.2 Th; data from the main basic experi-ment in Figure 1). The broken line is drawn through the experimental points at added concentrations of 0 μM and 50 μM and is forced to intercept the abscissa -50 μM. (B) Modified standard additions plot for Cysteine3TMS (data from the MW basic experiment). Reaction mixtures were injected twice, respectively, in direct order from Vial0 to Vial4 (solid line) and in reverse order (broken line).
In this case, one can see at the blink of an eye that the experimental (TargetIonRR, AddedConc) data points are not well fitted with a straight line and this is, in the modified standard additions strategy, in and by itself, a sufficient reason for rejecting the results. In fact this is a clear indication that the procedure employed is not suitable for the consistent silylation of Cysteine to its Cysteine3TMS surrogate.
Obviously, one would like to know what it is the problem with Cysteine in order to modify the procedure consciously.
For this, we make use, once again, of the fact that we know a priori, in the basic experiment, that the proper regression line must necessarily intercept the abscissa at -50 μM. Then, virtually, we take a line through the point (TargetIonRR=0, AddedConc=-50 μM) and rotate this line in an attempt to find a slope which gives an acceptable fit of the experimental points.
In applying this hypothetical procedure we certainly would get impressed by the broken line in Figure 8A. This broken line gives a perfect fit for the two experimental points corresponding to added concentrations of 0 μM (sample) and 50 μM (first standard addition). Points corresponding to the second and third standard additions fall under this broken line.
Hardly one can escape the suggestion that the amount of Cys3TMS in Vial2 and Vial3 is much lower and inconsistent with Cys3TMS content of other vials.
In other words, either the yield of the Cysteine silylation reactions decreases with concentration or Cys3TMS, whose response is measured, disappears from the injected solution at a faster rate as the concentration is increased.
The first hypothesis is not very likely, since, as we have shown above, and as it is reasonable, the rate of silylation reactions tends to be enhanced by increasing the concentration of the amino acid in the reaction medium.
Then we are left with the idea that Cys3TMS is created consistently in all vials but could be unstable in the very complex chemical environment of the silylation mixture with respect to side reactions that produce more stable not detected products.
In Figure 8B it is shown the standard additions plot for Cys3TMS obtained from the MW basic experiment. The MW basic experiment has a time scale much shorter than the main basic experiment so that the effect of any side reaction should be minimized. Furthermore, in this experiment each solution in Vial0, Vial1, Vial2 and Vial3 was injected twice.
In the direct experiment we acquired four data files injecting the reaction mixture in the usual order from Vial0 to Vial3. Then, after about one hour, we reinjected the reaction mixtures in the reverse order (from Vial3 to Vial0).
From Figure 8B we see that the (TargetIonRR, AddedConc) experimental points acquired in the direct runs are well fitted with a straight line (solid line in Figure 8B) which now intercepts the abscissa at -48.4 μM which is within the set precision threshold from the expected value.
(TargetIonRR, AddedConc) points acquired in the reverse runs, tend generally to fall under the corresponding points of the direct runs but the distance decreases by decreasing concentration and the TargetIonRR of the sample is practically the same in the two runs. As can be seen also the (TargetIonRR, AddedConc) experimental points acquired in the reverse run are fitted by a straight line which intercepts the abscissa at a concentration very close to that expected, but the reaction medium sample concentration calculated from the reverse run cannot be accepted because of a higher than expected uncertainty.
Evidently, Figure 8, considered in its entirety, supports the idea that Cys3TMS may be unstable under many silylation conditions in which a prolonged heat processing is employed (particularly at the highest concentrations) especially if, in addition, the fact that an increased response was recorded, in the reverse runs, for most of the amino acids is attached.
Glycine standard additions plots
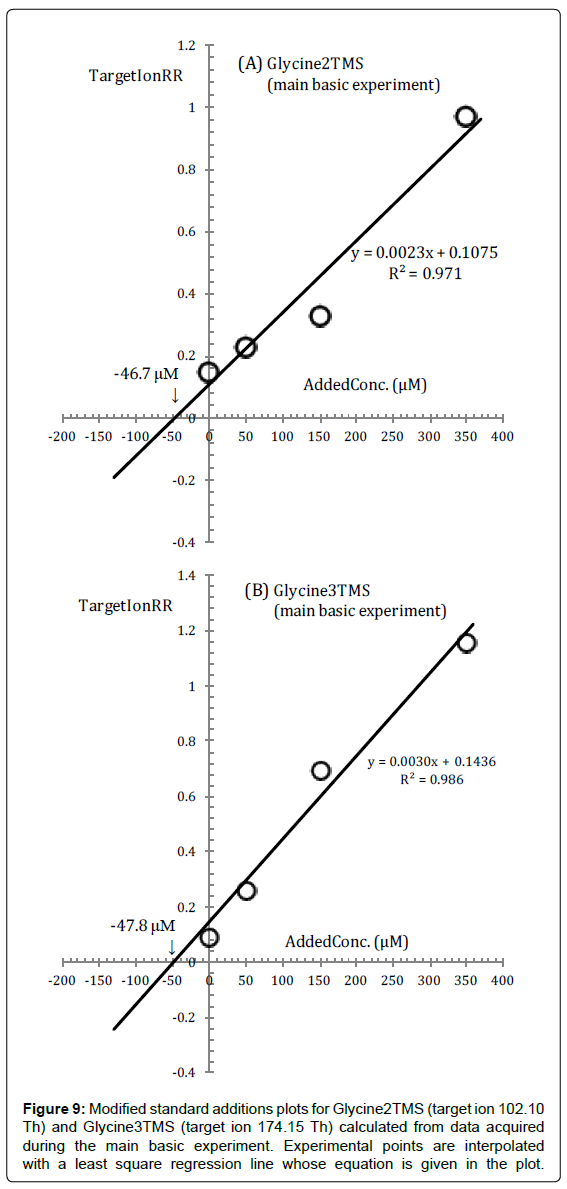
Glycine, under the conditions of the basic experiment and, in general, under most silylation conditions, is detected as a mixture of Glycine2TMS and Glycine3TMS derivatives so that two standard additions plots can be drawn. If the fundamental constraints of analysis via a surrogate (namely that a constant fraction of Glycine is converted to Gly2TMS and a constant fraction is converted to Gly3TMS) is maintained for all silylated solutions, then we should obtain the reaction medium sample concentration of Glycine both from the standard additions plot for Gly2TMS and for Gly3TMS.
The two standard additions plots for Gly2TMS and Gly3TMS surrogates of Glycine (constructed from data from the main basic experiment in Figure 1) are shown in Figure 9, in which are also drawn regression lines, through the experimental (TargetIonRR, AddedConc) points, calculated by a straight interpolation procedure.
Intercepts on the x-axis are - 46.7 μM and - 47.8 μM respectively from Figure 9A and 9B and they agree within 2%.
However, the reaction medium sample concentrations calculated from these plots have a much lower precision than expected (± ~ 30%), because of the excessive spread of points around the regression line.
In fact, even a superficial inspection of Figure 9 will show that we have not been completely successful in maintaining throughout the whole sequence of measurements a constant conversion factor from Glycine to its surrogates and the fact that the intercepts of the regression lines in Figure 9A and 9B are very close to each other is a mere coincidence.
For instance, it is clear from Figure 9 that in the reaction mixture in Vial2 (corresponding to an added concentration of 150 μM) a larger fraction of Glycine was converted to Gly3TMS and a lower fraction to Gly2TMS compared to other vials.
This is not unexpected since the problem with Glycine is just that the Gly2TMS derivative is slowly converted, both at high and room temperature, to Gly3TMS.
We can regard the formation of Gly3TMS as a side reaction of Gly2TMS so that, as in the case of Cysteine, difficulties should be overcome by a short heat treatment which is suitable to minimize the effect of side reactions.
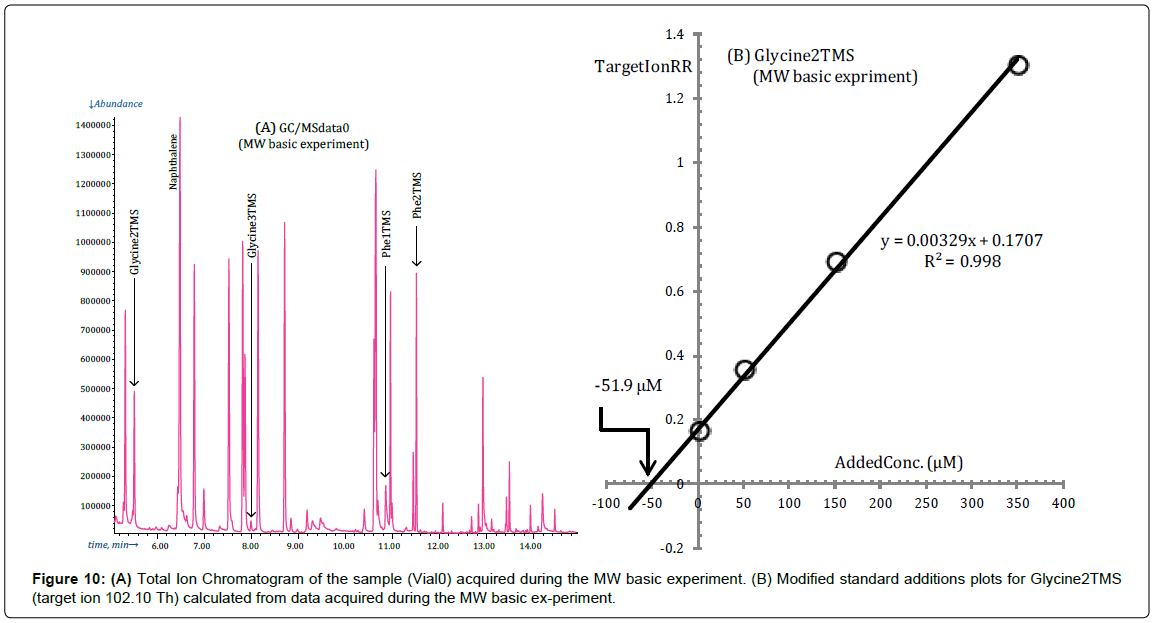
In fact, as expected, Glycine is detected almost exclusively as Gly2TMS derivative in the MW basic experiment, as it is shown in Figure 10A which is the TIC of the reaction mixture in Vial0 acquired during the microwave experiment.
Under the silylation conditions of the microwave experiment Glycine can be treated essentially as other amino acids for which a single derivative is detected as can be deduced from the standard additions plot in Figure 10B.
Obviously, when only a small fraction of Glycine is converted to its Gly3TMS surrogate, as in the case considered in Figure 10, the standard additions plot for Gly3TMS cannot be used since the low concentration of Gly3TMS in the reaction mixture is easily modified by the conversion Gly2TMS→Gly3TMS and it is, by consequence, erratic.
Phenylalanine standard additions plots
Silylation of Phenylalanine with BSTFA and BSTFA/TMCS gives results superficially similar to those of Glycine because two silylated derivatives, Phe1TMS and Phe2TMS are discovered under most silylation conditions.
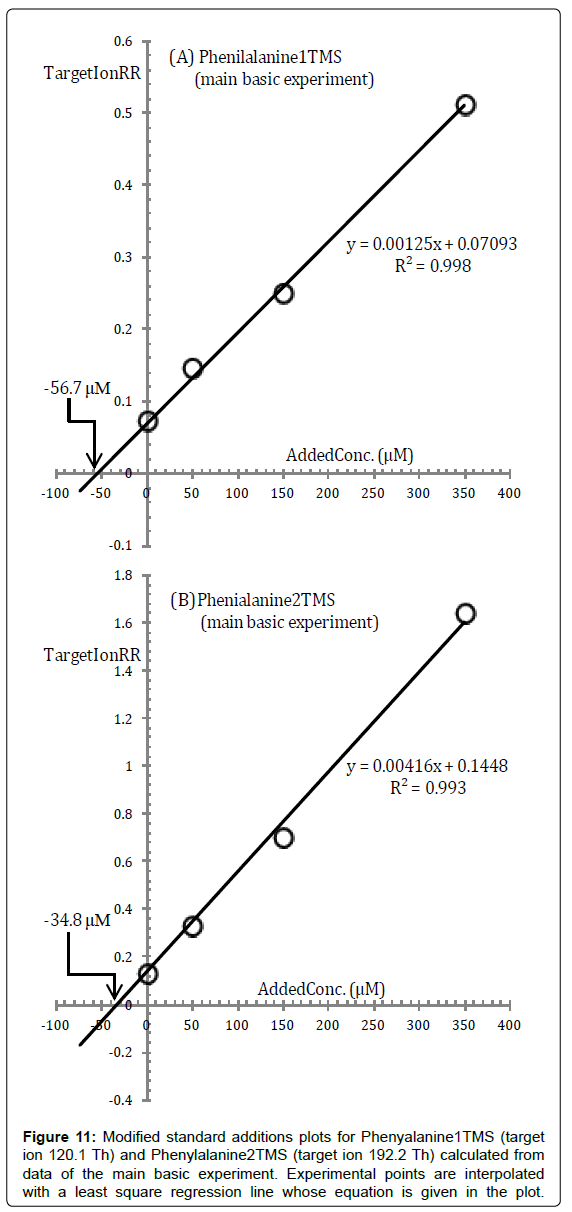
As in the case of Glycine, we can use either the standard additions plot of Phe1TMS or the standard additions plot of Phe2TMS, or both, for quantification and these are presented in Figure 11.
As can be seen from Figure 11, there is a substantial difference between the intercepts of the two regression lines in the standard additions plot of Phe1TMS and Phe2TMS.
In addition, the calculated reaction medium sample concentrations have a much higher uncertainty, about ± 25%, than the set threshold.
Obviously, this is a warning that some inconsistency exists between the experimental points although it is not easily discovered.
On this basis both the Phenylalanine concentrations calculated from standard additions plots in Figure 11 have been rejected (Table 2).
Unfortunately the above inconsistency is not resolved and the pattern in Figure 11 is replicated both using data from the MW and from the 4% basic experiment which, in addition, are not even helpful for clarifying the chemical reasons for this inconsistency affecting Phenylalanine silylation.
Glutamine and Glutamic acid standard additions plots
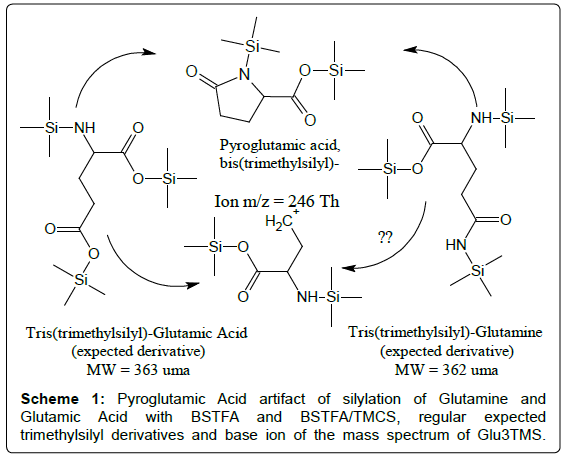
Glutamine and Glutamic Acid produce, as a common artifact, bis(trimethylsilyl)-Pyroglutamic Acid (i.e., PyrGlu2TMS) which is discovered in the TIC as a well-developed peak after silylation with BSTFA and BSTFA/TMCS mixtures (Scheme 1).
In addition, under many silylation conditions, the regular derivative of Glutamic Acid (i.e., Glu3TMS, whose mass spectrum exposes a weak mass peak of the parent ion at an odd mass and it is dominated by an even mass fragment at 246 Th), can also be detected. The expected regular derivative of Glutamine (i.e., Gln3TMS, whose mass spectrum should expose a molecular ion of even mass) has not so far been reported. It is possible that Glutamine is converted to Glutamic Acid during the silylation procedure, because silylation with BSTFA and BSTFA/TMCS of solutions of pure Glutamine gives a weak peak which can be identified as Glu3TMS [16].
Because two separated derivatives of Glutamine and Glutamic Acid are never detected, it will be, in general, impossible from the TIC of an unknown sample, to distinguish cases in which both Glu and Gln are present from cases in which only one of them is present. Furthermore, it is not surprising, after all, that quantification of Glutamic Acid through its regular derivative Glu3TMS does not give reliable results (Table 2).
Then, the only practicable analytical strategy is to aim at the determination of the sum of Glu and Gln concentrations through the response of their common PyrGlu2TMS surrogate (which is always well developed) by using for standard additions a solution which contains both Glutamic Acid and Glutamine.
Obviously, to this end, the best would be to employ a silylation procedure that allows complete conversion of Glu and Gln to PyrGlu2TMS.
This can be obtained by employing as silylation reagent BSTFA enriched with several percents (e.g., 4%) of TMCS and maintaining the reaction mixture for a time longer than usual (e.g., 2-3 hours) at a temperature of 90-100°C.
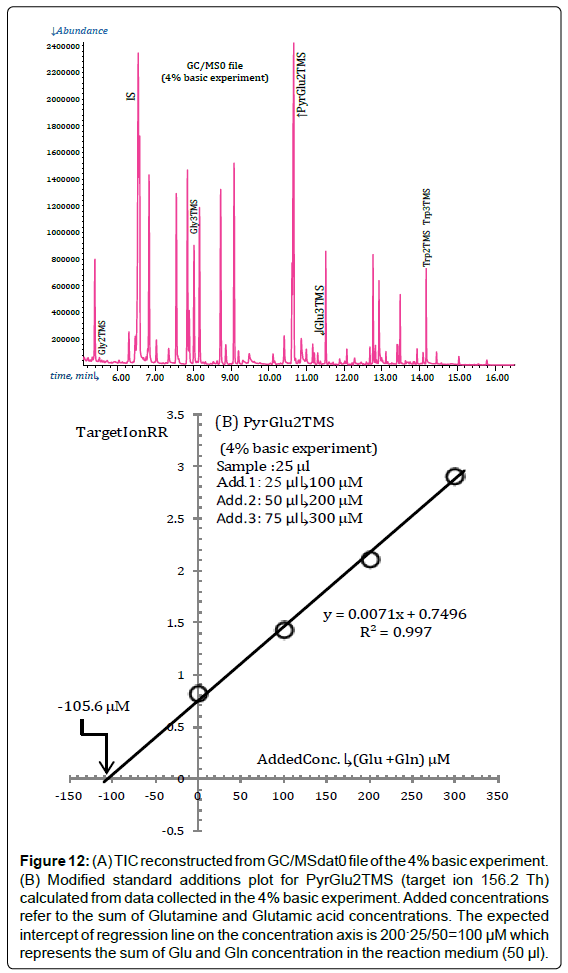
This is demonstrated in Figure 12A which presents the TIC reconstructed from the GC/MSdata0 file acquired during the 4% basic experiment (in which no Glu3TMS is detected).
Figure 12: (A) TIC reconstructed from GC/MSdat0 file of the 4% basic experiment. (B) Modified standard additions plot for PyrGlu2TMS (target ion 156.2 Th) calculated from data collected in the 4% basic experiment. Added concentrations refer to the sum of Glutamine and Glutamic acid concentrations. The expected intercept of regression line on the concentration axis is 200?25/50=100 μM which represents the sum of Glu and Gln concentration in the reaction medium (50 μl).
The standard additions plot for PyrGlu2TMS, constructed from data collected during the 4% basic experiment, is presented in Figure 12B.
Please note that the largest standard addition in the 4% basic experiment has been reduced to 75 μl which corresponds to an added concentration of Glu plus Gln of 300 μM in 50 μl of reaction medium.
The intercept of regression line in Figure 12B matches, within the set precision threshold, with the a priori known value (100 μM).
Precision of results derived from MSAM procedure
Although experiments or analysis performed within the frame of MSAM procedure can be replicated in order to verify precision and reproducibility, this is not a mandatory prescription of the MSAM procedure (or even, of the conventional standard additions calibration method) since results are not derived from a single point measurement but by correlating at least four measured points.
This signifies that we can state the precision of measurements and results from the standard additions plot, without replicating experiments and analysis.
For instance, one can calculate prevision bands, at a preset confidence level, around the standard additions regression line in order to anticipate what would be the outcome of a replicate experiment.
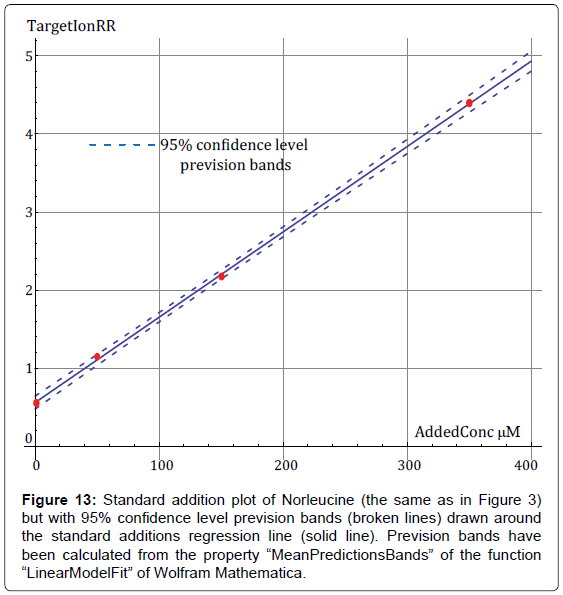
By way of example, in Figure 13 it is presented the standard additions plot of Norleucine of Figure 3 with calculated 95% confidence prevision bands.
Figure 13: Standard addition plot of Norleucine (the same as in Figure 3) but with 95% confidence level prevision bands (broken lines) drawn around the standard additions regression line (solid line). Prevision bands have been calculated from the property “MeanPredictionsBands” of the function “LinearModelFit” of Wolfram Mathematica.
It is obvious from Figure 13 that Norleucine will give very reproducible results. In fact, it is in the significance of the prevision bands that replicate measurements of experimental points will fall with 95% probability within the prevision bands.
However, as the spread of points around the standard additions line increases, prevision bands diverge and differences between replicate experiments are expected to increase correspondingly.
Summary of results
The controlled and consistent preparation of biological amino acids silylated derivatives is made difficult by the presence of different functional groups in different amino acids. Conditions that are suitable for the silylation of a given group of amino acids may very well result in low and/or erratic yields of silylation reactions for some others.
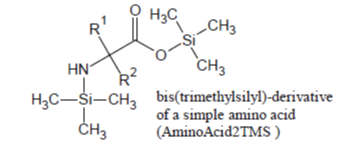
Of the amino acids that form proteins, those containing only the -COOH and alfa -NH2 groups (e.g., Ala, Val, Leu, Ile, Phe, Pro, etc.) are readily silylated and promptly appear in the Total Ion Chromatogram, under most silylation conditions, as sharp well developed peaks due to their 2TMS derivatives in which -Si(CH3)3 groups are substituted for the hydrogen on carboxylic group and one of the two -NH2 hydrogens:
Glycine which, under most silylation conditions, is detected as a mixture of Gly2TMS and Gly3TMS surrogates and Phenylalanine which is detected as a mixture of Phe1TMS and Phe2TMS derivatives are emblematic exceptions to this rule:
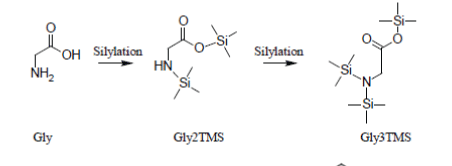

Simple amino acids (with the exception of Phenylalanine and Glycine) can be consistently silylated and quantified through their 2TMS surrogates.
As we have demonstrated in this paper, Glycine can be treated as other simple amino acids provided that a short heat processing of the reaction mixture with a microwave oven (which is suitable to avoid the formation of Gly3TMS surrogate) is performed.
On the contrary, possible inconsistencies in the quantification of Phenylalanine have been demonstrated but not solved and the formation of a mixture of Phe1TMS and Phe2TMS surrogates could not be avoided modifying silylation conditions.
The scenario complicates for amino acids that have functional groups in the side chain and which, in abstract, can give rise to a variety of silylated derivatives, starting with the 1TMS derivative up to 5TMS derivative.
Fortunately, many amino acids with functionalized side chains seem to strongly prefer the 3TMS derivative in which (beside the silylation of the -COOH and alfa -NH2 groups which takes place for all amino acids) an -Si(CH3)3 group is substitute for one of the hydrogen atoms of the functional group in the side chain.
AminoAcid3TMS derivatives of functionalized amino acids have, in general, very suitable gas chromatographic properties.
For instance, Serine and Threonine have an additional hydroxyl group in the side chain which is readily silylated so that they promptly appear as Ser3TMS and Thr3TMS derivatives in the TIC as sharp well developed peaks:

Apart from that, they behave in a manner very similar to simple amino acids.
From this we can infer that amino acids with functional groups in the side chain need to be converted to the 3TMS derivatives in order to develop the most suitable chromatographic properties.
But, obviously, there are exceptions to this general rule and this is the case of amino acids that have aromatic rings in their structure. So (in parallel to the fact noticed above that Phenylalanine1TMS is the only incompletely silylated amino acid which can be detected), Tyrosine2TMS and Tryptophan2TMS have very suitable chromatographic properties and give rise, when present in the injected reaction mixture, to sharp well-formed peaks in the TIC:
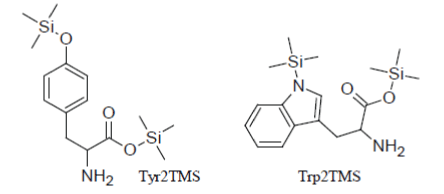
However, the yield of the conversion reactions of Tyr and Trp to their 2TMS derivatives is very sensitive to the composition of the silylation mixture, to the temperature and length of the heat treatment and it appears problematic to be controlled. Inter alia, it has been demonstrated that silylation reactions of Tyrosine and Tryptophan to their Tyr2TMS and Trp2TMS surrogates progress faster as the concentration of the amino acid in the reaction medium increases and this very insidious phenomenon may create inconsistencies between points within the calibration curve or between the sample measured response and the calibration function.
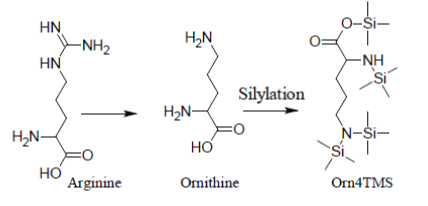
Under most silylation conditions, Arginine gives only a very weak and erratic GC/MS response through its artifact Ornithine4TMS [12]:
Analogously, under most silylation conditions, Pyroglutamic Acid (PyrGlu) artifact is formed by a cyclization reaction involving the alfa amino group and, respectively, the -CONH2 and -COOH side groups of Glutamine and Glutamic Acid:
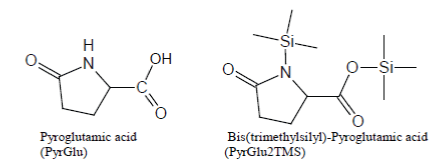
Pyroglutamic acid is efficiently silylated with BSTFA and BSTFA/ TMCS mixtures, so much so that PyrGlu2TMS will be formed in high yields, compared to the regular silylation products, from Glutamine and Glutamic Acid.
A cyclic amide silylation artifact, formed from a non-amino acid diamide, has previously been reported and its structure confirmed by proton NMR analysis [6].
The fact that Pyroglutamic Acid is formed both from Glutamine and Glutamic acid hinders its use for quantification of either amino acid.
It has been demonstrated that a viable strategy is to direct the analytical procedure to the quantification of the sum of Glutamine and Glutamic Acid concentrations performing silylation under conditions in which the regular silylated derivative of Glutamic Acid (Glu3TMS) is not formed.
An artifact is also produced during silylation of Lysine. With pure BSTFA as the silylation agent, Lysine generally produces very low chromatographic responses through its Lysine3TMS and Lysine4TMS derivatives. When, in the attempt to enhance the yield of Lysine silylation reactions, BSTFA is enriched with TMCS, the methyl ester of Lysine2TMS appears with a high yield:
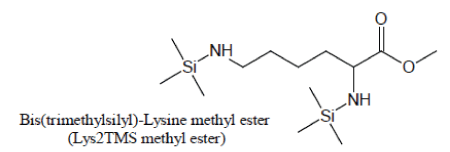
For maximum sensitivity, Lysine should then preferentially be silylated with a suitable BSTFA/TMCS mixture and the methyl ester of Lysine2TMS used as a surrogate for Lysine.
Unfortunately, the presence of TMCS in the reaction medium accelerates the decomposition of Cysteine whose silylated derivative, Cys3TMS, appears to be unstable both at low and high temperatures, so that it becomes very problematic to control the conversion Cys→Cys3TMS:

It has been demonstrated that quantification of Cysteine can be made reducing the time scale of the MSAM experiment in order to avoid decomposition of the Cys3TMS surrogate. By consequence, for Cysteine, heat processing with a microwave oven is recommended.
Conclusion
A single rigid protocol of analysis (based on a selected silylation reagent, solvent and prescribed heat processing) hardly will allow detection and quantification of all twenty biological amino acids in all possible samples via GC/MS analysis.
However, a sample oriented approach, as the MSAM procedure presented in this paper, which, because incorporates in a single procedure calibration and analysis, allows changing silylation conditions case by case to target specific amino acids or groups of amino acids, could do the job.
MSAM, which implements both the standard additions and internal standard calibration methods principles, is eminently suitable for compensating for matrix effects on the yield of silylation reactions which may create inconsistencies between the sample response and the calibration function.
MSAM procedure also incorporates a pilot compound which serves to check that the MSAM procedure has been properly performed and bugs (as, for instance, leakage of the reaction mixture from the reaction vials) have not occurred.
Acknowledgement
The authors are grateful to Dr. Donato Ciccarelli (Dipartimento di Scienze Chimiche, Università di Napoli “Federico II”) for help and technical support.
References
- Drozd J (1981) Chemical Derivatization in Gas Chromatography. Elsevier Science Publishers B.V, Amsterdam, The Netherlands.
- Dettmer-Wilde K, Werner I (2014) Practical Gas Chromatography. Springer-Verlag, Berlin Heidel-berg.
- Soderholm SL,Damm M, Kappe CO (2010) Microwave-assisted derivatization procedures for gas chromatography/mass spectrometry analysis. Mol Divers 14: 869-888.
- Schummer C,Delhomme O, Appenzeller BM, Wennig R, Millet M (2009) Comparison of MTBSTFA and BSTFA in derivatization reactions of polar compounds prior to GC/MS analysis. Talanta 77: 1473-1482.
- Deng C, Yin X, Zhang L, Zhang X (2005) Development of microwave-assisted derivatization followed by gas chromatography/mass spectrometry for fast determination of amino acids in neonatal blood samples. Rapid Commun Mass Spectrom 19: 2227-2234.
- Little JL (1999) Artifacts in trimethylsilyl derivatization reactions and ways to avoid them. J Chromatogr A 844: 1-22.
- Villas-Boas SG, Smart KF2, Sivakumaran S3, Lane GA3 (2011) Alkylation or Silylation for Analysis of Amino and Non-Amino Organic Acids by GC-MS? Metabolites 1: 3-20.
- Alonso JIG, Rodriguez-Gonzalez P (2013) Isotope Dilution Mass Spectrometry. RSC Publishing, Cambridge, UK.
- Kaspar H,Dettmer K, Gronwald W, Oefner PJ (2008) Automated GC-MS analysis of free amino acids in biological fluids. J Chromatogr B AnalytTechnol Biomed Life Sci 870: 222-232.
- Sparkman OD, Penton ZE, Kitson FG (2011) Gas Chromatography and Mass Spectrometry. (2ndedn), Academic Press, Oxford, UK.
- Giarrocco V, Quimby B, Klee M (1997) Retention Time Locking: Concepts and Applications. Agilent Application Note5966-2469E.
- Stein SE (1999) An integrated method for spec-trum extraction and compound identification from gas chromatography/mass spectrometry data. Journal of the American Society for Mass Spectrometry 10: 770-781.
- Halket JM, Waterman D, Przyborowska AM, Patel RK, Fraser PD, et al. (2005) Chemical derivatization and mass spectral libraries in metabolic profiling by GC/MS and LC/MS/MS. J Exp Bot 56: 219-243.
- Ferreira AA, Ferraz V, Oliveira PM, Godinho A, Silveira D, et al. (2008) Microwave-assisted derivatization and GC-MS analysis of amino acids from Ipomea Cairica aqueous extract. Chem. Nat. Comp. 44: 679-681.
- Rashaid AHB, Jackson GP, Harrington PdeB (2014) Quantitation of Amino Acids in Human Hair by Trimethylsilyl Derivatization Gas Chro-matography/Mass Spectrometry. Enliven Archive 1: 1-12.
- Zaikin V, Halket JM (2009) A Handbook of De-rivatives for Mass Spectrometry. IM Publications LLP, Chichester, UK.
Relevant Topics
Recommended Journals
Article Tools
Article Usage
- Total views: 19206
- [From(publication date):
October-2015 - Dec 03, 2024] - Breakdown by view type
- HTML page views : 14422
- PDF downloads : 4784

