Research Article Open Access
A Standard Addition Method Utilizing an Endogenous Substance as an Internal Standard for Quantitating Arabinofuranosylguanosine 5’-Triphosphate in Human Peripheral Blood Mononuclear Cells by Lc-Ms/Ms
Yoshiyuki Minamide1*, Harue Igarashi2, Akira Wakamatsu2, Shinobu Kudoh11Pharmaceutical and Life Science Division, Shimadzu Techno-Research, Inc., Kyoto, Japan
2Clinical Pharmacology Department, GlaxoSmithKline K.K., Tokyo, Japan
- *Corresponding Author:
- Yoshiyuki Minamide, Ph.D.
2-13 Nishinokyo-Sanjyo Boucho, Nakagyo-ku
Kyoto 604-8435, Japan
Tel: +81-75-811-3181
Fax: +81-75-821-7837
E-mail: y_minamide00@shimadzu-techno.co.jp
Received date: October 28, 2011; Accepted date: December 06, 2011; Published date: December 08, 2011
Citation: Minamide Y, Igarashi H, Wakamatsu A, Kudoh S (2011) A Standard Addition Method Utilizing an Endogenous Substance as an Internal Standard for Quantitating Arabinofuranosylguanosine 5’-Triphosphate in Human Peripheral Blood Mononuclear Cells by Lc-Ms/Ms. J Anal Bioanal Techniques S5:002. doi: 10.4172/2155-9872.S5-002
Copyright: © 2011 Minamide Y, et al. This is an open-access article distributed under the terms of the Creative Commons Attribution License, which permits unrestricted use, distribution, and reproduction in any medium, provided the original author and source are credited.
Visit for more related articles at Journal of Analytical & Bioanalytical Techniques
Abstract
A highly sensitive liquid chromatography tandem mass spectrometry (LC-MS/MS) method was developed for quantitation of arabinofuranosylguanosine 5’-triphosphate (ara-GTP) in human peripheral blood mononuclear cells (PBMC). The determination of ara-GTP in PBMC was validated using a standard addition method with the human Tlymphoblastoid cell line as an alternative blank matrix. Ara-GTP was extracted with methanol/250 mmol/L ammonium carbonate solution (7/3, v/v) from the cells at a density of 106 cells per 0.5 mL. Extracts were subjected to LC-MS/ MS using a TurboIon spray interface and selected reaction monitoring with the transitions of m/z 524 to m/z 152 for quantitation. Endogenous guanosine triphosphate in the extract was used as an internal standard. Separation of the analytes was achieved on a porous graphitic carbon column (100 mm length × 2.1 mm i.d., 5 μm particle size) by isocratic elution with 250 mmol/L ammonium carbonate buffer (pH 9.5)/water/acetonitrile (40/51.5/8.5, v/v/v) at a flow rate of 0.2 mL/min. The method was validated in the range of 2–250 pg/mL. The pharmacokinetic profile of ara-GTP in PBMC in a Phase I clinical study of nelarabine in relapsed or refractory T-ALL/T-LBL patients was successfully determined using this method.
Keywords
LC-MS/MS; Nucleotides; Peripheral blood mononuclear cells; Porous graphitic carbon; Standard addition method
Abbreviations
Ara-G: Arabinofuranosil guanidine; Ara-GTP: Arabinofuranosylguanosine 5’-triphosphate; GTP: Guanosine triphosphate; LC-MS/MS: Liquid chromatography coupled with tandem mass spectrometry; PGC: Porous graphitic carbon
Introduction
Nelarabine is an anticancer prodrug of 9-ß-Darabinofuranosylguanine, which is chemically modified arabinofuranosylguanine (ara-G) that is water-soluble. After intravenous administration, nelarabine is rapidly metabolized to ara-G via O-demethylation by adenosine deaminase, which is present in erythrocytes, intestinal mucosa, the spleen, and the thymus [1,2]. Ara-G is further metabolized in cells to arabinofuranosylguanosine 5’-triphosphate (ara-GTP). Ara-GTP is incorporated into DNA and inhibits DNA synthesis, which means it exhibits a cytotoxic effect in T-cell malignancies [1,3]. Gandhi et al. reported that the cellular concentration of ara-GTP was higher in responders than in nonresponders [4-6]. Therefore, it is important to measure the cellular ara- GTP concentration to predict the efficacy of nelarabine. In Gandhi’s method, because the cellular ara-GTP levels are very low, a large number of human peripheral blood mononuclear cells (PBMC) were required for the ara-GTP determination. Therefore, current methods for determination of cellular ara-GTP are usually limited in terms of determination sensitivity. Liquid chromatography-tandem mass spectrometry (LC-MS/MS) is a suitable choice for development of a sensitive method for ara-GTP determination.
The determination of highly polar compounds like nucleotides is generally achieved using either ion-exchange or ion-pair chromatography coupled with UV detection [7-10]. Ion-exchange and ion-pair chromatography are not ideal for today’s LC-MS/ MS methodology mainly because of the lack of volatility and ion suppression problems.
Porous graphitic carbon (PGC) strongly adsorbs polar compounds, and it has been applied to separation of oligosaccharides, peptides and drugs [11-14]. PGC columns are composed of flat sheets of hexagonally arranged carbon atoms. The surface of the graphite is sensitive to the electronic density of the solutes [15]. This results in charge-induced dipoles at the graphite surface as analytes with positive and negative charges approach it. Therefore, PGC is suitable as a stationary phase for separation of nucleotides without an ion-pair reagent.
An internal standard is usually needed for LC-MS/MS analysis because of uncertainty in ionization and the amount of ions that enter the mass spectrometer. Although a stable isotope labeled analyte is the ideal internal standard, stable isotope labeled ara-GTP is difficult to obtain. Furthermore, a sufficient amount of PBMC is difficult to obtain from patients. Therefore, the standard addition method could be used for determination of the ara-GTP concentration in PBMC. Such a method should be suitable because the use of endogenous GTP in PBMC as an internal standard for quantitation will compensate for the peak intensity fluctuations among aliquots from the same sample.
To establish a sensitive and reproducible quantitation method for the determination of ara-GTP levels in PBMC, we developed a LC-MS/ MS method using a PGC analytical column and standard addition with endogenous guanosine triphosphate (GTP) as the internal standard. The evaluation and validation of the method are reported.
Experimental
Chemicals and materials
Standard reference ara-GTP was synthesized from ara-G by Gene ACT (Fukuoka, Japan) and supplied as a 10 mmol/L sodium salt solution (pH 7.5). Adenosine monophosphate, adenosine triphosphate, cytidine triphosphate, uridine triphosphate, guanosine monophosphate, deoxyguanosine triphosphate and GTP were obtained from Sigma Aldrich (St. Louis, MO). Methanol (HPLC grade), acetone (special grade), phosphoric acid (85 % w/v, special grade) and hydrochloric acid (36 % w/v, first grade) were obtained from Kanto Chemical (Tokyo, Japan). Ammonia solution (28 %, special grade) was purchased from Wako Pure Chemical Industries (Osaka, Japan). Water purified with a Milli-Q gradient-A10 purification system (Millipore, Bedford, MA) was used in all experiments. The T-lymphoblastoid cell line CCRF- CEM was used as a blank matrix for method validation. The cells were kindly provided by Dr. Takahiro Yamauchi, First Department of Internal Medicine, University of Fukui (Japan). The cell pellets were collected by centrifugation at 500 ×g for 5 min at 4°C after washing with phosphate-buffered saline twice. The cell pellets were stored at −80°C.
Preparation of standard solutions
Ara-GTP solution (10 mmol/L, pH 7.5) was diluted with water to give a 2 mmol/L stock solution. The stock solution of ara-GTP was diluted with methanol/250 mmol/L ammonium carbonate (pH 9.5; 7/3, v/v) to prepare standard working solutions of ara-GTP.
Sample Preparation and Pretreatment
CCRF-CEM cells (cell density 106 cells per 0.5 mL) were treated with methanol/250 mmol/L ammonium carbonate solution (7/3, v/v) or methanol/28 % ammonia water (7/3, v/v), then vortex mixed for 1 min and sonicated on ice for 30 s to prepare a cell extract as a blank sample.
Validation samples (2, 20 and 200 pmol per106 cells) to establish the bias and precision of the method were prepared by adding the standard working solutions to the blank samples.
Standard addition method
For quantitation by the standard addition method, aliquots (100 μL) of each standard working solution at two concentration levels were added to separate aliquots (100 μL) of the sample to prepare solutions with ara-GTP concentrations at 10 and 50 pmol per 106 cells. Another 100 μL aliquot was diluted with methanol/250 mmol/L ammonium carbonate (pH 9.5; 7/3, v/v) solution as a zero concentration sample.
The samples were centrifuged at 18000 ×g for 10 min at 4°C. The supernatants were transferred to clean microcentrifuge tubes, and then evaporated to dryness at 40°C under a stream of nitrogen. The residues were reconstituted with 40 μL of 250 mmol/L ammonium carbonate buffer (pH 9.5)/water/acetonitrile (40/51.5/8.5, v/v/v), sonicated in a water bath for 1 min, and then transferred to HPLC vials.
LC-MS/MS analysis
Chromatographic separation of ara-GTP and GTP as an internal standard in CCRF-CEM cells was achieved on a Hypercarb analytical column (100 mm length × 2.1 mm id, 5 μm, Thermo Hypersil-Keystone, Bellefonte, PA) maintained at 40°C. The mobile phase was 250 mmol/L ammonium carbonate buffer (pH 9.5)/water/acetonitrile (40/51.5/8.5, v/v/v). Separation was performed by isocratic elution at a flow rate of 0.2 mL/min with a HP1100 pump system (Agilent Technologies, Santa Clara, CA) equipped with a Nanospace 3033 autosampler (Shiseido, Tokyo, Japan).
Quantitation was conducted by selected reaction monitoring (SRM) on a API4000 mass spectrometer (AB SCIEX, Foster City, CA) with electrospray ionization in positive mode. The optimized electrospray ionization parameters were as follows: ion source temperature, 550°C; curtain gas, setting 20; nebulizing gas (GS1), setting 80; turbo-ion spray gas (GS2), setting 80; ionspray voltage, 5500 V; declustering potential, 80 V; collision energy, 33 V. The selected reaction monitoring transitions were m/z 524 to m/z 152 for both compounds. The dwell time was 1000 ms for each transition channel. All data were acquired and analyzed using Analyst version 1.4.1(AB SCIEX).
Data analysis
Quantitation plots of the ara-GTP/GTP peak area ratio versus the amount of ara-GTP added per 106 cells were constructed using Microsoft Excel 2002 SP3, and least squares linear regression was applied to the data. The value of the x-intercept calculated from the quantitation plots represents the concentration of ara-GTP in the samples.
Method validation
Method validation was conducted on the established quantitation method in accordance with the 2001 FDA Industry Bioanalytical Method Validation guide [16].
Results and Discussion
Separation
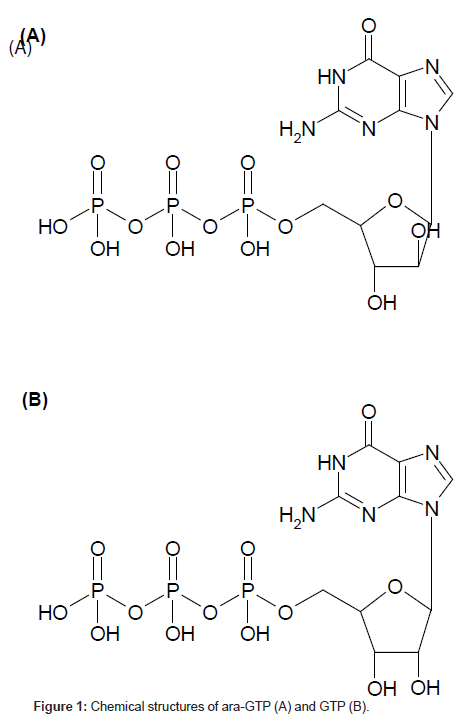
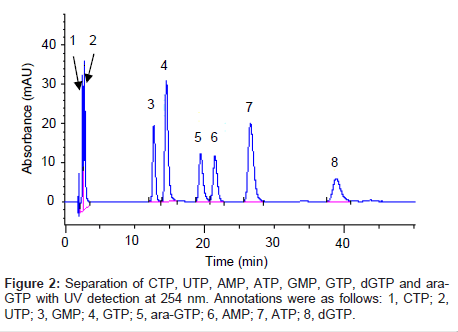
When determining the concentration of cellular ara-GTP, it is essential to separate the purine nucleotide analogue ara-GTP from other endogenous purine nucleotides. It is particularly important to separate ara-GTP from GTP, which is a stereoisomer of ara-GTP at the 2’-OH position in the sugar moiety (Figure 1). GTP was used in this study as an internal standard. Several types of analytical columns such as a PGC column, ion-exchanging columns, multimode-type columns and a polyfluorinated column were tested (data not shown). An adequate separation from GTP and other endogeneous constitutents was only achieved with a Hypercarb PGC column as ara-GTP is an epimer of GTP. Hence, the Hypercarb PGC column was selected for this study. This column gave good resolution of ara-GTP and GTP, probably because of the difference in the steric arrangement of 2’-OH in ara-GTP and GTP, which would result in different interactions of these compounds with the planar sheets of hexagonal carbon atoms. Among several buffers tested (data not shown), ammonium carbonate buffer solution (pH 9.5) was a suitable eluent for the separation and provided good peak profiles. Ara-GTP eluted at 19.4 min and the other nucleotides eluted with an adequate separation from ara-GTP (Figure 2). A stereo-isomer, GTP, was eluted before ara-GTP. Consequently, good separation of ara-GTP from purine nucleotides was achieved.
Selectivity
Characteristic precursor ions [M+H]+ at m/z 524 to 152 were consistent with the chemical structures of ara-GTP and GTP, and used as selective reaction monitoring transitions to ensure highly selective determination.
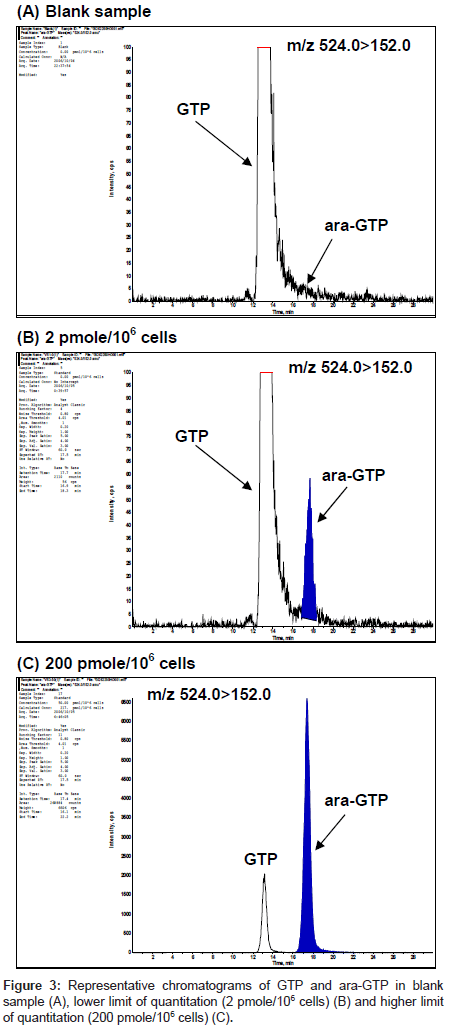
The selectivity of the method was assessed by analysis of blank samples. LC-MS/MS chromatograms of the blank and validation samples were visually examined and compared for chromatographic integrity and potential interferences. Representative chromatograms of the blank and validation samples are shown in figure 3. No unacceptable interferences from endogenous material were observed at the retention time of ara-GTP, and the GTP peak areas were reproducible for multiple samples.
Linearity and sensitivity
To achieve good quantitation irrespective of the problems associated with the standard addition method, endogenous GTP, which elutes near ara-GTP, was used as an internal standard.
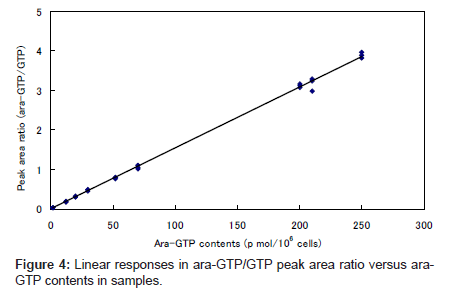
The plot of ara-GTP/GTP peak area ratio against the concentration of added ara-GTP was linear over the range 2–250 pmol per 106 cells (Figure 4). This indicates that the endogenous GTP was an appropriate internal standard for the quantitation.
Precision and accuracy
The concentrations of ara-GTP in validation samples quantified by the standard addition method are presented in Table 1 along with accuracy and precision values. Accuracy was indicated as the percentage of bias against the nominal concentration of spiked sample. Precision was indicated as the percentage of coefficient of variation.
| Validation sample | Bias | Within-run precision (n=3) | Between-run precision (n=3) |
| 2 pmol/106 cells | 11.7% | 11.0% | Negligible |
| 20 pmol/106 cells | 4.5% | 6.2% | Negligible |
| 200 pmol/106 cells | −6.4% | 16.2% | Negligible |
Negligible, smaller value than the Within-run precision
Table 1: Bias and Precision of Individual Validation Sample Concentrations for Ara- GTP in Cell Extracts.
Among all the validation sample examined, the maximum percentage of bias in quantitation was not more than 11.7 %. The within-assay precisions were not greater than 16.2 %, and the between- assay precisions were good.
Carry-over
Carry-over was evaluated by injection of a blank sample right after injection of a sample with 250 pmol of ara-GTP per 106 cells.
There were no contributions assessed as a carry-over, as none of the blank samples showed chromatographic peaks greater than 20 % of the mean response at the lower limit of quantitation (2 pmol per106 cells).
Stability of the processed extract
The stability of ara-GTP in processed extracts of cell samples spiked with ara-GTP at 2 and 200 pmol per 106 cells and stored for 96 h at 4°C was assessed in triplicate by comparing the mean responses to those of freshly prepared extract. The stability data are presented in Table 2. The percentage difference was less than 15 %, which indicates that ara-GTP is stable in processed extracts of spiked cell samples stored at 4°C for at least 96 h.
| Peak Area Ratio (n=3) | |||||||
| Validation samples | 24 hours | 96 hours | |||||
| Fresh | Stored | %Diff | Fresh | Stored | %Diff | ||
| 2 pmol/106 cells | Mean | 0.04374 | 0.04120 | −5.8 | 0.04126 | 0.03827 | −7.3 |
| SD | 0.00193 | 0.00159 | 0.00362 | 0.00297 | |||
| CV% | 4.4 | 3.9 | 8.8 | 7.8 | |||
| 200 pmol/106 cells | Mean | 4.22040 | 4.18034 | −0.9 | 3.99101 | 4.12102 | 3.3 |
| SD | 0.04920 | 0.12610 | 0.13888 | 0.07118 | |||
| CV% | 1.2 | 3.0 | 3.5 | 1.7 | |||
% Diff, (Mean(Stored)-Mean(Fresh))/Mean(Fresh)×100
Table 2: Processed Extract Stability Data for Ara-GTP Stored at 4OC
Refrigerator to room temperature stability
The stability of ara-GTP in cell extracts after four temperature cycles from the refrigerator (–80°C) to room temperature was assessed at 2 and 200 pmol per 106 cells (in triplicate). The mean responses were compared to those of the freshly prepared extract. The stability data are presented in Table 3. The percentage difference among the results was less than 15 %. This indicates that ara-GTP is stable in cell extracts after at least four temperature cycles from the refrigerator to room temperature.
| Peak Area Ratio (n=3) | ||||||||||
| Validation samples | Cycle-1 | Cycle-2 | Cycle-4 | |||||||
| Fresh | Stored | %Diff | Fresh | Stored | %Diff | Fresh | Stored | %Diff | ||
| 2 pmol/106 cells | Mean | 0.04468 | 0.04322 | −3.3 | 0.04374 | 0.04277 | −2.2 | 0.04126 | 0.03820 | −7.4 |
| SD | 0.00164 | 0.00292 | 0.00193 | 0.00212 | 0.00362 | 0.00264 | ||||
| CV% | 3.7 | 6.8 | 4.4 | 4.9 | 8.8 | 6.9 | ||||
| 200 pmol/106 cells | Mean | 4.18137 | 3.84085 | −8.1 | 4.22040 | 3.94916 | −6.4 | 3.99101 | 3.85821 | −3.3 |
| SD | 0.29920 | 0.35352 | 0.04920 | 0.11375 | 0.13888 | 0.19987 | ||||
| CV% | 7.2 | 9.2 | 1.2 | 2.9 | 3.5 | 5.2 | ||||
% Diff, (Mean(Stored)-Mean(Fresh))/Mean(Fresh)×100
Table 3: Refrigeration-Ambient Stability Data for Ara-GTP in Cell Extracts, 4 Cycles from −80ºC to Room Temperature.
Long term storage stabilities in cell extracts
The long term storage stabilities of ara-GTP in cell extracts treated with methanol/250 mmol/L ammonium carbonate solution (7/3, v/v) or methanol/28 % ammonia water (7/3, v/v) and stored at −30°C and −80°C were assessed. Samples of ara-GTP at 20 pmol per 106 cells were prepared in triplicate and the mean concentrations for the different storages times (Table 4) relative to the nominal concentration were compared. Ara-GTP was stable in cell extracts treated with methanol/28% ammonia water (7/3, v/v) for up to 3 days at −30°C and 2 months at −80°C, whereas it was not stable in cell extracts treated with methanol/250 mmol/L ammonium carbonate solution (7/3, v/v). These results indicate that for long-term storage, cells for ara-GTP measurements need to be treated with methanol/28 % ammonia water (7/3, v/v) and stored at −80°C.
| ara-GTP concentration (pmol/106 cells) | |||||||
| −30°C | −80°C | ||||||
| Day1 | Day3 | Day6 | Day6 | Day13 | 1 month | 2 months | |
| MeOH / 28% ammonia water (7/3, v/v) | |||||||
| Mean | 18.08 | 19.65 | 14.60 | 18.05 | 20.24 | 19.12 | 17.57 |
| SD | 0.46 | 1.22 | 0.88 | 2.91 | 2.41 | 1.22 | 4.30 |
| CV% | 2.5 | 6.2 | 6.0 | 16.1 | 11.9 | 6.4 | 24.5 |
| % Diff | −9.6 | −1.7 | −27.0 | −9.8 | 1.2 | −4.4 | −12.2 |
| MeOH / 250 mM ammonium carbonate solution (7/3, v/v) | |||||||
| Mean | 17.00 | 13.01 | 12.06 | 14.81 | 13.56 | 9.65 | 11.00 |
| SD | 1.11 | 2.30 | 3.08 | 1.75 | 3.09 | 3.19 | 3.64 |
| CV% | 6.5 | 17.7 | 25.6 | 11.8 | 22.8 | 33.0 | 33.1 |
| % Diff | −15.0 | −35.0 | −39.7 | −25.9 | −51.7 | −45.0 | |
% Diff, versus nominal concentration (20 pmol/106 cells)
Table 4: Long Term Stability of Ara-GTP in Cell Extracts Treated with Methanol/Ammonia Water or Methanol/Ammonium Carbonate Solution.
Application of the method
The validated method was successfully applied to a Phase I clinical study of nelarabine in patients with relapsed or refractory T-ALL/TLBL. The pharmacokinetics of ara-GTP concentrations in PBMC in adult and pediatric patients have been reported elsewhere [17].
Conclusions
To develop a highly sensitive quantitation method for evaluation of cellular ara-GTP, we established a new LC-MS/MS method using a PGC analytical column and the standard addition method with endogenous GTP as the internal standard. This method was effectively applied to the elucidation of pharmacokinetic profiles of cellular ara-GTP in a Phase I clinical study of nelarabine in Japan. The established method is useful for determination of ara-GTP concentration in human PBMC at concentrations around a few picomoles per 106 cells.
Acknowledgements
This work was sponsored by GlaxoSmithKline K.K. and performed at the Bioanalysis Department, Takasaki Development Laboratories, GlaxoSmithKline K.K., which closed in 2008.
The authors wish to acknowledge Dr. Takahiro Yamauchi (First Department of Internal Medicine, University of Fukui, Japan) for providing us the CCRF-CEM cells. We are grateful to Mr. Kohnosuke Kinoshita, Mr. Atsuhiro Mizuno and Ms. Yumiko Ohta for their assistance.
Conflict of interest statement
The authors have no conflicts of interest to declare.
References
- Kisor DF (2005) Nelarabine: a nucleoside analog with efficacy in T-cell and other leukemias. Ann Pharmacother 39: 1056-1063.
- Gandhi V, Plunkett W (2006) Clofarabine and nelarabine: two new purine nucleoside analogs. Curr Opin Oncol 18: 584-590.
- Lambe CU, Averett DR, Paff MT, Reardon JE, Wilson JG, et al. (1995) 2-Amino-6-methoxypurine arabinoside: an agent for T-cell malignancies. Cancer Res 55: 3352-3356.
- Gandhi V, Plunkett W, Rodriguez CO Jr, Nowak BJ, Du M, et al. (1998) Compound GW506U78 in refractory hematologic malignancies: relation-ship between cellular pharmacokinetics and clinical response. J Clin Oncol 16: 3607-3615.
- Gandhi V, Plunkett W, Weller S, Du M, Ayres M, et al. (2001) Evaluation of the combination of nelarabine and fludarabine in leukemias: clinical response, pharmacokinetics, and pharmacodynamics in leukemia cells. J Clin Oncol 19: 2142-2152.
- Ravandi F, Gandhi V (2006) Novel purine nucleoside analogues for T-cell-lineage acute lymphoblastic leukaemia and lymphoma. Expert Opin Investig Drugs 15: 1601-1613.
- Simpson RC, Brown PR (1986) High-performance liquid chromatographic profiling of nucleic acid components in physiological samples. J Chromatogr 379: 269-311.
- Qian T, Cai Z, Yang MS (2004) Determination of adenosine nucleotides in cultured cells by ion-pairing liquid chromatography-electrospray ionization mass spectrometry. Anal Biochem 325: 77-84.
- Cichna M, Raab M, Daxecker H, Griesmacher A, Müller MM, et al. (2003) Determination of fifteen nucleotides in cultured human mononuclear blood and umbilical vein endothelial cells by solvent generated ion-pair chromatography. Chromatogr 787: 381-391.
- Yamauchi T, Nishi R, Kitazumi K, Nakano T, Ueda T (2010) A new high-performance liquid chromatography method determines low production of 9-ß-D-arabinofuranosylguanine triphosphate, an active metabolite of nelarabine, in adult T-cell leukemia cells. Oncol Rep 23: 499-504.
- Barroso B, Dijkstra R, Geerts M, Lagerwerf F, Van Veelen P, et al. (2002) On-line high-performance liquid chromatography/mass spectrometric characterization of native oligosaccharides from glycoproteins. Rapid Commun Mass Spectrom 16: 1320-1329.
- Van den hauwe O, Perez JC, Claereboudt J, Peteghem CV, Ru A (2001) Simultaneous determination of betamethasone and dexamethasone residues in bovine liver by liquid chromatography/tandem mass spectrometry. Rapid Commun Mass Spectrom 15: 857-861.
- Barnes K, Fussell RJ, Startin JR, Mobbs HJ, James R, et al. (1997) Determination of the pesticide fenbutatin oxide in tomatoes, cucumbers and bananas by high performance liquid chromatographic/atmospheric pressure chemical ionization-mass spectrometry. Rapid Commun Mass Spectrom 11: 159-164.
- Chin ET, Papac DI (1999) The use of a porous graphitic carbon column for desalting hydrophilic peptides prior to matrix-assisted laser desorption/ionization time-of-flight mass spectrometry. Anal Biochem 273: 179-185.
- West C, Elfakir C, Lafosse M (2010) Porous graphitic carbon: A versatile stationary phase for liquid chromatography. J Chromatogr A 1217: 3201-3216.
- US Department of Health and Human Services, Food and Drug Administration, Guidance for Industry Bioanalytical Method Validation, 2001.
- Horibe K, Takimoto T, Yokozawa T, Makimoto A, Kobayashi Y, et al. (2011) Phase I study of nelarabine in patients with relapsed or refractory T-ALL/T-LBL. Rinsho Ketsueki 52: 406-415.
Relevant Topics
Recommended Journals
Article Tools
Article Usage
- Total views: 14914
- [From(publication date):
specialissue-2014 - Jul 15, 2025] - Breakdown by view type
- HTML page views : 10253
- PDF downloads : 4661


