Research Article Open Access
A Ringdown Breath Acetone Analyzer: Performance and Validation Using Gas Chromatography-Mass Spectrometry
Gong ZY1, Sun MX1, Jian CY1, Wang ZN1, Kang ML1, Li YX1 and Wang C1,2*
1Laser Medicine Laboratory, Institute of Biomedical Engineering, Chinese Academy of Medical Science and Peking Union Medical College, Tianjin, China
2Department of Physics and Astronomy, Mississippi State University, USA
- *Corresponding Author:
- Chuji Wang
Professor, Department of Physics and Astronomy
Mississippi State University
Starkville, MS 39759
US Army Research Laboratory
Adelphi, MD 20783, USA
Tel: 662-325-9455
E-mail: cw175@msstate.edu
Received Date: March 17, 2014; Accepted Date: April 25, 2014; Published Date: April 28, 2014
Citation: Gong ZY, Sun MX, Jian CY, Wang ZN, Kang ML, et al. (2014) A Ringdown Breath Acetone Analyzer: Performance and Validation Using Gas Chromatography- Mass Spectrometry. J Anal Bioanal Tech S7:013. doi: 10.4172/2155-9872.S7-013
Copyright: © 2014 Gong ZY, et al. This is an open-access article distributed under the terms of the Creative Commons Attribution License, which permits unrestricted use, distribution, and reproduction in any medium, provided the original author and source are credited.
Visit for more related articles at Journal of Analytical & Bioanalytical Techniques
Abstract
Acetone in exhaled breath is a potential biomarker of diabetes mellitus (DM) and elevated breath acetone concentrations have been observed in DM patients. One of the near real-time and online breath acetone analysis techniques is cavity ringdown spectroscopy (CRDS) that has been demonstrated for breath acetone measurements in human subjects including diabetic patients in a clinic. In this work, we have constructed a ringdown breath acetone analyzer for the purpose of instrument validation. Its detection capabilities, such as limit of detection, baseline stability, detection sensitivity, and reproducibility, were investigated. For the first time, a ringdown acetone breath analyzer has been validated using gas chromatography-mass spectrometry (GC-MS), which is typically referred to as the golden standard method for trace gas analysis. The GC-MS validation challenged the analyzer’s response to various breath acetone concentrations and its quantitative measurement accuracy. Subsequently, 25 subjects including 19 healthy and 6 diabetic people were tested using the validated ringdown breath acetone analyzer. Comparison of the testing results shows that this ringdown breath acetone analyzer can be used for reliable real-time, online breath acetone analysis in a clinic.
Keywords
Diabetes; CRDS; GC-MS validation; Breath acetone analysis; Blood glucose level
Abbreviations
DM: Diabetes Mellitus; BG: Blood Glucose; CRDS: Cavity Ringdown Spectroscopy; GC-MS: Gas Chromatography-Mass Spectrometry; T1D: Type 1 Diabetes; T2D: Type 2 Diabetes; PMT: Photo Multiplier Tube; A/D: Analog to Digital; VOCs: Volatile Organic Compounds; SIM: Selected Ion Monitoring; SNR: Signal-to-Noise Ratio; BMI: Body Mass Index; TIC: Total Ion Chromatogram; OGTT: Oral Glucose Tolerance Test; FEP: Fluorinated Ethylene Propylene
Introduction
There are more than 380 million people living with diabetes mellitus (DM) in the world [1]. This number will reach more than 470 million by 2035. In 2013 alone, 5.1 million deaths were blamed on diabetes. The situation is much more serious than that in five years ago [1]. The fact of the global prevalence of diabetes is undisputed. Blood glucose (BG) measurements are indispensable for both patients and clinicians to evaluate diabetic control and management [2,3]. At present, BG meters are predominantly used to determine the glucose concentration in the blood. The BG monitoring method using BG meters is quite popular and still irreplaceable so far; nonetheless, many alternative techniques are being pursued because blood test is intrusive, painful, and inconvenient. Breath analysis, by testing the exhaled breath components, provides a potential option for nonintrusive disease diagnosis and therapeutic and metabolic status monitoring. Breath acetone, being an arguable biomarker of DM [4-10], is still a good indicator of DM based on the statistical fact of its elevated concentration in DM patients [11-22]. Due to the complexity and trace concentration of volatile organic compounds (VOCs) in exhaled breath, breath acetone analysis requires measuring techniques to be highly sensitive and selective [23-27]. Gas chromatography-mass spectrometry (GC-MS) [17,28-32] has been regarded as a golden standard method for trace gas analysis including breath analysis. However GC-MS is not suitable for developing a point-of-care (POC) instrument for real-time, on-line breath analysis, partially due to its complicated sample preparation, time-consuming test procedure, and large instrument geometry.
The cavity ringdown spectroscopy (CRDS) [33-39] technique has high sensitivity and selectivity that are essential for breath analysis. CRDS also has advantages of fast response and relatively low cost, which make the technique uniquely attractive for breath analysis. A ringdown breath acetone analyzer based on the CRDS technique has been developed and applied to measure breath acetone concentrations in both human and canine subjects in the previous studies [40-45]. This type of breath acetone analyzer has promise for a large scale clinical testing once it is validated using a golden standard method, e.g. GC-MS. To date, no side-by-side comparison and validation has been done for this type of ringdown-based acetone breath analyzer. In this work, we have constructed a ringdown breath acetone analyzer for the purpose of instrument validation using a certified GC-MS facility. 25 human subjects including 6 diabetic patients have been tested using the new ringdown acetone breath analyzer. Performance of this analyzer for quantitative measurements of breath acetone is validated.
Experimental
Ringdown breath acetone analyzer
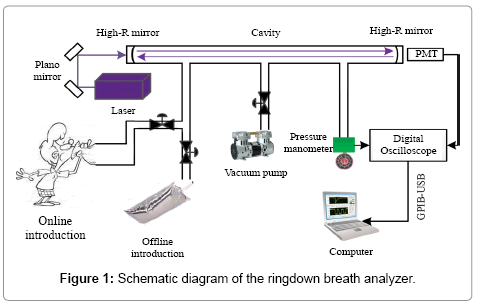
Figure 1 shows the schematic diagram of the ringdown breath analyzer that is similar to the one used in the previous studies [41-45]. A near single-mode (TEM00) Q-swithced Nd:YAG laser (Changchun New Industries Optoelectronics, Co., Ltd., China, MPL-F-266 nm- 3uJ-13080824), which operated at 266 nm with a repetition rate of 1 kHz
and a single-pulse energy of 4.5 μJ and was equipped with a compact laser head (238.5 mm × 88 mm × 74 mm), was used as the light source. Except for using a circular aperture to shape the laser beam and two plano mirrors to direct the beam (Thorlabs, U.S., PF05-03-F01), no mode-matching optical components were used to couple the laser beam into the ringdown cavity. The gas cell consisted of a 50-cm-long stainless steel pipe with an inner diameter of 3.81 cm (CRD Optics Inc., U.S.), one pair of mirror mounts (CRD Optics Inc., U.S.), and one pair of highreflectivity UV mirrors (Los Gatos Research, U.S., R = 99.9956%, radius of curvature = 1 m). Each mirror mount held a mirror whose position could be adjusted in multiple dimensions via three alignment screws. The gas cell was equipped with three ports, as shown in Figure 1, one was used as a gas inlet, and another two were respectively connected to a vacuum pump (Oerlikon, German, SC5D) and a micro pressure manometer (MKS, U.S., 870B) as outlets. In order to make sure the gas cell was not contaminated, high-purity nitrogen (>99.99%, DaFang Special Gas, China) was used to flush the gas cell each time after a breath sample was tested. The ringdown decay waveform captured by a photo multiplier tube (PMT) (Hamamatsu, Japan, H10721) was input to an oscilloscope (Tektronix, U.S., TDS3012B) for display and analog to digital (A/D) conversion. The ringdown waveforms were digitalized to 10,000 data points and transferred to a laptop computer via a GPIBUSB cable (National Instrument, U.S., GPIB-USB-HS). The in-house developed ringdown software was installed on the computer to obtain the ringdown time τ by fitting the ringdown data points to a single exponential decay waveform.
Ringdown measuring method
By injecting a laser pulse into a stable optical cavity, which is formed by two highly reflective mirrors, the laser pulse travels inside the cavity many round trips to increase the laser beam path-length. Due to the absorption of a gas that fills in the entire cavity and the mirror finite reflectivity, the laser intensity in the cavity decays exponentially and the decay time constant is named ringdown time. A PMT detector is placed behind the second mirror to monitor the intensity decay, and the ringdown time is determined by fitting the observed decay waveform to a single exponential function. The ringdown times measured with and without absorption of a sample gas are used to determine the gas absorption at a particular wavelength.
The breath acetone concentrations were determined using the background subtraction method which was introduced in the previous publications [41-44,46]. In brief, the laboratory air is regarded as background; the optical cavity loss caused by the laboratory atmosphere at 1 atm is defined as the effective absorbance of the atmosphere, as described by the following equation:

where σ>266 is the absorption cross-section of acetone at 266 nm, n is the acetone concentration, d is the distance between the two mirrors, c is the speed of light, τatm and τ0 are the ringdown times when the gas cell is filled with laboratory air to 1 atm and under vacuum, respectively. Likewise, the absorbance of breath acetone is obtained by

where Abreath is the absorbance of the breath gas, τbreath is the ringdown time detected when the gas cell is filled with breath gas. Therefore, the absolute breath acetone concentration (the upper limit) is given by [41,43,46]

where ΔA is the absorbance difference, and  is the mean effective absorbance of the atmosphere.
Based on an assumption that the absorbance difference is attributed to the absorption of acetone alone, it is worthy of noting that the obtained breath acetone concentrations using equation (3) are the upper limits of acetone in the breath samples [41].
GC-MS measurement
GC-MS analysis was conducted in the State Key Laboratory on Odor Pollution Control, Tianjin Academy of Environmental Science (TAES), which is a certified facility for trace chemical species analysis. The used analytical method is referred to as the Compendium Method TO-15 [47]. A cryogenic pre-concentrator (ENTECH Instruments, Inc., U.S., 7100A) was employed to remove N2, CO2, and H2O after a 3-stage pre-concentration procedure. The operating conditions and procedures are listed in Table 1.
| Parameters | 1st cryogenic trap | 2nd cryogenic trap | 3rd cryogenic trap |
|---|---|---|---|
| Capture temperature (°C) | -150 | -20 | -180 |
| Preheat temperature (°C) | 20 | — | — |
| Resolve temperature (°C) | 20 | 180 | — |
| Roast temperature (°C) | 130 | 190 | — |
| Roast time (min) | 5 | 3.5 | 2 |
| Introducing time (min) | — | — | 3 |
| Stop time (min) | — | — | 3 |
| Wait time (min) | — | — | 31 |
Table 1: The operating conditions of the gas pre-concentrator.
Subsequently, the VOCs-enriched sample was introduced into a GC-MS system (Agilent Technologies, U.S., 7890A/5975C) under the analytical conditions listed in Table 2. The MS detector profiled breath VOCs in the full scan mode, and detected those specific analytes in the selected ion monitoring (SIM) mode with a higher sensitivity and better signal-noise ratio (SNR). An internal standard was applied when performing quantification using bromochloromethane [32,48].
| GC conditions | MS conditions | ||
|---|---|---|---|
| Column | DB-5MS, 60 m × 0.32 mm × 1.0 µm | Ion source temperature (°C) | 230 |
| Carrier gas | Helium (>99.999%) | Quadrupole temperature (°C) | 150 |
| Flow rate (ml/min) | 1.5 | Interface temperature (°C) | 280 |
| Injector | Splitless | Range of mass (amu) | 15-300 |
| Column temperature (°C) | 35 (5min) → 150 (5°C/min) → 220 (15°C/min, 7min) | Scan rate (s/scan) | 0.2 |
| Inlet temperature (°C) | 100 | Energy of electron ionization source (eV) | 70 |
Table 2: The GC/MS conditions for breath gas analysis.
Breath gas sampling
All human subjects were volunteers. The research procedures and activities followed the research protocol approved by the Institutional Review Board (IRB) of human subject research in Tianjin. The diabetic subjects were recruited at Metabolic Diseases Hospital, Tianjin Medical University, breath samples were collected in a clinical ward. The healthy subjects were the people without significant disease or chronic inflammation, and breath samples were collected in a room next to the CRDS laboratory. For fasting subjects, volunteers were asked to fast overnight for over 14 hours. The data of gender, age, body mass index (BMI), T1D/T2D, complications, years of diabetes, A1C level, and BG level, were recorded for each subject. The subjects breathed single endtidal breath into a 1 liter breath gas collection bag (HaoChenTianCheng, Beijing, China) via a disposable mouthpiece. Each breath bag was flushed using the high-purity nitrogen and then evacuated three times prior to use. Simultaneous BG levels of all subjects were tested with a blood glucose meter (Roche, Switzerland). The breath samples were stored in an icebox during transport, and all samples were tested using the breath acetone analyzer and/or the GC-MS method within 6 hours after a breath gas collection.
Results and Discussion
Performance of the ringdown breath acetone analyzer
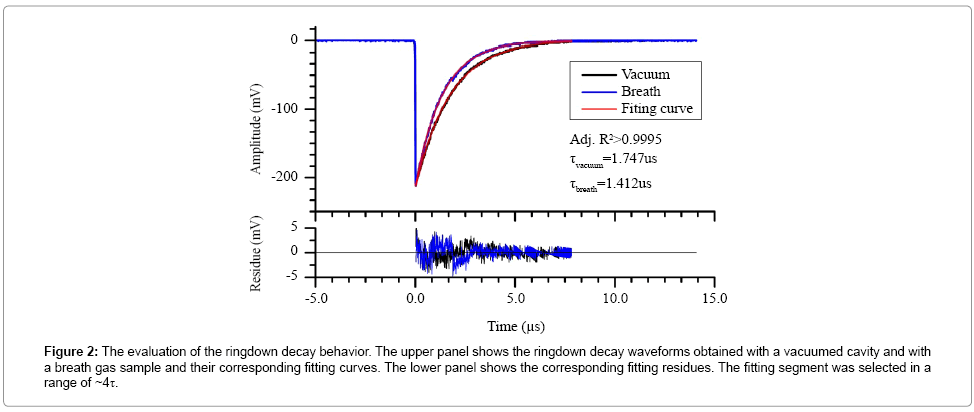
A series of tests were conducted to establish an instrument selfevaluation of the newly constructed ringdown breath acetone analyzer. The ringdown decay behavior of the breath acetone analyzer was evaluated, as shown in Figure 2. The upper panel shows two typical ringdown decay waveforms recorded when the gas cell was evacuated and filled with breath gas to 1 atm, respectively. Each waveform was an average over 128 ringdown events and fitted to a single exponential curve. The minor fitting residues and the R2 coefficient indicate that the ringdown measurement resembles Beer’s absorption law and displays a single exponential decay.
Figure 2: The evaluation of the ringdown decay behavior. The upper panel shows the ringdown decay waveforms obtained with a vacuumed cavity and with a breath gas sample and their corresponding fitting curves. The lower panel shows the corresponding fitting residues. The fitting segment was selected in a range of ~4τ.
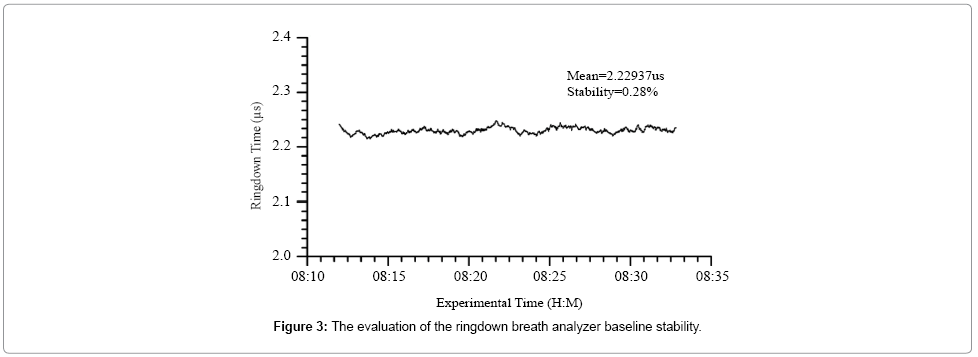
Figure 3 shows a typical ringdown baseline scan in which each data point was obtained by averaging 128 ringdown events. The baseline stability is 0.28% in this case. According to the obtained ringdown time in an empty gas cell, the measured mirror reflectivity was 99.93%. Additionally, using the ringdown baseline stability, 0.3%, and the acetone absorption cross-section at the atmospheric pressure and room temperature, σ266 = 4.5 × 10⁻²⁰ cm2/molecule [49,50], the theoretical detection limit of the analyzer for acetone is estimated to be 0.11 ppm based on the 3-σ criteria [41].
Acetone samples at different concentrations in nitrogen were tested using the analyzer. Figure 4 shows the measured acetone concentration versus sample concentration. The measurement uncertainty is ~5% as marked by the error bars. The linear fitting curve shows good linearity (R = 0.9988). It suggests that the ringdown breath acetone analyzer has a linear response to acetone in the range of 0.2 to 1.1 ppm. Note that the concentration ranging of 0.2–1.1 ppm did not cover the acetone concentrations in all subjects tested in this work (Table 3). However, it is generally accepted that if the analyzer responses well in the lower concentration range, then the analyzer most likely behaviors well (if not better) in a slightly higher range, e.g., from 1 to 4 ppmv, because the lower concentrations are more close to the detection limit and test of linearity using a low concentration is much more rigorous.
| No. | Gender | Age | Type | Year on diabetes | Weight(kg) | Height(cm) | BMI | A1C(%) | BGL(mg/dL) | Acetone(ppmv) | Sample No. | Sampling status |
|---|---|---|---|---|---|---|---|---|---|---|---|---|
| 1 | F | 20 | Healthy | n/a | 49 | 156 | 20.13 | n/a | 108.00 | 2.00 | #H1 | post breakfast 2h |
| 2 | M | 20 | Healthy | n/a | 65 | 175 | 21.22 | n/a | 97.20 | 1.33 | #H2 | post breakfast 2h |
| 3 | M | 25 | Healthy | n/a | 65 | 165 | 23.88 | n/a | 90.00 | 1.14 | #H3 | post breakfast 2h |
| 142.20 | 1.70 | #H4 | post lunch 2h | |||||||||
| 117.00 | 0.89 | #HF6 | Fasting | |||||||||
| 4 | M | 38 | Healthy | n/a | 79 | 170 | 27.34 | n/a | 117.00 | 0.60 | #H5 | post lunch 2h |
| 120.60 | 0.60 | #H10 | post lunch 2h | |||||||||
| 5 | M | 22 | Healthy | n/a | 58 | 171 | 19.84 | n/a | 163.80 | 0.77 | #H6 | post lunch 2h |
| 90.00 | 0.98 | #HF4 | Fasting | |||||||||
| 6 | F | 26 | Healthy | n/a | 55 | 165 | 20.20 | n/a | 142.20 | 1.10 | #H7 | post lunch 2h |
| 111.60 | 1.05 | #HF2 | Fasting | |||||||||
| 7 | F | 27 | Healthy | n/a | 53 | 158 | 21.23 | n/a | 140.40 | 0.91 | #H8 | post lunch 2h |
| 102.60 | 0.89 | #HF5 | Fasting | |||||||||
| 8 | F | 25 | Healthy | n/a | 47 | 160 | 18.36 | n/a | 91.80 | 1.64 | #HF8 | Fasting |
| 9 | F | 25 | Healthy | n/a | 50 | 160 | 19.53 | n/a | 93.60 | 1.30 | #HF9 | Fasting |
| 10 | F | 26 | Healthy | n/a | 50 | 165 | 18.37 | n/a | 100.80 | 0.64 | 1112-1 | fasting |
| 111.60 | 0.57 | 1112-2 | post breakfast 2h | |||||||||
| 108.00 | 0.80 | 1112-3 | before lunch | |||||||||
| 162.00 | 0.92 | 1112-4 | post lunch 2h | |||||||||
| 11 | M | 26 | Healthy | n/a | 60 | 170 | 20.76 | n/a | 90.00 | 1.22 | #HF1 | Fasting |
| 12 | M | 23 | Healthy | n/a | 73 | 175 | 23.84 | n/a | 88.20 | 1.55 | #HF3 | Fasting |
| 95.40 | 1.91 | #HF10 | Fasting | |||||||||
| 13 | F | 34 | Healthy | n/a | 60 | 164 | 22.31 | n/a | 97.20 | 1.05 | #HF11 | Fasting |
| 14 | M | 25 | Healthy | n/a | 60 | 174 | 19.82 | n/a | 99.00 | 1.25 | #HF12 | Fasting |
| 15 | M | 29 | Healthy | n/a | 75.4 | 173 | 25.19 | n/a | 93.60 | 1.51 | #HF13 | Fasting |
| 16 | F | 25 | Healthy | n/a | 50 | 155 | 20.81 | n/a | 95.40 | 1.27 | #HF14 | Fasting |
| 17 | F | 25 | Healthy | n/a | 50 | 153 | 21.36 | n/a | 97.20 | 2.62 | #HF15 | Fasting |
| 18 | M | 29 | Healthy | n/a | 96 | 179 | 29.96 | n/a | 165.60 | 0.82 | #H9 | post lunch 2h |
| 19 | F | 48 | Healthy | n/a | 90 | 163 | 33.87 | n/a | 97.20 | 1.37 | #HF7 | Fasting |
| 20 | M | 52 | T1D | 21 | 68 | 166 | 24.68 | 10.7 | 192.60 | 2.76 | #TD1 | Fasting |
| 68 | 166 | 24.68 | 140.40 | 2.14 | #TD1 | post breakfast 2h | ||||||
| 68 | 166 | 24.68 | 288.00 | 3.63 | #TD1 | post lunch 2h | ||||||
| 68 | 166 | 24.68 | 151.20 | 2.14 | #TD1 | post dinner 2h | ||||||
| 21 | M | 44 | T1D | 2 | 73 | 170 | 25.26 | n/a | 136.80 | 2.03 | #TD2 | Fasting |
| 22 | M | 54 | T1D | 11 | 66 | 166 | 23.95 | 9.7 | 163.80 | 2.19 | #TD3 | Fasting |
| 111.60 | 1.99 | #TD3 | post breakfast 2h | |||||||||
| 174.60 | 2.41 | #TD3 | post dinner 2h | |||||||||
| 23 | F | 56 | T2D | - | 66 | 160 | 25.78 | n/a | 174.60 | 2.84 | #TD4 | fasting |
| 117.00 | 2.59 | #TD4 | post breakfast 2h | |||||||||
| 117.00 | 2.03 | #TD4 | post lunch 2h | |||||||||
| 24 | M | 39 | T2D | 0.5 | 102 | 178 | 32.19 | 11 | 124.20 | 2.11 | #TD5 | fasting |
| 261.00 | 4.20 | #TD5 | post breakfast 2h | |||||||||
| 25 | M | 24 | T2D | 2 months | 90 | 176 | 29.05 | 11.2 | 153.00 | 2.94 | #TD6 | fasting |
| 270.00 | 3.92 | #TD6 | post breakfast 2h |
Table 3: Detailed information and test results of the subjects tested in this study.
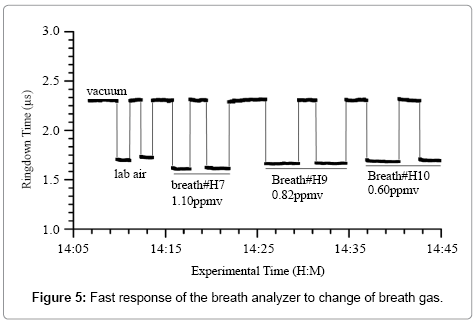
Figure 5 shows a typical response of the ringdown breath acetone analyzer to the laboratory air and the breath samples from three healthy subjects. As labeled, the first two blocks are analyzer’s response to the laboratory air, which also serve as the background measurement. The following three pairs of blocks are the measurement results obtained from three different healthy subjects. The simultaneous BG values are also shown in Figure 5. The ringdown time differences between different breath samples are easily observed. The sharp rising and falling edges of each block indicate the rapid-response (~1 s) of the analyzer. At the end of each test, the ringdown time went back to the same baseline level when the gas cell was evacuated. These tests demonstrate that the ringdown breath acetone analyzer has the capabilities of high sensitivity, good reproducibility, and fast and linear response
Validation of the breath analyzer using the certified GC-MS
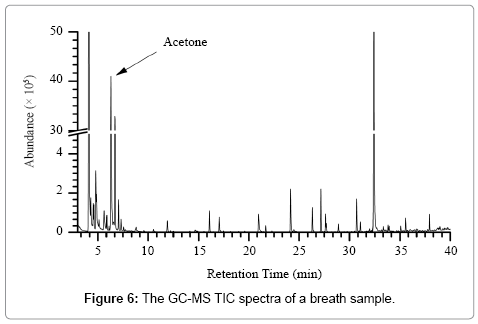
Figure 6 shows the total ion chromatogram (TIC) of a breath sample using the GC-MS full scan mode. The label ‘Acetone’ indicates the spectra of acetone. The 10 most abundant VOCs in breath are acetone, isoprene, 1,4-dichlorobenzene, methyl sulphide, ethanol, chloromethane, 2-methylpentane, dichloromethane, normal hexane, and 2-methyl butane.
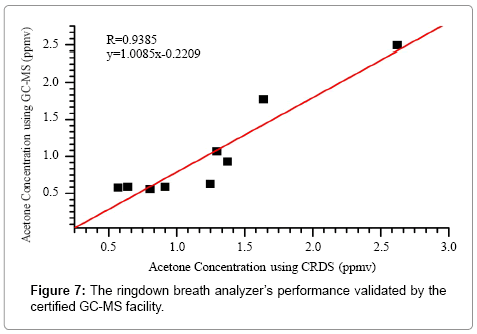
In total, 9 breath samples from 6 individual healthy subjects were tested using both the ringdown breath acetone analyzer and the certified GC-MS facility. In this experiment, the GC-MS system operated in the selected ion monitoring (SIM) mode for quantification of acetone only, and it took about ~1 hour to test one sample. As a result, Figure 7 shows a comparison of the measured acetone concentrations using two individual methods. On the one hand, the fitting of the data shows a linear trend of the CRDS measurement versus the GC-MS measurement. This result verifies the characteristic of linear-response of the ringdown breath acetone analyzer. On the other hand, the slope (= 1.01) in the fitting equation suggests that the obtained acetone concentrations using both methods are consistent. This GC-MS validation test confirms that the ringdown breath acetone analyzer based on the CRDS technique is a reliable instrument for fast (~1 s), highly sensitive, and quantitative measurement of breath acetone.
Test of healthy and diabetic subjects using the validated ringdown breath acetone analyzer
19 healthy (No.1–19) and 6 diabetic subjects (No.20–25) participated in the breath tests using the validated ringdown breath acetone analyzer. 29 samples from 19 healthy subjects and 15 samples from 6 diabetic subjects were collected and tested. Table 3 lists the detailed information on all subjects and samples.
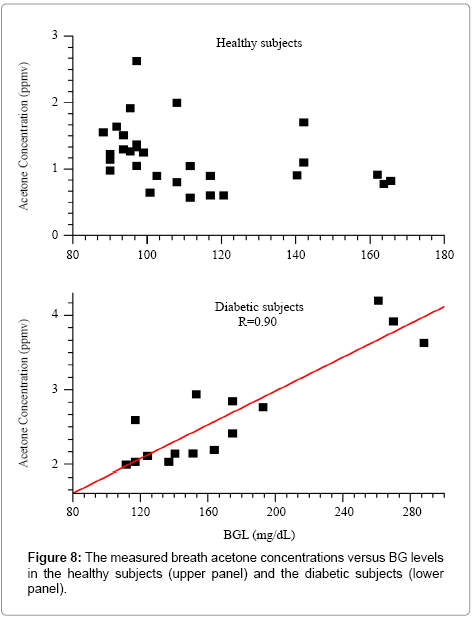
Figure 8 shows the graph of breath acetone concentration versus the simultaneous BG level in both the healthy group and the diabetic group. The mean breath acetone concentration of the healthy group was 1.19 ppm, and, no obvious correlation was observed between breath acetone concentration and BG level. Among the diabetic subjects, 3 of them were T1D and the rest were T2D. 8 breath samples were collected from the T1D subjects, while 7 samples from the T2D subjects. The mean breath acetone concentrations in the T1D and T2D subjects were determined to be 2.41 ppm and 2.95 ppm, respectively. The results suggest that the subjects with higher BG levels tend to have elevated breath acetone concentrations.
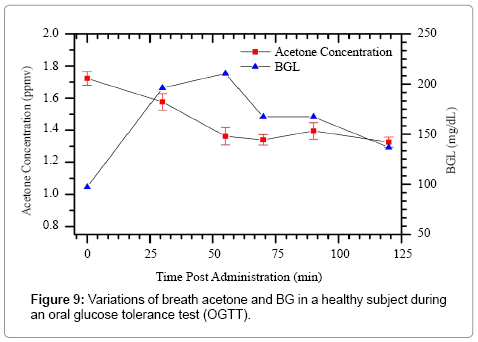
In this study, we investigated the time-dependent variations of breath acetone in a healthy subject (No. 3) during an oral glucose tolerance test (OGTT). The subject was a 25 year-old male with BMI of 23.9. He had an overnight fasting before the OGTT. As shown in Figure 9, the BG level shows a typical OGTT pattern [51], i.e., a rapid increase with a peak value of 210.6 mg/dL at 60 min, followed by a gradual decrease to 136.8 mg/dL (< 140 mg/dL) at 120 min. The simultaneous breath acetone concentrations show a decreasing trend in the first hour, from 1.72 ppm to 1.57 ppm, and then stabilized at the level of approximately 1.36 ppm.
Comparison of different breath gas collection bags
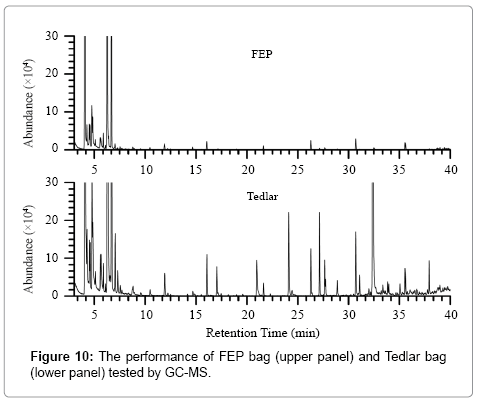
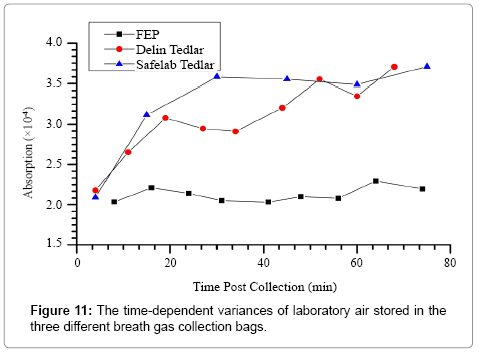
In this study, fluorinated ethylene propylene (FEP) breath bags were used to collect breath samples. In general, Tedlar bags have been widely used for gas sampling in many breath researches [32,52-54]. However, the GC-MS test shows that FEP bags has better performance than Tedlar bags, as can be seen in Figure 10. The TIC graph suggests that FEP bags cause much less interference as compared to Tedlar bags. Two types of Tedlar bags (Safelab Tedlar and Delin Tedlar, from Beijing Safelab Technology Ltd. and Dalian Delin Gas Packing Co., Ltd., China, respectively) and one types of FEP bag (HaoChenTianCheng, Beijing, China) were further investigated by continuously measuring CRDS absorbance of the laboratory air stored in the different bags.
Figure 11 shows that the ringdown absorbance of the laboratory air went up obviously along with the time increased when using Tedlar bags, but FEP bags showed a good stability. This phenomenon reminds researchers to be careful when choosing breath bags for breath sampling. The best way to avoid potential sampling noises from using a breath collection bag is to breathe directly to the analyzer and this modification of the present breath analyzer is underway.
Conclusions
A ringdown breath acetone analyzer based on the CRDS technique was constructed to test breath acetone concentrations in human subjects. For the first time, this analyzer was validated by a certified GC-MS method which is normally accepted as a golden standard for trace gas analysis. By measuring breath samples using both the ringdown breath acetone analyzer and the GC-MS facility, the obtained results show that the breath analyzer responses linearly to various breath acetone concentrations and the quantitative measurements using both methods are consistent. The GC-MS validation confirms that this ringdown breath acetone analyzer is a reliable instrument for real-time (~1 s), online (no sample preparation) breath acetone measurement. The breath samples collected from 19 healthy and 6 diabetic subjects (3 T1D and 3 T2D) were tested using the validated breath acetone analyzer. The mean acetone concentration in the 19 healthy subjects was 1.19 ppm, while that in the 6 diabetic subjects was 2.68 ppm. Additionally, the GC-MS tests of different breath gas collection bags suggest that breath bags may cause some interference to the breath sample, and researchers should be cautious when using a breath gas collection bag for sampling. A large scale of clinical testing of breath acetone using this validated ringdown breath acetone analyzer is underway.
Acknowledgements
The authors thank the participation of numerous volunteers who provided breath gas samples.
References
- Danaei G, Finucane MM, Lu Y, Singh GM, Cowan MJ, et al. (2011) National, regional, and global trends in fasting plasma glucose and diabetes prevalence since 1980: systematic analysis of health examination surveys and epidemiological studies with 370 country-years and 2•7 million participants. Lancet 378: 31-40.
- [No authors listed] (1998) Intensive blood-glucose control with sulphonylureas or insulin compared with conventional treatment and risk of complications in patients with type 2 diabetes (UKPDS 33). UK Prospective Diabetes Study (UKPDS) Group. Lancet 352: 837-853.
- Eschwege E, Richard J, Thibult N, Ducimetiere P, Warnet J, et al. (1984) Coronary heart disease mortality in relation with diabetes, blood glucose and plasma insulin levels. The Paris Prospective Study, ten years later. Horm Metab Res Suppl 15: 41-46.
- GLAUBITT D, RAUSCH-STROOMANN JG (1959) [A new method for acetone determination in respiratory air]. Clin Chim Acta 4: 165-169.
- levey S, Balchum Oj, Medrano V, Jung R (1964) Studies of Metabolic Products In Expired Air. II. Acetone. J Lab Clin Med 63: 574-584.
- Brechner VL, Bethune RW (1965) Determination of acetone concentration in arterial blood by vapor phase chromatography of alveolar gas. Diabetes 14: 663-665.
- Tassopoulos CN, Barnett D, Fraser TR (1969) Breath-acetone and blood-sugar measurements in diabetes. Lancet 1: 1282-1286.
- Haggard HW, Greenberg LA, Turner JM (1944) The physiological principles governing the action of acetone together with determination of toxicity. J Ind Hyg Toxicol 26: 133-151.
- Wang Z, Wang C (2013) Is breath acetone a biomarker of diabetes? A historical review on breath acetone measurements. J Breath Res 7: 037109.
- American Diabetes Association (1997) Standards of medical care for patients with diabetes mellitus. S3-S13.
- Mürtz M (2005) Breath diagnostics using laser spectroscopy. Opt Photonics News 16: 30-35.
- Mürtz M, Halmer D, Horstjann M, Thelen S, Hering P (2006) Ultra sensitive trace gas detection for biomedical applications. Spectrochim Acta A Mol Biomol Spectrosc 63: 963-969.
- Risby TH, Solga SF (2006) Current status of clinical breath analysis. Appl Phys B 85: 421-426.
- McCurdy MR, Bakhirkin Y, Wysocki G, Lewicki R, Tittel FK (2007) Recent advances of laser-spectroscopy-based techniques for applications in breath analysis. J Breath Res 1: 014001.
- Cao W, Duan Y (2007) Current Status of Methods and Techniques for Breath Analysis. Crit Rev Anal Chem 37: 3-13.
- Deng C, Zhang J, Yu X, Zhang W, Zhang X (2004) Determination of acetone in human breath by gas chromatography-mass spectrometry and solid-phase microextraction with on-fiber derivatization. J Chromatogr B Analyt Technol Biomed Life Sci 810: 269-275.
- Anderson JC, Lamm WJ, Hlastala MP (2006) Measuring airway exchange of endogenous acetone using a single-exhalation breathing maneuver. J Appl Physiol (1985) 100: 880-889.
- Diskin AM, Spanel P, Smith D (2003) Time variation of ammonia, acetone, isoprene and ethanol in breath: a quantitative SIFT-MS study over 30 days. Physiol Meas 24: 107-119.
- Turner C, Spanel P, Smith D (2006) A longitudinal study of ammonia, acetone and propanol in the exhaled breath of 30 subjects using selected ion flow tube mass spectrometry, SIFT-MS. Physiol Meas 27: 321-337.
- Smith D, Spanel P (2005) Selected ion flow tube mass spectrometry (SIFT-MS) for on-line trace gas analysis. Mass Spectrom Rev 24: 661-700.
- Teshima N, Li J, Toda K, Dasgupta PK (2005) Determination of acetone in breath. Analytica Chimica Acta 535: 189-199.
- Smith D, Spanel P, Davies S (1999) Trace gases in breath of healthy volunteers when fasting and after a protein-calorie meal: a preliminary study. J Appl Physiol (1985) 87: 1584-1588.
- Risby TH, Pleil JD (2013) Breath analysis--past, present and future: a special issue in honour of Michael Phillips' 70th birthday. J Breath Res 7: 010201.
- Miekisch W, Schubert JK, Noeldge-Schomburg GF (2004) Diagnostic potential of breath analysis--focus on volatile organic compounds. Clin Chim Acta 347: 25-39.
- Joachim DP, Wolfram M, Terence HR, Michael CM, Jon RS (2013) Meeting reports for 2013: recent advances in breath biomarker research. J Breath Res 7: 029001.
- Buszewski B, Kesy M, Ligor T, Amann A (2007) Human exhaled air analytics: biomarkers of diseases. Biomed Chromatogr 21: 553-566.
- Amann A, Poupart G, Telser S, Ledochowski M, Schmid A, et al. (2004) Applications of breath gas analysis in medicine. Int J Mass Spectrom 239: 227-233.
- Phillips M, Herrera J, Krishnan S, Zain M, Greenberg J, et al. (1999) Variation in volatile organic compounds in the breath of normal humans. J Chromatogr B Biomed Sci Appl 729: 75-88.
- Ueta I, Saito Y, Hosoe M, Okamoto M, Ohkita H, et al. (2009) Breath acetone analysis with miniaturized sample preparation device: in-needle preconcentration and subsequent determination by gas chromatography-mass spectroscopy. J Chromatogr B Analyt Technol Biomed Life Sci 877: 2551-2556.
- Ulanowska A, Trawinska E, Sawrycki P, Buszewski B (2012) Chemotherapy control by breath profile with application of SPME-GC/MS method. J Sep Sci 35: 2908-2913.
- Ulanowska A, Ligor T, Amann A, Buszewski B (2012) Evaluation of septa quality for automatic SPME-GC-MS trace analysis. J Chromatogr Sci 50: 10-14.
- O’keefe A, Deacon DAG (1988) Cavity ring-down optical spectrometer for absorption measurements using pulsed laser sources. Review of Scientific Instruments 59: 2544-2551.
- Berden G, Peeters R, Meijer G (2000) Cavity ring-down spectroscopy: Experimental schemes and applications. Int Rev Phys Chem 19: 565-607.
- Paldus BA, Kachanov AA (2005) An historical overview of cavity-enhanced methods. Can J Phys 83: 975-999.
- Mazurenka M, Orr-Ewing AJ, Peverall R, Ritchie GA (2005) Cavity ring-down and cavity enhanced spectroscopy using diode lasers. Annual Reports Section" C" (Physical Chemistry) 101: 100-142.
- Wang C (2005) Biomedical applications of cavity ringdown spectroscopy: present and perspective. 57th Southeast/61st Southwest Joint Regional Meeting of the American Chemical Society (Memphis, TN, USA, 1–4 November 2005).
- Berden G, Engeln, (2009) Cavity ring-down spectroscopy: techniques and applications. John Wiley & Sons, Ltd: Chichester, UK.
- Wang C, Srivastava N, Jones BA, Reese RB (2008) A novel multiple species ringdown spectrometer for in situ measurements of methane, carbon dioxide, and carbon isotope. Appl Phys B 92: 259-270.
- Ciaffoni L, Hancock G, Harrison JJ, van Helden JP, Langley CE, et al. (2013) Demonstration of a mid-infrared cavity enhanced absorption spectrometer for breath acetone detection. Anal Chem 85: 846-850.
- Wang C, Surampudi AB (2008) An acetone breath analyzer using cavity ringdown spectroscopy: an initial test with human subjects under various situations. Meas Sci Technol 19: 105604.
- Wang C, Scherrer ST, Hossain D (2004) Measurements of cavity ringdown spectroscopy of acetone in the ultraviolet and near-infrared spectral regions: potential for development of a breath analyzer. Appl Spectrosc 58: 784-791.
- Wang C, Mbi A, Shepherd M (2010) A study on breath acetone in diabetic patients using a CRD breath analyzer: exploring correlations of breath acetone with blood glucose and glycohemoglobin A1C. IEEE Sensors J 10: 54-63.
- Wang C, Mbi A (2007) A new acetone detection device using cavity ringdown spectroscopy at 266 nm: evaluation of the instrument performance using acetone sample solutions. Measurement Science and Technology 18: 2731-2741.
- Wang Z, Wang C, Lathan P (2014) Breath acetone analysis of diabetic dogs using a cavity ringdown breath analyzer. IEEE Sensors J 14: 1117-1123.
- Wang C, Sahay P (2009) Breath analysis using laser spectroscopic techniques: breath biomarkers, spectral fingerprints, and detection limits. Sensors (Basel) 9: 8230-8262.
- USEPA (1999) Compendium of methods for the determination of toxic organic compounds in ambient air Compendium of Method TO-15. EPA/625/R-96/010b Washington DC.
- Cho AK, Lindeke B, Hodshon BJ, Jenden DJ (1973) Deuterium substituted amphetamine as an internal standard in a gas chromatographic-mass spectrometric (GC-MS) assay for amphetamine. Anal Chem 45: 570-574.
- Talrose V, Stern EB, Goncharova AA, Messineva NA, Trusova NV, et al. UV/Visible Spectra. In: NIST Chemistry WebBook, NIST Standard Reference Database Number 69, National Institute of Standards and Technology, Gaithersburg MD, 20899.
- Sahay P, Scherrer ST, Wang C (2013) Measurements of the weak UV absorptions of isoprene and acetone at 261-275 nm using cavity ringdown spectroscopy for evaluation of a potential portable ringdown breath analyzer. Sensors (Basel) 13: 8170-8187.
- Ghimenti S, Tabucchi S, Lomonaco T, Di Francesco F, Fuoco R, et al. (2013) Monitoring breath during oral glucose tolerance tests. J Breath Res 7: 017115.
- Mochalski P, King J, Unterkofler K, Amann A (2013) Stability of selected volatile breath constituents in Tedlar, Kynar and Flexfilm sampling bags. Analyst 138: 1405-1418.
- Steeghs MM, Cristescu SM, Harren FJ (2007) The suitability of Tedlar bags for breath sampling in medical diagnostic research. Physiol Meas 28: 73-84.
- Miekisch W, Kischkel S, Sawacki A, Liebau T, Mieth M, et al. (2008) Impact of sampling procedures on the results of breath analysis. J Breath Res 2: 026007.
- Beauchamp J, Herbig J, Gutmann R, Hansel A (2008) On the use of Tedlar® bags for breath-gas sampling and analysis. J Breath Res 2: 046001.
Relevant Topics
Recommended Journals
Article Tools
Article Usage
- Total views: 18130
- [From(publication date):
specialissue-2015 - Jul 09, 2025] - Breakdown by view type
- HTML page views : 13357
- PDF downloads : 4773

