Research Article Open Access
A Phenomenon Discovered While Imaging Dolphin Echolocation Sounds
Jack Kassewitz1*, Michael T Hyson2, John S Reid3 and Regina L Barrera4
1The Speak Dolphin Project, Global Heart, Inc., Miami, Florida, USA
2Sirius Institute, Puna, Hawaii
- Corresponding Author:
- Jack Kassewitz
Speak Dolphin, 7980 SW 157 Street
Palmetto Bay, FL 33157, USA
Tel: 1 (305) 807-5812
E-mail: research@speakdolphin.com
Received Date: June 06, 2016; Accepted Date: July 04, 2016; Published Date: July 15, 2016
Citation: Kassewitz J, Hyson MT, Reid JS, Barrera RL (2016) A Phenomenon Discovered While Imaging Dolphin Echolocation Sounds. J Marine Sci Res Dev 6:202. doi:10.4172/2155-9910.1000202
Copyright: © 2016 Kassewitz J, et al. This is an open-access article distributed under the terms of the Creative Commons Attribution License, which permits unrestricted use, distribution, and reproduction in any medium, provided the original author and source are credited.
Visit for more related articles at Journal of Marine Science: Research & Development
Abstract
Our overall goal is to analyze dolphin sounds to determine if dolphins utilize language or perhaps pictorial information in their complex whistles and clicks. We have recently discovered a novel phenomenon in images derived from digital recordings of the sounds of dolphins echolocating on submerged objects. Hydrophone recordings of dolphin echolocation sounds were input to a CymaScope, an analog instrument in which a water-filled, fusedquartz cell is acoustically excited in the vertical axis by a voice coil motor directly coupled to the cell. The resulting wave patterns were recorded with a digital video camera. We observed the formation of transient wave patterns in some of the digital video frames that clearly matched the shapes of the objects on which the dolphin echolocated, including a closed cell foam cube, a PVC cross, a plastic flowerpot, and a human subject. As further confirmation of this phenomenon the images were then converted into 3-dimensional computer models. The computer models were made such that the thickness at any given point was proportional to the brightness of a contrast-enhanced image with brighter areas thicker and darker areas thinner. These 3-dimensional virtual models were then printed in photopolymers utilizing a high definition 3D printer.
Keywords
Dolphins; Dolphin echolocation; Hydrophone recordings; CymaScope; Faraday waves; standing waves; 3D printing
Introduction
We demonstrate that dolphin echolocation sound fields, when reflected from objects, contain embedded shape information that can be recovered and imaged by a CymaScope instrument. The recovered images of objects can be displayed both as 2-D images and 3-D printed objects.
Bottlenose dolphins, Tursiops truncatus, use directional, highfrequency broadband clicks, either individually or in “click train” bursts, to echolocate. Each click has a duration of between 50 to 128 microseconds. The highest frequencies our team has documented were approximately 300 kHz while other researchers have recorded frequencies up to 500 kHz emitted by Amazon river dolphins [1]. The clicks allow dolphins to navigate, locate and characterize objects by processing the returning echoes. Echolocation ability or bio-sonar (Sound Navigation and Ranging) is also utilized by other Cetacea, most bats and some humans. Dolphins echolocate on objects, humans, and other life forms both above and below water [2].
The exact biological mechanisms of how dolphins “see” with sound still remains an open question, yet, that they possess such an ability is well established [3]. For example Pack and Herman found that “a bottle nosed dolphin… was … capable of immediately recognizing a variety of complexly shaped objects both within the senses of vision or echolocation and, also, across these two senses. The immediacy of recognition indicated that shape information registers directly in the dolphin’s perception of objects through either vision or echolocation, and that these percepts are readily shared or integrated across the senses. Accuracy of intersensory recognition was nearly errorless regardless of whether the sample objects were presented to the echolocation sense … the visual sense (E-V matching) or the reverse… Overall, the results suggested that what a dolphin “sees” through echolocation is functionally similar to what it sees through vision” [4].
In addition, Herman and Pack showed that “…cross modal recognition of … complexly shaped objects using the senses of echolocation and vision…was errorless or nearly so for 24 of the 25 pairings under both visual to echoic matching (V-E) and echoic to visual matching (E-V). First trial recognition occurred for 20 pairings under V-E and for 24 under E=V… The results support a capacity for direct echoic perception of object shape… and demonstrate that prior object exposure is not required for spontaneous cross-modal recognition” [4].
Winthrop Kellog was the first to study dolphin echolocation in depth and found their sonic abilities remarkable [5]. He discovered that dolphins are able to track objects as small as a single “BB” pellet (approximately 0.177 inch) at a range of 80 feet and negotiate a maze of vertical metal rods in total darkness. A recent study showed that a bottlenose dolphin can echolocate a 3-inch water -filled ball at a range of 584 feet, analogous to detecting a tennis ball almost two football fields away [6].
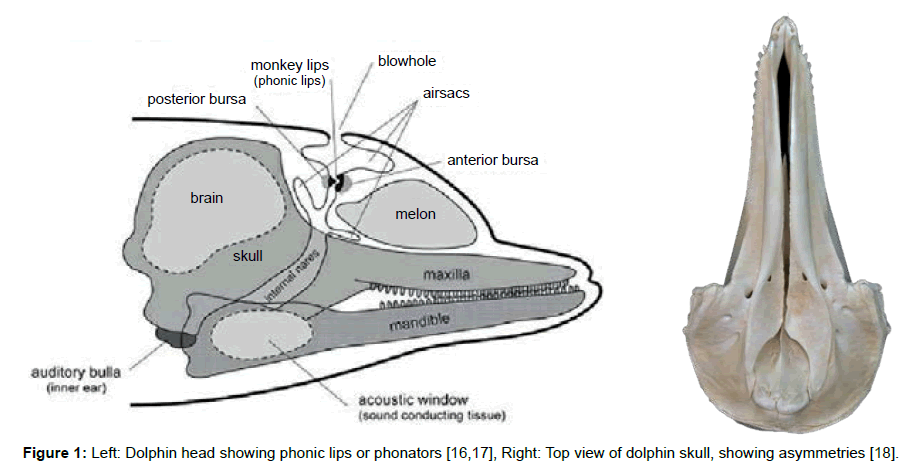
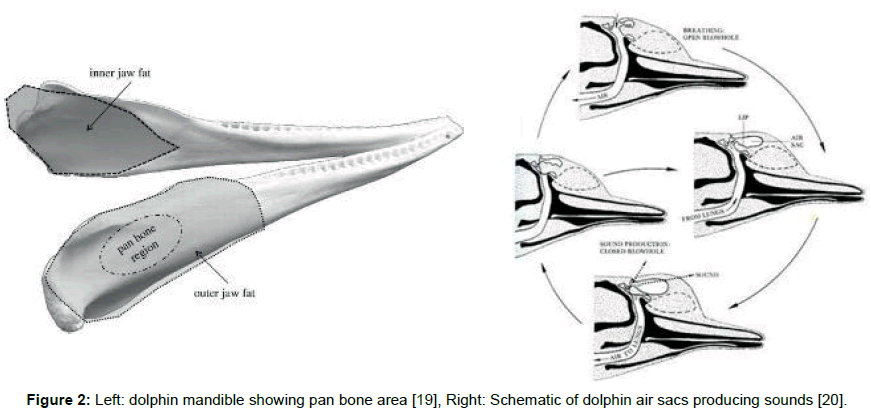
Click trains and whistles cover a spectrum of frequencies in the range 0.2 to 300 kHz and appear to originate from at least two pairs of phonators or phonic lips near the blowhole (Figure 1 left) [7]. The phonic lips are excited by pumping air between air sacs located above and below the phonators (Figure 2 right). The phonators’ positions can be rapidly adjusted by attached muscles [8].
We suggest that these sounds reflect from a compound parabola [9-11] shape formed by the palatine bones. A compound parabola would ensure equal beam intensity across the output aperture. The now collimated sound is emitted from the dolphin’s melon, which is made up of several types of adipose tissue [12]. The melon is thought to be an acoustic lens with a variable refractive index. Thus, higher frequency sounds will be deflected to higher azimuths so that the dolphin may interpret the frequency of the returning echoes as an azimuth angle.
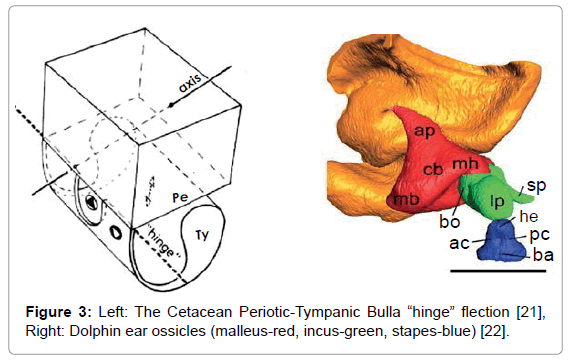
The resulting sonic output reflects from objects in the environment forming echoes that are received and processed by the dolphin. The commonly held view is that the returning echo sounds are received via the lower jaw, passing first through the skin and fat that overlays the pan bones. Two internal fat bodies that are in contact with the pan bones act as wave guides [13,14] conducting the sounds to the tympanic bullae (Figure 2, Left) causing a thin part of each bulla to flex like a hinge (Figure 3, Left). This transmits sound by way of the ossicles (Figure 3, Right) to the cochleae.
As with stereoscopic visual perception in humans, due to the separation of the eyes on the head, the separation of the left and right fat bodies and tympanic bullae may allow dolphins to process sonic inputs binaurally. Different times of arrival (or phase) from the left and right may allow the dolphin to determine the direction of incoming sounds [15-21].
Conjecture has surrounded the issue of whether the tympanic membrane and the malleus, incus, and stapes are functional in dolphins. A prevalent view is that the tympanic membrane lacks function and that the middle ear ossicles are “calcified” in dolphins and therefore lack function [22]. However, according to Gerald Fleischer (Figure 3), while the dolphin ossicle chain may appear calcified, this stiffness actually matches the impedance of the tympanic bullae and ossicles with the density of water. A thin part of each tympanic bulla, with density approximating granite, responds to sounds by flexing. This flexion is tightly coupled to the ossicles that have evolved their shapes, lever arm moments and stiffness to respond to acoustic signals in water (about 800 times denser than air) with a minimal loss of acoustic energy. The flexion can occur even if the tympanic membrane lacks function. Significant rigidity is required in this system; for example, the stapes in the dolphin has compliance comparable to a Boeing 747 landing gear [23].
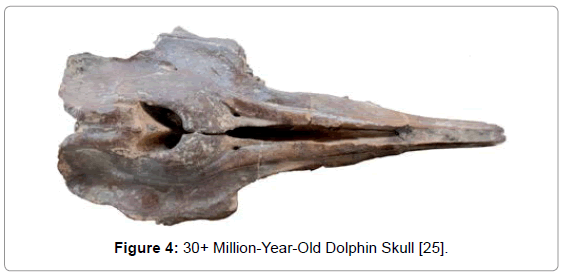
Fleischer also suggests that the left/right asymmetry of the skull (Figure 1, Right) and the “break” in the zygomatic arches of echolocating Cetacea is necessary to prevent coupling of resonances from both sides of the skull that would reduce the acoustic isolation of the bullae. In fact, one can determine from fossils if an extinct species echolocated by examining the zygomatic arch (Figure 4).
Given that the fat bodies in the mandible contact the tympanic bullae, there is a path by which returning echoes flex the tympanic bullae and provide input to the ossicle chain. Thus the apparent contradictions of the work of Fleischer, Norris and Ketten can be resolved since both the fat bodies of the mandible as well as other external sounds flex the tympanic bullae relative to the periotic bone. Sounds from either the fat bodies or the tympanic bullae couple to the ossicle chain and conduct sounds to the dolphin’s cochleae.
The sensory hair cells along the cochleae’s Organ of Corti are stimulated at different positions that depend on a sound’s frequency, thus translating frequency to position according to the Von Bekesy traveling wave theory [24]. Interesting work by Bell suggests a model in which each hair cell is a complex harmonic oscillator [25-28].
Neural signals from the hair cells are transferred to the brain via the acoustic nerve, which is 3 times larger in dolphins than in humans. The acoustic nerves ultimately project to the brain’s acoustic cortex with a tonotopic mapping wherein specific frequencies excite specific locations. The auditory cortex of the dolphin brain is highly developed and allows hearing across a bandwidth approximately 10 times wider than that of a human. The dolphin brain then interprets these data.
Dolphins can also control the direction of their echolocation sounds. Lilly showed how dolphins use phase to steer their sound beams [29]. Microphones were placed on either side of the blowhole of a dolphin. At times only one microphone picked up sound while the other showed zero signal, suggesting that the dolphin was making at least two sounds; sounds to the left were cancelled out, while sounds to the right were reinforced, and the same result was found when the sides were reversed. Therefore, a dolphin can aim its echolocation beam while its head is stationary.
To place this work in a larger context, we note that dolphins recognize themselves in mirrors [30-33], which show they are selfaware. Wayne Batteau taught dolphins to recognize 40 spoken Hawaiian words [34,35] and John C Lilly taught dolphins to imitate English [36]. Louis Herman found that dolphins can recognize approximately 300 hand signs in 2000 combinations [37]. Dolphins perform better at language tasks than any other creature with the exception of humans.
Research by Markov and Ostrovskaya [38] found the 4 dolphin phonators are under exquisite and separate control [39]. A dolphin can make at least 4 simultaneous sounds that are all unique. From examining around 300,000 vocalizations, they conclude that dolphins have their own language with up to a trillion (1012) possible “words” whereas English has only 106 words.
They also found that dolphin communication sounds follow Zipf’s laws [40] by which the number of short utterances exceeds long utterances in the ratio 1/f. Markov and Ostrovskaya consider this proof that dolphin sounds carry linguistic information since all other languages and computer codes so far tested also show a 1/f relationship with symbol length [41].
Equipment and Methods
To investigate the bio-sonar and communication system of the bottlenose dolphin, Tursiops truncatus, we trained dolphins to echolocate on various objects at a range of 2 to 6 feet. The sounds of dolphins were recorded while they echolocated on submerged objects, including a closed cell foam cube, a PVC cross, a plastic flowerpot, and a human subject. Searching for ways to visualize the information in the recordings, we used a recently developed CymaScope, which has three imaging modules covering different parts of the audio spectrum. The highest frequency imaging module operates by sonically exciting medical-grade water [42] in an 11 mm diameter fused quartz visualizing cell by means of a voice coil motor. The dolphin recordings were input into the CymaScope’s voice coil motor and the water in the visualizing cell transposed the echolocation sounds to 2-D images.
Hydrophones
We utilized a calibrated matched pair of Model 8178-7 hydrophones with a frequency response from 20 Hz to 200 kHz. Their spatial response is omnidirectional in orthogonal planes with minor nulling along an axis looking up the cable. The hydrophone calibration curves show a flat frequency response down to 20 Hz at -168.5 dB re 1 v/uPa. The response from 2 kHz to 10 kHz is -168.5 dB, after which the response rolls off gradually. From 80 kHz to 140 kHz, the sensitivity falls to -174 dB, after which the sensitivity climbs again to -170 dB at 180 kHz. Above 200 kHz, the response rolls off gradually out to 250 kHz, which then drops rather sharply at approximately -12 dB per octave. The pair of hydrophones utilized 45-foot underwater cables with four conductors inside a metalized shield and powered by two 9 volt batteries.
Hydrophone signal processing
The signal from the hydrophones was passed to a Grace Lunatec V3 microphone preamp, a wideband FET preamplifier with an ultra-low distortion 24-bit A/D converter. The preamplifier offers the following sample rates: 44.1, 48, 88.2, 96, 176.4 and 192 kHz. A band pass filter attenuated signals at and below 15 Hz to reduce noise. In addition, we utilized a power supply filter, and power input protective circuits. The pre-amplified and filtered signal was sent to an amplifier enclosed in a metal EMI enclosure and encapsulated in a PVC plastic assembly. For our recordings, sampling rates were set at 192 kHz. A solid copper grounding rod was laid in seawater. We measured 25 ohms or less with the ground rod installed, thus minimizing noise.
Recording
The echolocation sounds for the plastic cube, cross, and flowerpot were recorded with one channel of a Sound Device 722 high-definition two-channel digital audio recorder. The Sound Device recorder writes and reads uncompressed PCM audio at 16 or 24 bits with sample rates in the range 32 kHz to 192 kHz. The 722 implements a non-compressed audio format that includes Sound Devices’ microphone preamplifiers designed for high bandwidth and high bit rate digital recording with linear frequency response, low distortion, and low noise. For recording the echoes from the plastic objects the sample rate was set to 192 kHz.
The echolocation sounds for the human subject were recorded with a SM3BAT, which can sample in the range 1 kHz to 384 kHz on a single channel and up to 256 kHz with two channels. The sampling rate was set to 96 kHz to better match the narrow frequency response range of the CymaScope. Audio data was stored on an internal hard drive, Compact Flash cards, or external FireWire Drives.
Recording dolphin object echolocation sounds
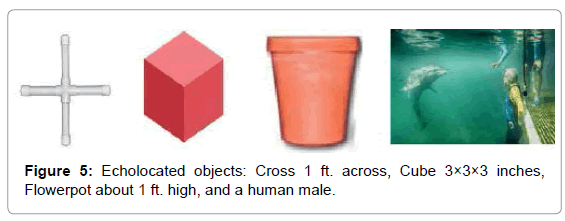
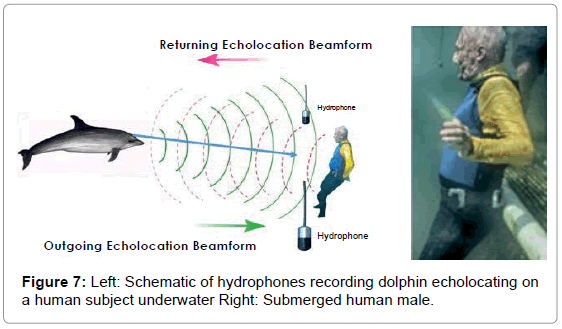
Dolphins were trained to echolocate on various objects on cue. We recorded a dolphin’s echolocation sounds and the echoes reflected from a PVC plastic cross, a closed cell foam cube, a plastic flowerpot, and an adult male human subject under water. The signals from the cross, cube and flowerpot were recorded as single monaural tracks from one hydrophone approximately 3 feet in front of the object and about 3 feet to the side, while the dolphin was 1-2 feet from the target. The recording for the submerged, breath-holding human subject utilized two tracks from two hydrophones on the left and right of the subject about 3 feet in front of the human and about 6 feet apart (Figure 5).
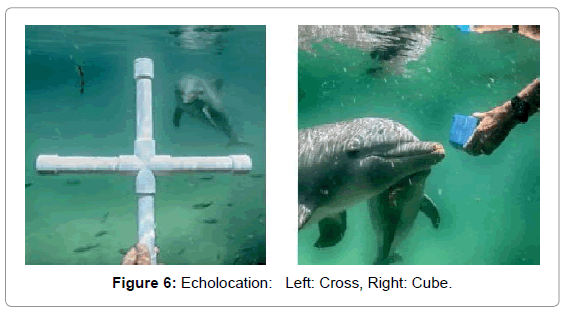
We chose these objects because they were novel shapes to the dolphin and had relatively simple geometries. Once we determined that images of these shapes appeared in CymaGlyphs, we wanted to see if the imaging effect would occur with the more complex shape of a human body (Figure 6).
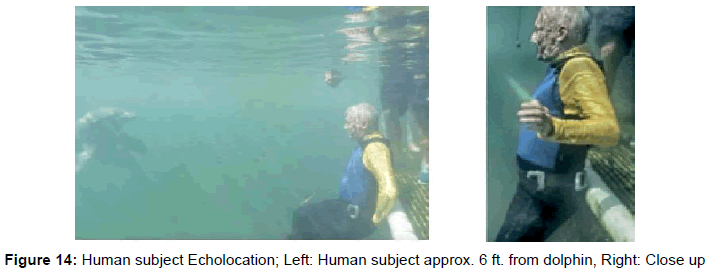
The average distance from dolphin to submerged object was between 1 and 2 feet and approximately a 6-foot range when echolocating the human male (Figure 7).
Environmental conditions
During the experiments the water was clear and calm and about ten feet in depth. We might expect that there would be multipath echoes from the surface of the water and the bottom. We have yet to see evidence of this in our recordings. Perhaps the fact that the dolphin was at a range of 1-2 feet from the objects being echolocated eliminated such effects. For the echolocation on the submerged human subject at a range of about 6 feet we also failed to see evidence of any multipath effects.
Visualizing dolphin echolocation sounds
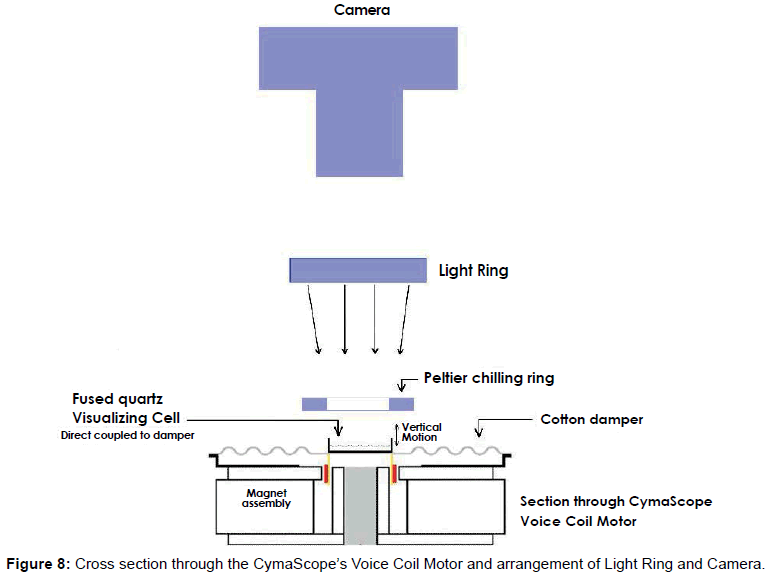
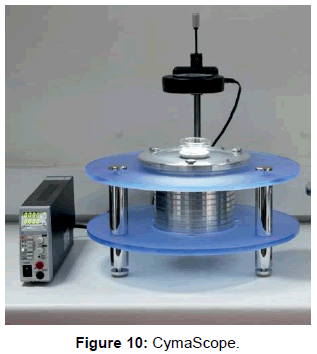
We utilized various conventional methods to represent the dolphin echolocation sounds including oscillographs and FFT sonograms, which display data graphically. We also utilized a CymaScope instrument to provide a pictorial mode of display. The CymaScope’s highest frequency imaging module transposes sonic input signals to water wavelet patterns by exciting a circular cell 11 mm in diameter which contains 310 micro liters of water, by means of a voice coil motor direct-coupled to the cell (Figure 8). Images recorded from the CymaScope are called “CymaGlyphs.” The resulting wave patterns in the visualizing cell were captured from the objects’ echo.wav files as still photographs and as video recordings for the male human test subject’s echo.wav file.
Utilizing recordings of dolphin sounds as inputs to the CymaScope we discovered 2-D images that clearly resembled the objects being echolocated. To further investigate the images, we converted them to 3-D models using 3D print technology. As far as we know, this is the first time that such methods have been employed to investigate dolphin echolocation signals.
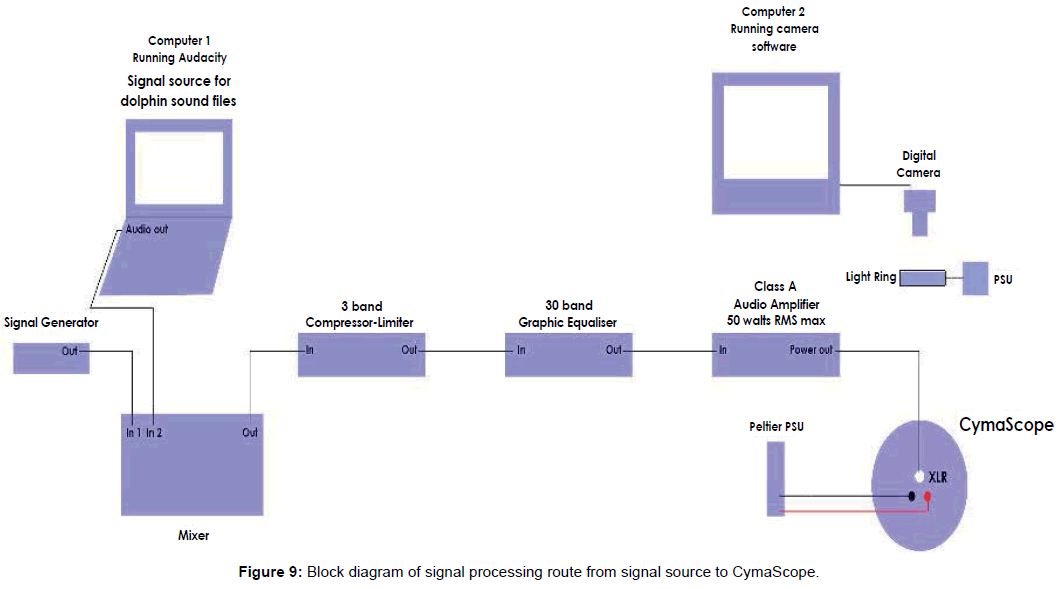
Digital dolphin sound files were supplied to Reid for experimentation in the UK via email attachments. The audio signal was first equalized utilizing a Klark Teknik 30-band graphic equalizer with the 5 kHz band boosted to +12 dB. All bands above 5 kHz were minimized to -12 dB, creating a 24 dB differential between the 5 kHz band and signals above that frequency. Bands below 5 kHz, down to 800 Hz, were also boosted to +12 dB. Bands below 800 Hz were minimized.
The equalized signal was then sent to an Inter-M model QD4240 amplifier with a frequency response of 20 Hz - 20 kHz, THD: <0.1%, over 20 Hz - 20 kHz; 60 watts RMS per channel; a single channel was used creating a sound pressure level of 100 dB at the voice coil motor. Figure 9 shows a block diagram of the signal processing equipment.
The optimum (center) frequency response of the CymaScope is 1840 Hz while the instrument’s upper limit is 5 kHz. Thus, at its current stage of development the CymaScope responds to a small band of frequencies in the dolphin recordings, however, future development of the instrument is expected to broaden its frequency response.
The resulting wave patterns on the water’s surface were photographed and/or captured on video with a Canon E0S 7D cameras with a Canon 100 mm macro lens set at f 5.6 and 5500 K white balance. The raw resolution for stills and video is 1920 × 1080 pixels, at a frame rate of 24 fps with a shutter speed 1/30th second. An L.E.D. light ring mounted horizontally above and coaxial with the visualizing cell provided illumination (Figure 10).
The wav sound files sent to Reid were only labeled with letters and numbers and he had no prior knowledge of what each file contained or which files contained echolocations, if any. Therefore, Reid performed the analyses on the CymaScope “blindly” and in all cases, only the sound files containing object echolocations showed images.
The sound file containing the “male human subject” was input to the CymaScope and the resulting transient wave impressions on the water were captured at 24 frames per second and compressed to a QuickTime video file. Our initial investigations indicate that the image occurs at or after 19.6 seconds in the sound file and before 20 seconds. The Canon 7D camera can have a variable audio sync slippage of 0 to 3 video frames, thus we can only localize the image within the video to a 6 frame region. In addition, the water in the cell has a hysteresis effect in that it takes a finite amount of time for the water molecules to be imprinted by the input signal; we have yet to measure this time delay, which is likely to vary with frequency. We hypothesize that there is a potential image frame for each dolphin click. One interesting aspect is that the orientations of the images occurred at various angles and were then adjusted to an upright orientation post shooting; however, the “human” image is presented in its original orientation.
Results
We discovered transient wave patterns in the water cell that were strikingly similar in shape to the objects being echolocated. To further investigate the shapes in these Cyma Glyphs we converted the images to 3-D models. As far as we know, this the first time such a method has been implemented.
Transient wave images were found for the cube, cross, flowerpot and a human by examining single still frames, or single frames acquired in bursts, usually where there was high power and dense click trains in the recording. The parameters involved in capturing echolocation images with the CymaScope include careful control of the acoustic energy entering the visualizing cell. Water requires a narrow acceptable “power window” of acoustic energy; too little energy results in no image formation and too much energy results in water being launched from the cell. As a result, many hours of work were involved in capturing the still images of the echolocated objects. The imagery for the human subject was captured in video mode and has been approximately located in time code. The image formed between 19.6 to 20 seconds into the recording and may derive from a set of dense clicks at approximately 20 seconds. The video was shot at 24 frames/second with a possible audio synchronization error of plus or minus 3 frames.
Further, to maximize the coupling of the input sound to the water in the cell, the original recording was slowed by 10%, as well as being heavily equalized in order to boost the high frequency acoustic energy entering the visualizing cell. This signal processing may have introduced phase changes. In addition, there is some hysteresis, yet to be measured, because of the mass and latency and compliance of the voice coil motor, as well as the mass and latency of the water in the visualizing cell. We have yet to measure these time delays, which are likely to vary with frequency.
We note that the waveform of the equalized and slowed signal appears substantially different than the original recording, further complicating the matching of the sounds to the image. Therefore, the time of occurrence and the signals forming the images are only approximately known at this time. We are replicating our results and will have more accurate data in the future.
Object echolocation results
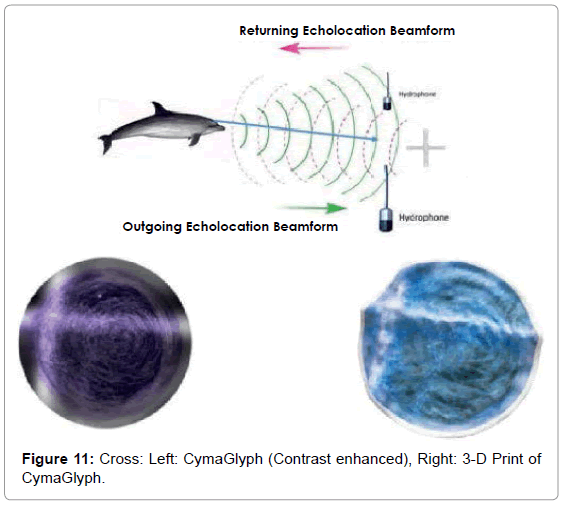
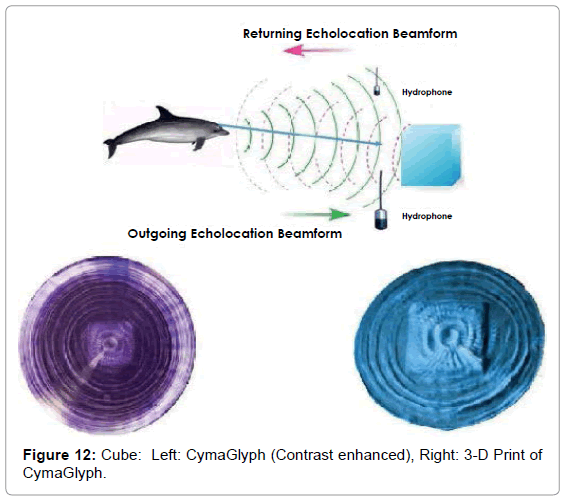
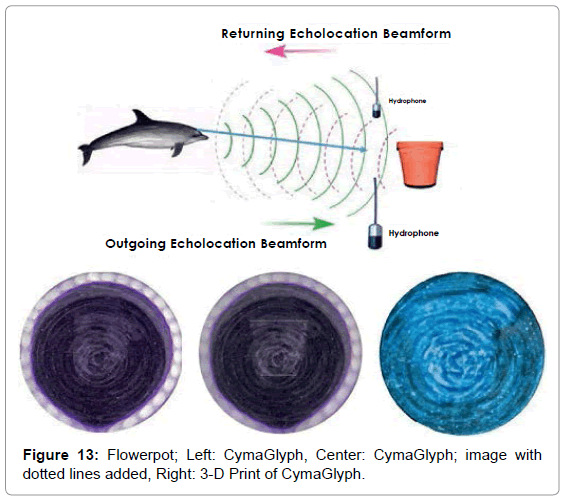
The Figures that follow show our main results. We display results for echolocations on a cross (Figure 11), a cube (Figure 12), and a flowerpot (Figure 13). Each figure shows a schematic of the dolphin, object, and hydrophone positions, followed by the CymaGlyph image recorded for each object as well as a 3-D print of the image.
• Figure 14 shows a human subject underwater.
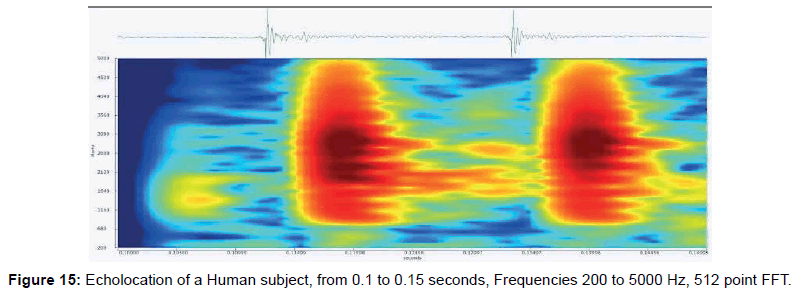
• Figure 15 shows an FFT of sounds recorded for two clicks near where the human image formed.
• Figure 16 shows left and right tracks recorded near the time of image formation. Note that the tracks are quite different and indicates that sound cancellation with multiple sound sources may be involved.
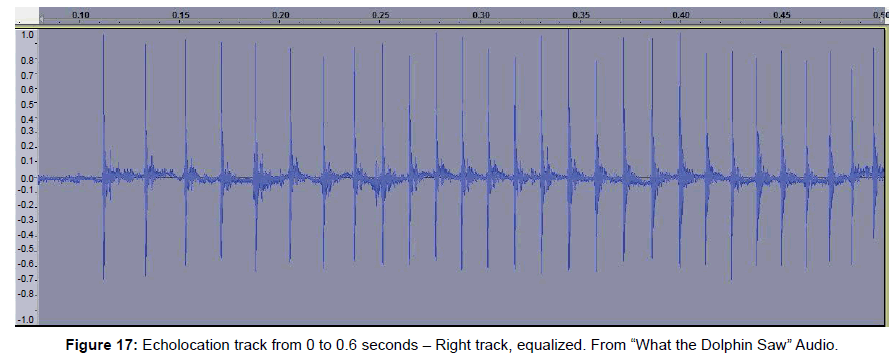
• Figure 17 is a portion of the signal driving the CymaScope near the time of image formation.
• Figure 18’s Left frame shows the CymaScope recording just before the formation of an image of the human subject; while the Center frame shows the human subject’s raw image, and the Right frame shows the image with selected areas’ contrast enhanced to emphasize the human body shape. Overall contrast was first increased; then further contrast increases were made by selecting areas and increasing their contrast.
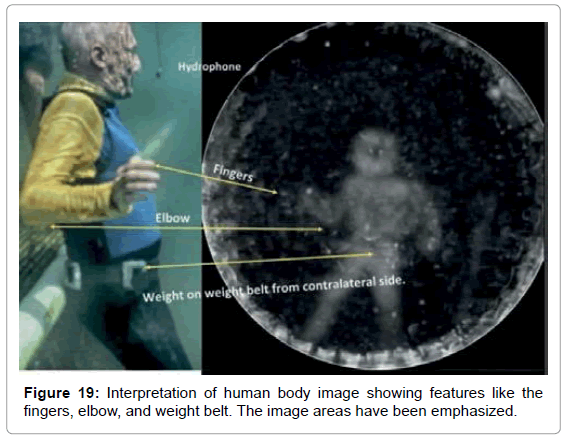
• Figure 19 shows an analysis of the features of the human body image.
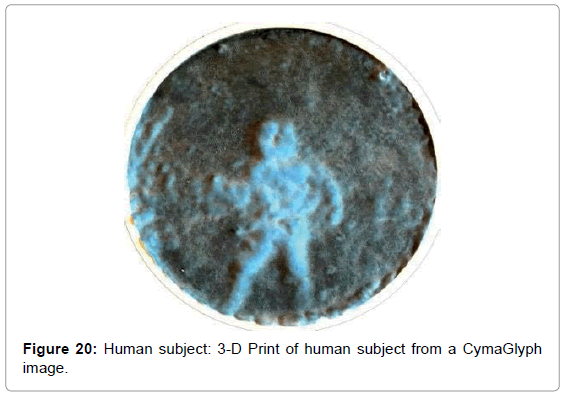
• Figure 20 is a 3D print of this human image.
Cross: A cross-shaped object made of PVC pipe was echolocated by a dolphin at a range of 1-2 feet and recorded with a matched pair of hydrophones with a sample rate of 192 kHz with 16-bit precision.
Cube: A cube-shaped object made from blue plastic closed-cell foam, was echolocated by a dolphin at a range of 1-2 feet and recorded with a matched pair of hydrophones with a sample rate of 192 kHz with 16-bit precision.
Flowerpot: A flowerpot-shaped object made of plastic was echolocated by a dolphin at a range of 1-2 feet and recorded with a matched pair of hydrophones with a sample rate of 192 kHz with 16- bit precision.
Finding echoes
Adult human physical body part dimensions (Table 1) range from 10-180 cm, with corresponding scattering frequencies, in seawater, from 833 Hz to 15 kHz. Note that the finer features are above 5000 Hz, so for the CymaScope to see such detail, we assume that a mechanism exists in which these details are coded in time. The following table indicates the frequencies of echoes expected for different body parts as calculated by John Kroeker.
| Human dimensions | cm | Frequency | delta in ms |
|---|---|---|---|
| head | 15 | 10200 | 0.098 |
| arm width | 10 | 15300 | 0.065 |
| leg width | 18 | 8500 | 0.118 |
| torso width | 33 | 4636 | 0.216 |
| leg spacing at knees | 40 | 3825 | 0.261 |
| arm length | 60 | 2550 | 0.392 |
| leg length | 80 | 1913 | 0.523 |
| torso length | 60 | 2550 | 0.392 |
| arm spacing | 90 | 1700 | 0.588 |
| Total Height | 180 | 833 | 1.176 |
Table 1: Human body feature sizes and echo delays.
Discussion
We report the discovery that by utilizing dolphin echolocation sounds to vibrate a cell containing water, in a CymaScope instrument, we found that the shapes of submerged objects being echolocated by a dolphin appeared transiently as wave patterns in the water-containing cell. We found clear images of a PVC cross, a foam cube, a plastic flowerpot and a submerged male test subject.
We converted some of the images into 3-D printed objects where thickness was proportional to brightness of the image at each point. This both confirmed the initial results and offered new perspectives and ways to hapticly explore these shapes.
Understanding the mechanism by which the transient images occur will be the subject of future research. Detailed mathematical understanding and modeling of these waves is complex and mathematical techniques have yet to be developed that can model Faraday Wave events beyond simple geometries. As far as we can determine, this is the first time such a phenomenon has been observed, namely, that dolphin echolocation sounds, imaged by a CymaScope, result in transient wave patterns that are substantially the same as the objects being echolocated.
The ripple patterns that had been previously observed with the CymaScope had typically been highly symmetrical and reminiscent of mandalas, varying with the frequency as well as harmonic structures and amplitude of the input signal, whereas the images of objects formed by echolocation are atypical.
Michael Faraday studied patterns that he termed “crispations” on the surface of liquids, including alcohol, oil of turpentine, white of egg, ink and water. These patterns included various geometric forms and historically have become known as Faraday waves.
“Parametrically driven surface waves (also known as Faraday waves) appear on the free surface of a fluid layer which is periodically vibrated in the direction normal to the surface at rest. Above a certain critical value of the driving amplitude, the planar surface becomes unstable to a pattern of standing waves. If the viscosity of the fluid is large, the bifurcating wave pattern consists of parallel stripes. At lower viscosity, patterns of square symmetry are observed in the capillary regime (large frequencies). At lower frequencies (the mixed gravitycapillary regime), hexagonal, eight-fold, and ten-fold patterns have been observed. These patterns have been simulated with the application of complex hydrodynamic equations. These equations are highly nonlinear and to achieve a match with observed patterns one needs high order damping factors and fine adjustment of various variables in the models” [43].
It is most surprising that features such as straight lines, for example, forming the bas-relief image of a cube, or especially, the rough image of a human body, form when the input signal to the CymaScope is a recording of dolphin echolocations on these objects. The formation of patterns as complex as the image of an object, such as we report here, are well beyond the capabilities of current Faraday wave models. Therefore, we have yet to determine exactly how these images form. In one sense we consider the CymaScope a type of analog computer that embodies in its characteristics the complex math required for image formation.
We are interested in understanding how spatial information arises from a one-dimensional time series since, in these experiments, the input to the CymaScope was a series of amplitudes over time, containing no apparent shape or spatial information. Perhaps complex interactions of the vibrating water form patterns in response to the later incoming signals, in which the phase of the signals plays an important part. Related to the matter of spatial information is the degree of detail that we obtained in the images, particularly that of the submerged human test subject in which his weight belt and other small features are discernible, albeit at low resolution. The frequency response of the CymaScope is from about 125 Hz to 5 kHz with a peak response at 1840 kHz. Therefore, the formation of the fine details in the imagery must be spread through time in some manner. A natural time base exists in the visualizing cell in that it takes a finite amount of time for a ripple to travel from the cell’s central axis to the circular boundary, which is a function of the frequency of the injected signal. This hysteresis in the water mass can be thought of as a type of memory, whereby existing waves in the water interact with later signals. Perhaps the finer details in the images are the result of complex interactions among these parameters.
We note that the image of the human body is flipped left to right, as an apparent mirror image. Why this occurs has yet to be determined. Also, what determines the orientation of the images in the instrument’s visualizing cell, which is radially symmetric has yet to be determined. In the case of the cube and the human subject, the images are “right side up” which is curious and perhaps coincidental. We will investigate this further and plan to conduct experiments with synthetic signals to determine if images form when high frequency sound pulses are reflected from objects in a laboratory setting and input to the CymaScope.
We have yet to arrive at a hypothesis for the mechanism that underpins this newly discovered phenomenon. An obvious question that occurred to us is whether these results are a form of pareidolia, that is, the tendency for people to see familiar shapes such as faces, even in random patterns such as clouds. However, based on the circumstances, this cannot be the case. Each shape was found even when only one file in several sent to Reid contained the echolocation shape data. In addition, Reid had no knowledge of what shapes were potentially to be found in the sound files. This is a strong argument against any form of pareidolia given that the crude outline of the flowerpot even shows a faint outline of the hand that held it and, in the image of the male test subject, his weight belt and even some of his fingers were evident.
Examining dolphin head movements may provide insights into how dolphins aim their sounds and scan objects. We intend to measure head position and movement in future studies as well as varying the dolphin’s range from the targets. Also, since dolphins can make up to four and possibly five different sounds simultaneously, we are considering making multi-hydrophone recordings to better analyze the sounds. In examining the left and right stereo tracks of the echolocation on the human test subject, for example, we found considerable differences between the left and right tracks, suggesting that the dolphins are employing sound cancellation techniques. For example, click trains on the right channel may fail to appear on the left (Figure 16).
The implications of the present study for dolphin perception are significant. It may be that dolphins and other Cetacea process auditory information to create a perceived world analogous to human visual perception. Dolphins possess large acoustic nerves that contain approximately as many fibers as human optic nerves. Their auditory cortex is larger than humans’ and their brain is larger. It is plausible that dolphins experience an auditory perceptual world that is as rich as our human visual experience. In the same way we humans enjoy a totally integrated world as we run across a field or as a bat is finely coordinated while catching two fruit flies in half a second diving through the branches of a tree, so too, the dolphin likely integrates sound, vision, touch, taste etc. into a complete gestalt.
We suggest that they are integrating sonar and acoustic data with their visual system so that their sonar inputs are interpreted, in part, as images. This concept is supported by extant studies. A corollary of this concept is that dolphins may create sonic shapes with their sounds that are projected to other dolphins as part of their communication. We intend further studies to determine if such a communication system exists.
Recent brain tract maps in the dolphin brain show possible neural connections between cortical regions A1 and V1. This suggests both auditory and visual areas of the brain participate in the interpretation of auditory information [44]. Other studies show similar functioning in humans and support the concept of similar cross-modality linking in dolphins.
There are humans who can detect objects in their environment by listening for reflected echoes. Tapping their canes, stomping their foot, snapping their fingers, or making clicking noises provide the means to create echoes. “It is similar in principle to active sonar and to animal echolocation, which is employed by bats, dolphins and toothed whales to find prey” [45]. While humans’ visual cortex lacks known inputs from other sensory modalities, in blind subjects it is active during auditory or tactile tasks.
“Braille readers blinded in early life showed activation of primary and secondary visual cortical areas during tactile tasks, whereas normal controls showed deactivation, thus in blind subjects, cortical areas normally reserved for vision may be activated by other sensory modalities” [46].
Blind subjects perceive complex, detailed, information about the nature and arrangement of objects [47].
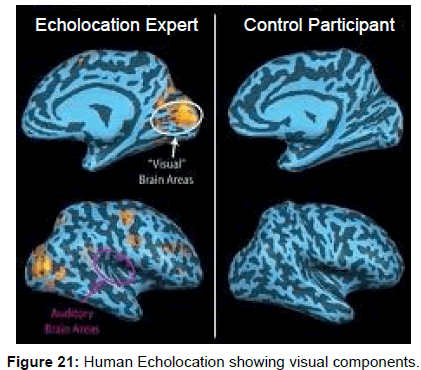
“Some blind people showed activity in brain areas that normally process visual information in sighted people, primarily primary visual cortex or V1… when the experiment was carried out with sighted people who did not echolocate… there was no echo-related activity anywhere in the brain” [48].
Further evidence of visual areas of the human brain being involved with audition comes from functional fMRI’s in blind echolocating humans that showed simultaneous activity in both acoustic and visual areas of the brain [49,50] (Figure 21).
Pitch perception shows a visual component [51]. Patel reports on the work of Satori who used fMRI to image human volunteers attempting to use pitch perception to identify paired short melodies. Satori observed surprising neural activation outside the auditory cortex. Relative pitch tasks showed increased activity in the infraparietal sulcus, an area of visuospatial processing. In recent research into spatiality in relative pitch perception in humans, functional fMRI studies show visual areas of the brain being activated as part of the perception of simple sound phrases that are rising and declining in pitch.
From these and other studies, we conclude that since mammal, human and dolphin brains are similar, and, given that many humans experience a visual component to their echolocation, it seems more than speculation that dolphins have developed similar perceptions that combine the auditory and visual areas of their brain.
Conclusions
Dolphin echolocation sounds recorded while echolocating various objects and a human subject, were input to a CymaScope instrument. We discovered that patterns arose that closely matched the shape of objects and a human subject being echolocated. These results are beyond current Faraday wave modeling techniques and will require further research to determine how such wave patterns occur.
Understanding this phenomenon offers the possibility of improved sonar and sonar displays and offers the potential for gaining further insights into the process by which dolphins echolocate and communicate. We intend to replicate and extend our experiments to clarify issues arising from this discovery.
Dedication
We dedicate this paper to the Cetacea, dolphins and whales and, to our colleagues in this work and who continue to inspire us: Dr. John C. Lilly, M.D., Dr. Henry (Hank) M. Truby, Ph.D., Star Newland, Carol Ely, Dr. Jesse White, DVM and Lewis Brewer.
Acknowledgements
We acknowledge our Science Advisory Board: V. S. Ramachandran M.D., Ph.D., Suzanne Thigpen, M.D., John Kroeker, Ph.D., Mark Owens, Ph.D., Charles Crawford, D.V.M., Jason Chatfield, D.V.M. and Elizabeth A. Rauscher, Ph.D. We thank William H. Lange for his assistance, 3D Systems for their support of 3D printing our objects and Michael Watchulonis for his work to document this discovery, and Annaliese Reid for her work in editing this paper. The work of Hans Jenny is the underpinning of our discovery and first led me to the idea of making dolphins sounds visible.
My profound appreciation goes out to Dolphin Discovery, Mexico and all their staff, managers, and veterinarians who fully supported our research objectives and always displayed amazing patience. And of course, I must thank the dolphins-Zeus and Amaya.
All the interns with SpeakDolphin.com were remarkable for their hard work and strong belief in Donna’s and my dreams of dolphin communication-Elisabeth Dowell, Regina Lobo, Brandon Cassel, Roger Brown, Donna Carey, Jillian Rutledge, and Jim McDonough.
We must always remember Robert Lingenfelser, who nudged me along and encouraged me to continue this Cymatic investigation.
Additionally, a special thank you to Art by God in Miami and Gene Harris for allowing us to photograph their dolphin fossil used for our asymmetry analysis.
This research was conducted with a grant from Global Heart, Inc. and Speak Dolphin. Jack Kassewitz.
References
- Trone M, Glotin H, Balestriero R, Bonnett DE (2016) Enhanced feature extraction using the Morlet transform on 1 MHz recordi ngs reveals the complex nature of Amazon River dolphin (Iniageoffrensis) clicks, Presentations, Jacksonville, FL, Acoustical Society of America.AcoustSoc Am 138: 1904-2015.
- Jack K, Regina LB, Brandon C, Michelle C, Jim MD, et al. Use of Air-Based Echolocation by A Bottlenose Dolphin (Tursiopstruncatus). Amazon.com.
- Au, Whitlow WL, Fay, Richard R (2000) (Ed.), Hearing by Whales and Dolphins, Springer Handbook of Auditory Research, Summary, Springer Verlagpp: 403.
- Pack AA, Herman LM (1995) Sensory integration in the bottlenosed dolphin: immediate recognition of complex shapes across the senses of echolocation and vision. J AcoustSoc Am 98: 722-733.
- Herman LM, Pack AA, Hoffmann KM (1998) Seeing through sound: dolphins (Tursiopstruncatus) perceive the spatial structure of objects through echolocation. J Comp Psychol. 112: 292-305.
- Winthrop K, Porpoises, Sonar (1965) University of Chicago Press; Third Printing edition.
- Au WW, Benoit BKJ, Kastelein RA (2007) Modeling the detection range of fish by echolocating bottlenose dolphins and harbor porpoises. J AcoustSoc Am 121: 3954-3962.
- Cranford TW, Elsberry WR, Van Bonn WG, Jeffress JA, Chaplin MS, et al. (2011) Ridgway, Observation and analysis of sonar signal generation in the bottlenose dolphin (Tursiopstruncatus): Evidence for two sonar sources. J of Exp Marine Bioand Ecopp: 407.
- TrubyHM (1975) Cpersonal communication with Michael Hyson.
- Fossil Freedom(2016) Solar collector reflector geometry.
- ColinaMJA, Lopez VAF, MachucaMF (2010) Modeling of Direct Solar Radiation in a Compound Parabolic Collector (cPC) with theRay Tracing Technique, Dyna rev facnac minas 77: 163.
- A single parabola forms a beam where the power is greatest at the center and falls off at the periphery. A compound parabola insures that the power density of the beam will have equal power across the output aperture.
- Zahorodny ZP (2007) Ontogeny and Organization of Acoustic Lipids In Mandible Fats of the Bottlenose Dolphin (Tursiopstruncatus), Thesis Department of Biology and Marine Biology, University of North Carolina, Wilmington.
- Whitlow WL Au (2011)TheSonar of Dolphins, Springer pp: 91-94.
- Rauch A (1983) The Behavior of Captive Bottlenose Dolphins (Tursiopstruncatus), Southern Illinois University at Carbondale.
- Cranford TW, Amundin M, Norris KS (1996) Functional morphology and homology in the odontocete nasal complex: implications for sound generation. J Morphol 228: 223-285.
- Jack K, Donna K, Stacey A (2015) Cetacean Skull Comparisons: Osteological Research, Kindle Edition, Open Sci Pub.
- Koopman HN, Zahorodny ZP (2008) Life history constrains biochemical development in the highly specialized odontocete echolocation system. ProcBiolSci 275: 2327-2334.
- Hyson MT (2008) Star Newland, Dolphins, Therapy and Autism, Sirius Institute, Puna, HI.
- Fleischer G(1978) Evolutionary Principles of the Mammalian Middle Ear, Advances in Anatomy, Embryology and Cell Biology, Springer-Verlag, Berlin and Heidelberg GmbH & Co. K.
- Tubelli AA, Zosuls A, Ketten DR, Mountain DC (2014) Elastic modulus of cetacean auditory ossicles. Anat Rec (Hoboken) 297: 892-900.
- Darlene FK (1997) Structure and Function in Whale Ears, Bioacoustics 8:103-135.
- Fleischer G (1973) personal communication to Michael Hyson.
- Art By God60 NE 27th St, Miami, FL 33157, 2016.
- von Bekesy G (1961) Nobel Lecture.
- Bell A (2004) Hearing: travelling wave or resonance? PLoSBiol 2: e337.
- James AB (2005)The Underwater Piano: A Resonance Theory of Cochlear Mechanics, Thesis, The Australian National University.
- Bell A (2010) The cochlea as a graded bank of independent, simultaneously excited resonators: Calculated properties of an apparent “travelling wave”, Proceedings of 20th International Congress on Acoustics, ICA 2010, Sydney, Australia pp: 2327.
- Andrew B (2001)The cochlear amplifier is a surface acoustic wave resonator, PO. Box A348, Australian National University Canberra, ACT 2601, Australia.
- John CL (2015) The Mind of the Dolphin: A Non-Human Intelligence, Consciousness Classics, Gateway Books and Tapes, Nevada City, CA pp: 82.
- Gordon GG, James RA, Daniel JS (2002)The mirror test, In: Marc Bekoff, Colin Allen & Gordon M. Burghardt (eds.), The Cognitive Animal: Empirical and Theoretical Perspectives on Animal Cognition, MIT Press.
- Delfoura FKM (2001) Mirror image processing in three marine mammal species: killer whales (Orcinus orca), false killer whales (Pseudorcacrassidens) and California sea lions (Zalophuscalifornianus), Behavioural Processes pp: 181-190.
- Plotnik JM, de Waal FB, Reiss D (2006) Self-recognition in an Asian elephant. ProcNatlAcadSci U S A 103: 7053-17057.
- Prior H, Schwarz A, Güntürkün O (2008) Mirror-induced behavior in the magpie (Pica pica): evidence of self-recognition.PLoSBiol 6: e202.
- Batteau DW, Markey P (1966) Man/Dolphin Communication, Listening Inc., 6 Garden St., Arlington, MA, Final Report 15 December 1966 - 13 December 1967, Prepared for U.S. Naval Ordinance Test Station, China Lake, CA.
- Kenneth WL, Dolphin Mental Abilities Paper, The Experiment with Puka and Maui
- Herman LM, Richards DG, Wolz JP (1984) Comprehension of sentences by bottlenosed dolphins. Cognition 16: 129-219.
- Vladimir IM, Vera MO, Organisation of Communication System In Tursiopstruncatus Montague, AN Severtsov Institute of Evolutionary Morphology and Ecology of Animals, USSR Academy of Sciences, 33 Leninsky Prospect, Moscow 117071, USSR. From Sensory Abilities of Cetaceans: Laboratory and Field Evidence, Edited by Jeanette A. Thomas and Ronald Kastelein (HarderwijckDolfinarium), NATO ASI Series, Series A: Life sciences pp: 196.
- Cranford(2011)Op. cit., Ted W.
- David MW (1998) Powers, "Applications and explanations of Zipf's law". Association for Computational Linguisticspp: 151-160.
- AnaheimCA (1979) Personal communication to Michael Hyson. “They have a language,” Ken Ito, Yamaha Motors Corporation, Anaheim, CA, in reference to his work with the US Navy on dolphin linguistics.
- Baxter Healthcare (2016) Sterile Water f / Irrigation, USP
- Peilong C, Jorge V (1997) Amplitude equations and pattern selection in Faraday waves, PhysRevLett 79: 2670.
- Berns GS, Cook PF, Foxley S, Jbabdi S, Miller KL, et al. (2015) Diffusion tensor imaging of dolphin brains reveals direct auditory pathway to temporal lobe. ProcBiolSci 282.
- Griffin, Donald R (1959) Echoes of Bats and Men, Anchor Press.
- Sadato N, PascualLA, Grafman J, Ibañez V, Deiber MP, et al. (1996) Activation of the primary visual cortex by Braille reading in blind subjects. Nature 380: 526-528.
- Rosenblum LD, Gordon MS, Jarquin L (2000) Echolocating distance by moving and stationary listeners, Ecol. Psychol 12: 181-206.
- CotzinM, DallenbachKM (1950) "Facial vision:" the role of pitch and loudness in the perception of obstacles by the blind. Am J Psychol 63: 485-515.
- Emily C (2011) Blind people echolocate with visual part of brain, CBC News, 2011.
- Thistle, Alan, Brain Image of Blind Echolocator, Western University, Ontario, Canada.
- Aniruddh DP (2014)Neuroscience News Echolocation Acts as Substitute Sense for Blind People, Neuroscience News. http://neurosciencenews.com/visual-impairment-echolocation-neuroscience-1662/ 54 Aniruddh D. Patel, Music, Language and the Brain, Oxford University Press, Oxford.
Relevant Topics
- Algal Blooms
- Blue Carbon Sequestration
- Brackish Water
- Catfish
- Coral Bleaching
- Coral Reefs
- Deep Sea Fish
- Deep Sea Mining
- Ichthyoplankton
- Mangrove Ecosystem
- Marine Engineering
- Marine Fisheries
- Marine Mammal Research
- Marine Microbiome Analysis
- Marine Pollution
- Marine Reptiles
- Marine Science
- Ocean Currents
- Photoendosymbiosis
- Reef Biology
- Sea Food
- Sea Grass
- Sea Transportation
- Seaweed
Recommended Journals
Article Tools
Article Usage
- Total views: 27415
- [From(publication date):
specialissue-2016 - Jul 13, 2025] - Breakdown by view type
- HTML page views : 26018
- PDF downloads : 1397

