Research Article Open Access
A Novel Approach for Microsensing: Detecting and Identifying Eigenmodes of Sensing Objects
Dan T Nguyen* and Robert A Norwood
College of Optical Sciences, University of Arizona, 1630 E. University Boulevard, Tucson, Arizona 85721, USA
- *Corresponding Author:
- Dan T Nguyen
Research Scientist
College of Optical Sciences University of Arizona
1630 E. University Boulevard
Tucson, Arizona 85721, USA
Tel: 717-531-6618
E-mail: dnguyen@optics.arizona.edu
Received Date: April 08, 2014; Accepted Date: May 02, 2014; Published Date: May 06, 2014
Citation: Nguyen DT, Norwood RA (2014) A Novel Approach for Microsensing:Detecting and Identifying Eigenmodes of Sensing Objects. J Anal Bioanal Tech S7:015. doi: 10.4172/2155-9872.S7-015
Copyright: © 2014 Nguyen DT, et al. This is an open-access article distributed under the terms of the Creative Commons Attribution License, which permits unrestricted use, distribution, and reproduction in any medium, provided the original author and source are credited.
Visit for more related articles at Journal of Analytical & Bioanalytical Techniques
Abstract
A novel and straight forward approach for analysis of whispering gallery-mode micro cavity sensing is presented using the finite difference time-domain (FDTD) method. The FDTD simulation shows that eigenmodes of sensing objects (SOs) at the micro-scale can be detected as SO signatures, and therefore provide more accurate and robust information on the objects. Thus, detecting eigenmodes as signatures of SOs with WGM microcavities affords a novel biosensing approach based on object recognition. The FDTD simulation not only describes the circulation of the light in a whispering gallery-mode (WGM) microring and multiple interactions between the light and the sensing object, but also other important parameters of the sensing system, such as scattering and radiation losses.
Keywords
Microsensing; Biological sensing and sensors; Optical sensing and sensors; Computational methods
Introduction
Recently, there has been great progress in the field of biosensors with tremendous sensitivity down to single molecules or single particles of micron- or even nanometer scales [1-11]; these biosensors are capable of detecting the presence of harmful agents, including public health hazards and biowarfare agents. These agents can be microorganisms such as viruses, bacteria etc. or simply metallic particles at the nano and micro-scales. Progress in biosensing therefore relies on advances in molecular and small-scale particle recognition, nanoscience, nanotechnology, and photonics technology. It has been demonstrated both theoretically and experimentally that a key enhancement mechanism responsible for this high sensitivity is the use of whispering gallery modes (WGM) in optical micro-cavities such as microrings, microspheres and microdisks. In such resonators, WGM resonance results in multiple interactions between the guided, re-circulating light and the sensing objects (SO). In such miniature sensors, which usually include a micro-cavity coupled to a waveguide (tapered fiber; for example), a single-shot measurement to detect SOs is feasible. A light beam is launched from a remote location, propagates in the waveguide, and then couples to the micro-cavity and thereby to the SO (molecules or particles), adjacent to the cavity. Due to WGM resonances, the light undergoes recirculation in the cavity, and as a result, the light field interacts with the sensing object multiple times, which can yield detailed information about the SO in the output transmission spectrum. The combination of low-loss confinement of the light in the WGM cavity and light recirculation can provide sensitivity down to single molecule scales. In 2002, Vollmer et al. [2], experimentally demonstrated sensitivity enhancement using a silica microsphere with a radius ~ 100 μm. However, even with this enhanced sensitivity the resulting shift in the resonant wavelength induced by a single molecule was very difficult to detect. Since then, progress has been made both experimentally and theoretically to reach a sensitivity level that is high enough to enable detection of a single molecule or a nanoparticle with R ~30 nm [1-4]. In 2008, using a silica micro-toroid instead of a microsphere, scientists achieved extremely high sensitivity resulting in detection of an individual IL-2 protein molecule [3]. In 2010, nanoparticles with sizes down to 30 nm were detected and analyzed using the mode splitting effect [4]. Recently, Dantham et al. [5] has reported the label-free detection and sizing by a microcavity of the smallest individual RNA virus, MS2, using a single dipole stimulated plasmonics-nanoshell as wavelength shift enhancer
So far, most theoretical analysis and calculations [1-4] of WGM microsensors have been based on coupled mode theory (CMT), which is straightforward and fast, but based on approximations for simple ideal structures which may not directly apply for real systems. Usually, a simplified theoretical analysis gives the shift of the WGM wavelength, assuming that there is a change of the optical path in the cavity when it couples with a sensing object, where the change of the optical path depends on the refractive index and the size of the sensing object. However, as pointed out in [4], the shift is very small and susceptible to noise: intensity and frequency noise of the laser, thermal noise, detector noise and environmental disturbances. The shift also depends on the strength of the coupling between the object and the microring WGM. As a result a small particle with large coupling to the WGM can result in the same shift as a larger object with smaller overlap. Moreover, during measurements, the position of a small object (micro- or submicrometer) could change due to the presence of any disturbance, and the coupling between the object and the micro-cavity, and therefore the optical-path induced by the object are not stable. As a result, the shifts of resonant modes can be very difficult to detect. Furthermore, these analytical approaches fail to encompass many significant and complex factors, such as the actual shape and eigenmodes of the SO, determining the radiation losses of the light field in the tapered fiber and in the microcavity, as well as the scattering loss in the system. All of these factors can be addressed through FDTD simulation as presented in this paper. It is worth stressing that it is very difficult to use CMT to describe the effect of multiple interactions between the light field and the SO. More importantly, FDTD can yield the resonant modes of the sensing object, which are easier to observe than the small resonance wavelength shift predicted by CMT. As will be presented in this paper, the eigenmodes truly are signatures of the sensing objects that can be detected in the sensing spectra. Therefore, detecting the eigenmodes of sensing objects with WGM micro-cavities provides very accurate, fast and sensitive biosensing, thus opening a novel and straightforward approach for microcavity sensor analysis. The observation of the eigenmodes of the SO has several important implications: (i) it is easy to detect the eigenmodes of the SO by observing the transmission from the microcavity; (ii) once the eigenmodes are detected, it is easy to determine the size and index of the SO, and (iii) the SO eigenmodes wavelengths do not depend on the coupling strength between the WGM resonator and the SO which is an important parameter in CMT, but is difficult to determine and control in experiment, and (iv) the eigenmodes are almost immune to experimental noise sources, since it is the location of the modes that is the most important, not their strength, which can be easily perturbed.
In this paper we present a finite-difference time domain (FDTD) simulation of microring-based sensing. Single-shot sensing of labelfree, single- and multi-object sensors using microrings is simulated. Our simulation results show that the eigenmodes of SOs that are adjacent to the microring can be detected in the transmission of the microring sensor. Moreover, the results show that in the case of sensing multiple objects, different eigenmodes of different SOs can be discriminated in the transmission spectrum. The results also show that although the shifts of the resonant modes of the cavity can be changed depending on the coupling strength and number of SOs, the eigenmodes themselves are not altered. In other words, the eigenmodes are truly signatures of the sensing objects. Generally speaking, our proposed approach and others in the related literatures are all based on the same enhancement mechanism, that is, the use of the whispering gallery modes (WGM) in optical micro-cavities. Therefore, the theoretical limit of sensitivity should be common among these different methods. However, the actual difference could be significant in practice and real-device applications.
A broad bandwidth pulse first propagates in a tapered fiber, couples to a resonant microring and then to single or multiple SO(s) adjacent to the ring. The results of FDTD simulation show resonant propagation in a WGM microring, multiple interactions between the recirculating light and the SOs, and resonant light inside the SOs. The transmission of the microring without sensing objects (reference) is compared to that with sensing objects present having different size and refractive indices. The FDTD simulation method is not only suitable for perfectly round objects (disk, spherical particles and molecules), but can also be extended to the problem of irregularly shaped objects as well. The paper is organized as follows: a general description of the system and the simulation method is presented in general description, simulation results including animations of sensing will be presented in the Detect Eigenmodes as Signatures of Sensing Objects, and finally discussions of the advantages and disadvantages of the FDTD method for modeling WGM sensing will be presented in the Conclusion.
General Description
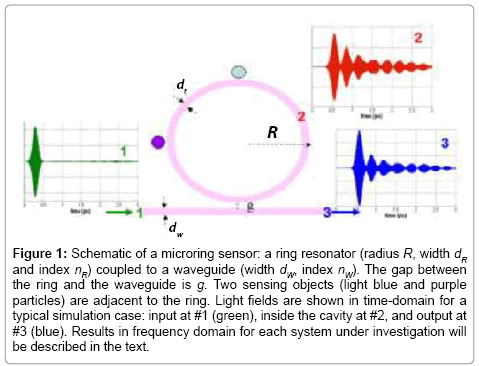
Let us consider a typical microring sensor in which a waveguide (tapered fiber) couples to a resonant microring adjacent to one or multiple sensing objects (SOs) as shown in Figure 1. The results shown in Figure 1 represents a generalized example, in which the FDTD simulation yields the input field at point #1, the field inside the cavity at point #2 and the output field at point #3 in the time domain (TD) and frequency domain (FD). Later, in the Detect Eigenmodes as Signatures of Sensing Objects we will show the spectrum for each case under consideration, and discuss in detail the results. As shown in Figure 1, a femtosecond pulse with a cosine modulated Gaussian waveform is launched from the left into the waveguide, the input field E1(t) (green) in TD is measured at Port #1. Figure 1 also shows as an example the typical simulation results for the light field inside the microring (measured at Position 2 in Figure 1) E2(t) (red), and the output field measured at Port 3 E3(t) (blue). The input intensity, the relative intensity inside the cavity, and the transmission are defined as I1(f) = |E1(f)|2, I2(f) = |E2(f)|2/|E1(f)|2, and T(f) = |E2(f)|2/|E1(f)|2 , respectively, in the frequency domain (not shown here). We will calculate and present the spectrum of I2 and T for each case under consideration in the following sections. Here Ej(t) is the electric field in the time domain at point j, and the Ej(f) are the Fourier transforms in the frequency domain. Note that, the relative light intensity inside the cavity can be used to represent the resonant modes in the microring, meanwhile the relative intensity at Port 3 is the transmission of the microring sensor. Once the light beam is coupled to the microring its components having frequencies that are close to WGM resonances of the cavity will be re-circulated multiple times depending on the quality of the cavity Q. As a result, the resonant light can interact with the sensing object multiple times, instead of only one interaction possible in a simple optical waveguide sensor [1-3]. By monitoring the WGM optical resonances excited in the microcavity and/or the eigenmodes of the sensing object, labelfree, single- or multi-object sensing can be achieved with a single laser shot as described below in our FDTD simulation. As described in our previous work [12] our FDTD code allows us to simulate the microring sensor with a high degree of flexibility, from designing a waveguide with minimum reflection, to extracting information from inside microring and the sensing object as well.
Figure 1: Schematic of a microring sensor: a ring resonator (radius R, width dR and index nR) coupled to a waveguide (width dW, index nW). The gap between the ring and the waveguide is g. Two sensing objects (light blue and purple particles) are adjacent to the ring. Light fields are shown in time-domain for a typical simulation case: input at #1 (green), inside the cavity at #2, and output at #3 (blue). Results in frequency domain for each system under investigation will be described in the text.
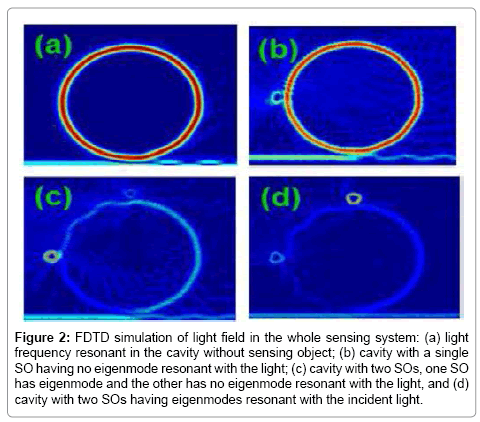
With the configuration of the microring sensor described as in Figure 1, we are now able to numerically investigate the problem of WGM sensing using the FDTD method. We simulate wideband pulse propagation in a waveguide coupled to a microring adjacent to SOs. As examples, we show in Figure 2 light intensity in the whole sensing system in several cases.
Figure 2: FDTD simulation of light field in the whole sensing system: (a) light frequency resonant in the cavity without sensing object; (b) cavity with a single SO having no eigenmode resonant with the light; (c) cavity with two SOs, one SO has eigenmode and the other has no eigenmode resonant with the light, and (d) cavity with two SOs having eigenmodes resonant with the incident light.
Figure 2 shows the light intensity in different cases: (a) light frequency resonant with one WGM resonance of the cavity without a sensing object; (b) light frequency is not resonant with the SO adjacent to the microring; (c) light frequency is resonant with one SO, but is not resonant with the other SO, and (d) light frequency is resonant with both two SOs.
Details of the results in Figure 2 including parameters of the SOs will be presented later with full spectra of resonant modes and transmission for each case. It is important to point out here that there are significant differences between those cases in which the light frequency is non-resonant (Figure 2(b) and 2(c)) and resonant with eigenmodes of the sensing objects (Figure 2(c) and 2(d)). As shown below, the case in Figure 2(b) is that in which the SO has no eigenmode that is resonant with the light. In this case, the SO simply increases the optical pathlength of the light when it circulates in the microring. As a result, the WGM resonances of the cavity are shifted accordingly from the increased optical path due to the effect of the SO. In contrast, Figure 2(c) shows the case with two different SOs, with the light frequency resonant with an eigenmode of only one SO. Now, the light intensity is high inside the resonant SO, and is much weaker in the other SO. Furthermore, Figure 2(d) shows the light intensity in the case with two identical SOs having eigenmodes resonant with the light. Note that, in this case the light frequency is detuned significantly from a resonant mode of the cavity as the light intensity is weak in the cavity, and the transmission is also very low. It is clear from Figure 2(c) and 2(b) that if the light frequency is resonant with the SOs, lower transmission is observed. In other words, the eigenmodes provide signatures of the sensing objects in the transmission. To prove this point, we will present detailed results of all those cases in the Detect Eigenmodes as Signatures of Sensing Objects.
It is worthwhile to stress here that the FDTD method has several features that are advantageous for simulation of such systems as described above. The FDTD method can completely describe light recirculation in the WGM cavity and the multiple interactions between the light and the SO. This feature is very unique to WGM sensing, and is almost impossible to describe accurately by other simplified modeling methods. As presented below, FDTD simulation can also yield the shifts of the resonant modes that are estimated through other simplified modeling analyses [1-4]. More importantly, FDTD simulation can extract the resonant modes of the sensing object, which are in fact easier to detect than the small wavelength shift of the microring modes. It is worth noting that FDTD method has been extensively applied to simulate and analyze WGM of isolated microdisks [13,14], microdisks and microrings [15]. The accuracy of the FDTD method for problems in linear optics was first demonstrated for the directional coupler [16].
Since then, the perfectly matched layer (PML) absorbing boundary condition (ABC) was introduced [17,18], providing the means to terminate the calculated grid space with extremely low reflection.
In our previous paper [12], we have generally described the FDTD simulation method for a typical label-free single-SO microring sensor. We extend the method to consider multiple sensing objects in this paper. Let us briefly describe in general the FDTD simulation method for the microring sensing problem. We consider a two-dimensional (2D) problem where the z-directed electric field is normal to the x-y plane of the grid. We employ the PML ABC in our simulation of the light propagation in the waveguide microring-SO system. It is worthwhile to stress here that accurate FDTD simulations in resonant cavities in general, and especially in WGM cavities have several challenges:
(i) the computation time required for accurate simulation of light recirculation in WGM cavities is much longer than that required for typical scattering or propagation problems, and (ii) even if the reflection due to the numerical boundary conditions is very small within PML ABC, its effects can adversely affect the simulation results. This is especially the case when the light is reflected at the end of the waveguide, counter-propagates, and then couples back to the microring, where it undergoes recirculation in the cavity. To avoid boundary reflection during light recirculation in the microring, we introduce a long waveguide around the sensing area, which includes the microring and the SO as described in detail in our previous work (see e.g. Figure 2 in Ref [12]).
The goal is to make light that has passed the microring keep propagating or be trapped so as to avoid reflection in the waveguide. The optimization challenge in this simulation is to design an extended waveguide that can keep light propagating or get trapped as long as possible, while at the same time minimizing the computational space needed.
Detect Eigenmodes as Signatures of Sensing Objects
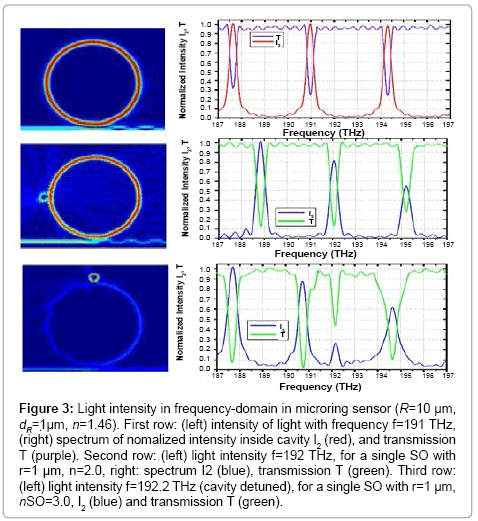
In this section, we will present in detail the simulation results of microring sensing with different sensing objects. First, let us consider the simple cases in which the microring is adjacent to a single object with and without eigenmodes in the spectrum of the light pulse. The simulation results shown in Figure 3 are the light intensity (left) and spectrum (right) of a microring sensor (R=10 μm, dR = 1 μm, n=1.46) without a sensing object (first row), and with a single SO (second and third rows).
Figure 3: Light intensity in frequency-domain in microring sensor (R=10 μm, dR=1ïÂ? μm, n=1.46). First row: (left) intensity of light with frequency f=191 THz, (right) spectrum of nomalized intensity inside cavity I2 (red), and transmission T (purple). Second row: (left) light intensity f=192 THz, for a single SO with r=1 μm, n=2.0, right: spectrum I2 (blue), transmission T (green). Third row: (left) light intensity f=192.2 THz (cavity detuned), for a single SO with r=1 μm, nSO=3.0, I2 (blue) and transmission T (green).
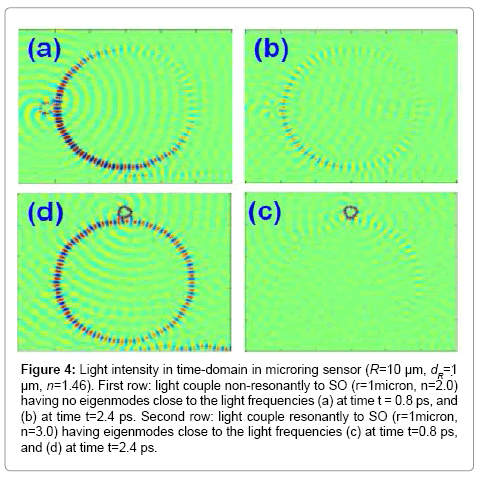
In each row, the figures on the left are the light intensity at one specific frequency in the sensing system including the microring and SO, and the figures on the right are spectra of normalized intensity inside the cavity I2 (showing resonant modes) and the transmission T. In the case without the SO (1st row), the light intensity is strongly resonant inside the cavity, as its frequency f=191 THz is resonant with one cavity mode that is shown in the spectrum. The second row is for the case with a single SO, r=1 μm and n=2.0. The light with f=192 THz is also resonant in the cavity as shown in the spectrum to the right. Note that, in this case, the SO has no eigenmode close to the light frequency and the SO simply increases the optical path of the light circulating in the cavity. As a result, the resonant modes in the cavity shift as compared with the cavity without the SO shown in the first row. The third row is for the cavity with a single SO with r=1 μm, nSO=3.0. The light intensity is plotted at f=192.2 THz (left), corresponding to the new mode observed in the spectrum to the right. It is clear that the light is strongly resonant inside the sensing object, and that this is the origin of the new mode in the transmission of the sensor. We will show the eigenmodes of different SOs later when we discuss the results of multiple SOs. Note that, for the cases with SOs, we also observe resonant mode shifts as is usually observed experimentally. Furthermore, the resonant mode shift in the case with SO n=3.0 (third row), is stronger than in the case of SO =2.0 (second row) as both SO have the same radius r = 1 μm, so that the SO with n=3.0 gives more optical pathlength change. The effect of resonant interaction between the light in the cavity and the SO can be seen even more clearly if we observe the simulation results in the time domain as shown in Figure 4 below. The results in Figures 3 and 4 clearly show the significant difference between the cases in which light resonantly and non-resonantly couples to the SO, or in other words, the eigenmodes of the SO are resonant with the light frequency or not. If the light is non-resonant with the SO eigenmodes, light just couples to the SO and the SO simply increase the optical path length in the cavity and therefore shift the resonant modes in the cavity. The light also gets scattered to a varying degree as evident in the results for both light intensity and spectra. More importantly, the results show that when light is resonant with SO eigenmode, in this case f=192.2 THz, this is clearly evident in both the intracavity relative intensity spectrum and the transmission spectrum of the microring sensor as a new mode, distinct from the case of a cavity without an SO. That the eigenmodes as true signatures of sensing objects can be seen even more clearly below where we consider a microring with two sensing objects.
Figure 4: Light intensity in time-domain in microring sensor (R=10 μm, dR=1ïÂ? μm, n=1.46). First row: light couple non-resonantly to SO (r=1micron, n=2.0) having no eigenmodes close to the light frequencies (a) at time t = 0.8 ps, and (b) at time t=2.4 ps. Second row: light couple resonantly to SO (r=1micron, n=3.0) having eigenmodes close to the light frequencies (c) at time t=0.8 ps, and (d) at time t=2.4 ps.
Let us now consider the more complicated case in which the microring is adjacent to two sensing objects. We consider 4 systems with two SOs (all have radii r=1 μm): (i) two identical SOs with n=2.0; (ii) two identical SOs with n=3.0; (iii) one SO with n=3.0, and the other with n=3.4, and (iv) one SO with n=3.0, and the other with n=3.6. As will be shown below, in those cases with multiple SOs, the eigenmodes of each sensing object can still create new modes in the spectrum of the microring sensor even as the light experiences much stronger scattering.
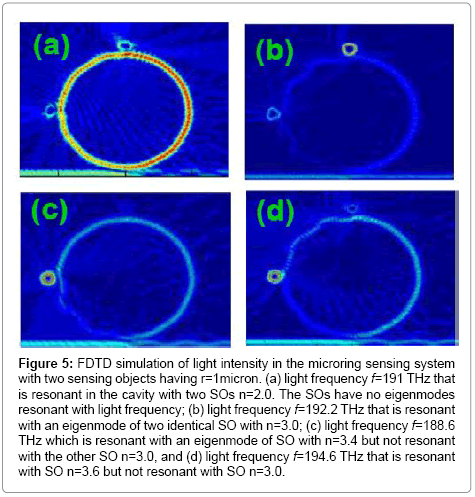
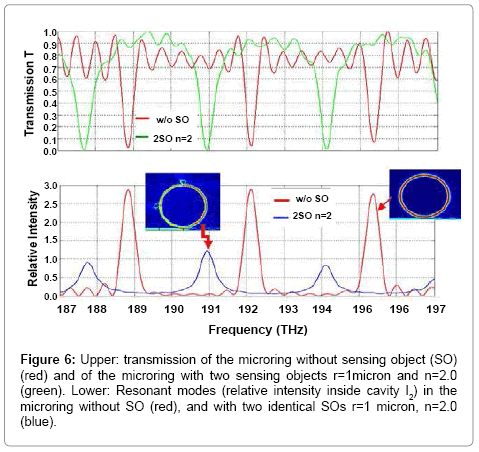
Let’s now present in detail the simulation results for each case corresponding to Figure 5 above. First, we consider the system in Figure 5(a) that includes a microring and two identical SOs with r=1 μm and n=2.0. Note that, the SOs are intentionally chosen to have no eigenmodes within the pulse spectrum from 186 to 197 THZ used in the simulation. Figure 6 below shows the transmission T and the resonant modes (normalized intensity inside the cavity, I2) of the microring with the two SOs compared to the microring without SOs.
Figure 5: FDTD simulation of light intensity in the microring sensing system with two sensing objects having r=1micron. (a) light frequency f=191 THz that is resonant in the cavity with two SOs n=2.0. The SOs have no eigenmodes resonant with light frequency; (b) light frequency f=192.2 THz that is resonant with an eigenmode of two identical SO with n=3.0; (c) light frequency f=188.6 THz which is resonant with an eigenmode of SO with n=3.4 but not resonant with the other SO n=3.0, and (d) light frequency f=194.6 THz that is resonant with SO n=3.6 but not resonant with SO n=3.0..
Figure 6: Upper: transmission of the microring without sensing object (SO) (red) and of the microring with two sensing objects r=1micron and n=2.0 (green). Lower: Resonant modes (relative intensity inside cavity I2) in the microring without SO (red), and with two identical SOs r=1 micron, n=2.0 (blue).
Clearly, Figure 6 shows the shifts of the resonant modes of the microring adjacent to the SOs that have no eigenmode in the whole frequency spectrum of the light pulse. Note that, because of scattering due to SOs the mode strength in the system with two SOs is much weaker than that for the cavity without SOs (see. e.g. blue and red curves, respectively in lower spectrum figure). It is also clear that in this case as the SOs have no eigenmodes there is no new mode observed in either transmission (upper spectra) or internally (lower spectra) in comparison with the microring without SOs.
We now investigate numerically the systems in which the SOs has eigenmodes that are resonant with light frequencies within the bandwidth of the light pulse. As stated in the introduction, our simulation results will show that different eigenmodes of different SOs are evident in the transmission spectrum, and therefore these modes can play the role of an SO signature. To establish this important point, we present the results for the systems that were described above (b) two identical SOs with n=3.0; (c) two SOs with n=3.0 and n=3.4, and (d) two SOs with n=3.0, and n=3.6 (all SOs have r=1 μm).
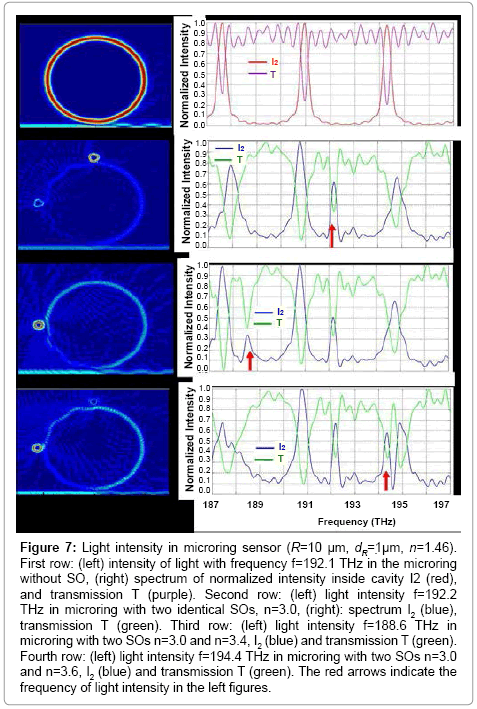
We want to emphasize that all three systems have at least one SO with n=3.0. If the eigenmodes are true signatures of the objects, we would expect that all three systems (b), (c) and (d) would have spectra that have the same common eigenmodes of the SO with n=3.0. Note that the spectra for the microring adjacent to a single SO with n = 3.0 were shown in Figure 3 (right, 3rd row) with an eigenmode at f = 192.2 THz. The mode appears both in the resonant mode spectrum of the microring, and in the transmission spectrum of the sensing system. Therefore, we expect to see the signature of the SO with r=1 μm, n=3.0 as its eigenmode at 192.2 THz. In the following, the FDTD simulation results for those systems are presented as compared to the cavity without sensing objects; Figure 7 show the transmission spectra and resonant mode spectra for the microring without and with two SOs (all SOs have r=1 μm) as described, for systems (b), (c) and (d). Remarkably, all three different configurations clearly show the eigenmode f=192.2 THz of the common SO with r=1 μm and n=3.0. Furthermore, the light intensity (left figures in 3rd and 4th rows of Figure 7) clearly shows that the two SOs with n=3.4 and 3.6 have eigenmodes that are resonant with light frequency at 188.6 THz and 194.4 THz which show up in resonant mode spectra for the systems with SOs having n=3.4 and 3.6, respectively. Note that, besides the appearance of the eigenmodes of SOs, the results in Figure 7 also show the shifts of the resonant modes for the systems with SOs (spectra in the 2nd, 3rd and 4th rows) compared with the system without SOs (first row).
Figure 7: Light intensity in microring sensor (R=10 μm, dR=1ïÂ? μm, n=1.46). First row: (left) intensity of light with frequency f=192.1 THz in the microring without SO, (right) spectrum of normalized intensity inside cavity I2 (red), and transmission T (purple). Second row: (left) light intensity f=192.2 THz in microring with two identical SOs, n=3.0, (right): spectrum I2 (blue), transmission T (green). Third row: (left) light intensity f=188.6 THz in microring with two SOs n=3.0 and n=3.4, I2 (blue) and transmission T (green). Fourth row: (left) light intensity f=194.4 THz in microring with two SOs n=3.0 and n=3.6, I2 (blue) and transmission T (green). The red arrows indicate the frequency of light intensity in the left figures.
We then go further to calculate the eigenmodes of the SOs that are considered in all three systems (b), (c) and (d). In order to make sure the eigenmodes of SOs (if they do exist) would behave the same as in the conditions of the microring sensor we run the FDTD simulation of the same pulse light coupled from a waveguide to the SOs, and calculate the relative intensity in the SOs. The spectrum of the relative intensity within a given SO will show the eigenmodes of the SO in the bandwidth of the light pulse. The eigenmodes will then be compared with the new modes in spectra of the microring sensors having the SOs adjacent to the microring.
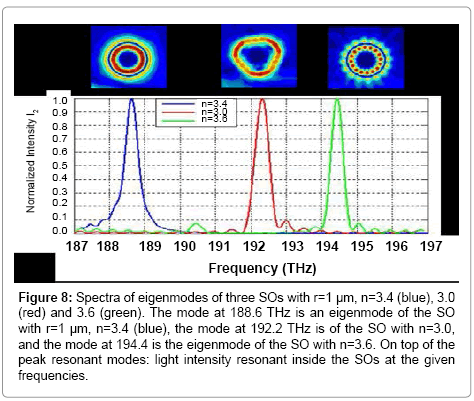
The spectra in Figure 8 show the eigenmodes of the SOs with r=1 μm, and n=3.0, 3.4 and 3.6. Clearly, the SO with n=3.4 has a strong resonant mode at 188.6 THz (blue curve), meanwhile the one with n=3.0 has a strong resonant mode at f=192.2 THz (red curve) and the SO with n=3.6 has a strong resonant mode at 194.4 THz. These eigenmodes appear as new modes in the transmission of the microring adjacent to those SOs as presented above in Figures 3 and 8 for both single SO and two SO systems, respectively. Therefore, the results in Figure 8 strongly confirm the most important result in this paper, which is that the SO eigenmodes can be detected as the signatures in the microcavity transmission spectrum.
Figure 8: Spectra of eigenmodes of three SOs with r=1 μm, n=3.4 (blue), 3.0 (red) and 3.6 (green). The mode at 188.6 THz is an eigenmode of the SO with r=1 μm, n=3.4 (blue), the mode at 192.2 THz is of the SO with n=3.0, and the mode at 194.4 is the eigenmode of the SO with n=3.6. On top of the peak resonant modes: light intensity resonant inside the SOs at the given frequencies.
Note that Figure 8 also shows some other weak resonant modes in the SOs, for example the mode at 190.5 THz for the SO with n=3.6 (blue curve in Figure 8), but this mode overlaps with, and is dominated by a resonant mode of the microring at 190.8 THz, and therefore is not observed in the transmission spectrum as shown in Figure 7 (4th row). The SO with n = 3.0 has one other weak resonant mode at f~193 THz in Figure 8, which could still be detected as shown in Figure 7. That is because this mode does not overlap with a strong resonant mode of the microring. Note that the eigenmode at 192.2 THz of the SO with r=1 μm and n=3.0 (in this case a 2D perfect disk) has an intensity distribution that is not a perfect circle inside of the 2D SO (disk) as shown in the top of Figure 8. Meanwhile, the eigenmodes of the other two SOs with r=1 μm, n=3.4 and 3.6 at 188.6 THz and 194.4 THz are rounded distributions in the 2D SOs. That’s because in the case with n = 3.0, the light needs to optimize the optical path in the SO, which is a 2D-particle to have a resonant mode at that frequency. Meanwhile, for SOs with higher refractive index, the optical path around the circumference of the 2D particle is sufficient to establish resonant modes. The above results, both in frequency-domain and time-domain clearly show that the eigenmodes of the sensing objects are distinguishable depending on the optical parameters such as size, index etc. of the objects, and therefore they could be truly considered as the signatures of the SOs. The FDTD simulation shows that eigenmodes of sensing objects (SOs) at the micro-scale can be detected as SO signatures, and therefore provide more accurate and robust information on the objects. Thus, detecting eigenmodes as signatures of SOs with WGM microcavities affords a novel biosensing approach based on object recognition. Although the eigenmodes are signatures of the object, the modes that are excited would depend on the geometry between the “marker” and the microresonator. In general, we should calculate the eigenmodes of the object in different orientations if the object has a complicated shape. In general, the smallest detectable object would be the smallest object that has at least one mode at the wavelength of measurement. For example, a disk having radius r and index n that can support a mode with wavelength λ can be estimated as 2π.n.r.q.λ, (q=1,2,3...) , q=1 corresponds to the fundamental mode in the object. So, if n=1.5, then the smallest size of the object is estimated as r=/2π.λ.n ~ λ/10. Note that, this, in turn, may depend upon the shape of the object, and it is not as simple a calculation for an arbitrary shape; nevertheless, this simple model provides a reasonable estimate as to the smallest detectable object for a given wavelength and refractive index.
Conclusion
In conclusion, we have numerically investigated microring sensing using the FDTD simulation method. As presented in this paper, the eigenmodes truly are signatures of the sensing objects that can be detected as new modes in the sensing spectra. Therefore, detecting the eigenmodes of sensing objects by WGM micro-cavities provides very accurate, fast and sensitive motif for small particle and biosensing, thus presenting a novel and straight forward approach for exploiting microcavity sensing. It is important to stress that besides the shifts of the resonant modes in the WGM sensors, the eigenmodes provide other important information for the objects, and therefore provide a more robust approach for analyzing the sensing results. Furthermore, the FDTD method can deal effectively with different shaped objects. In such complex cases, the FDTD simulation can accurately provide both the object’s eigenmodes and the shifts of WGM resonances, and therefore it has a unique capability to simulate WGM sensing in general, and especially microring sensors as presented in this paper.
Acknowledgements
This material is based upon work supported by the U.S. Air Force Office of Scientific Research under Award No. FA955010-1-0555 (BioPAINTS MURI) and upon the support of the CIAN NSF ERC (EEC-0812072).
References
- Armani AM, Kulkarni RP, Fraser SE, Flagan RC, Vahala KJ (2007) Label-free, single-molecule detection with optical microcavities. Science 317: 783-787.
- Vollmer F, Braun D, Libchaber A (2002) Protein detection by optical shift of a resonant microcavity. Appl Phys Lett 80: 4057-4059.
- Vollmer F, Arnold S (2008) Whispering-gallery-mode biosensing: label-free detection down to single molecules. Nat Methods 5: 591-596.
- Zhu J, Ozdemir SK, Xiao YF, Li L, He L, et al. (2010) On-chip single nanoparticle detection and sizing by mode splitting in an ultrahigh-Q microresonantor. Nature Photonics 4: 46-49.
- Dantham VR, Holler S, Kolchenko V, Wan Z, Arnold S (2012) Taking whispering-gallerymode single virus detection and sizing to the limit. Applied Phys Lett 101: 043704.
- Vollmer F (2011) Microcavity Biosensing. In: Proc. SPIE Frontiers in Ultrafast Optics: Biomedical, Scientific, and Industrial Applications XI. Eds Heisterkamp A, Neev J, Nolte S 7925: 792502.
- Kyu Kim S, Cho H, Park HJ, Kwon D, Min Lee J, et al. (2009) Nanogap biosensors for electrical and label-free detection of biomolecular interactions. Nanotechnology 20: 455502.
- Esfandyarpour R, Javanmard M, Koochak Z, Esfandyarpour H, Harris JS, et al. (2013) Label-free electronic probing of nucleic acids and proteins at the nanoscale using the nanoneedle biosensor. Biomicrofluidics 7: 044114.
- Esfandyarpour R, Esfandyarpour H, Javanmard M, Harris JS, Davis RW (2013) Microneedle Biosensor: A Method for Direct Label-free Real Time Protein Detection. Sens Actuators B Chem 177: 848-855.
- Goda T, Miyahara Y (2013) Label-free and reagent-less protein biosensing using aptamer-modified extended-gate field-effect transistors. Biosens Bioelectron 45: 89-94.
- Goda T, Tabata M, Sanjoh M, Uchimura M, Iwasaki Y, et al. (2013) Thiolated 2-methacryloyloxyethyl phosphorylcholine for an antifouling biosensor platform. Chem Commun (Camb) 49: 8683-8685.
- Nguyen DT, Norwood RA (2013) Label-free, single-object sensing with a microring resonator: FDTD simulation. Opt Express 21: 49-59.
- Hawkins RJ, Maden NK, Kallman JS, Feit MD, Shang CC, et al. (1993) Full-wave simulation of the thumbtack laser. In: Integrated Photon Res Tech Dig, Palm Springs 10: 116-119.
- Li BJ, Liu PL (1996) Numerical analysis of whispering gallery modes by the finite – different time-domain method. IEEE J Quantum Electron 32: 1583-1587.
- Hagness SC, Rafizadesh D, Ho ST, Taflove A (1997) FDTD microcavity simulations: design and experimental realization of waveguide-coupled single-mode ring and whisperinggallery-mode disk resonators. J Lightwave Tech 15: 2154-2165.
- Chu ST, Chaudhuri SK (1989) A finite-difference time-domain method for the design and analysis of guided-wave optical structures. J Lightwave Technol 7: 2033-2038.
- Berenger JP (1994) A perfectly matched layer for the absorption of electromagnetic waves. J Comput Phys 114: 185-200.
- Sullivan DM (2000) Electromagnetic simulation using FDTD method. Wiley-IEEE Press.
Relevant Topics
Recommended Journals
Article Tools
Article Usage
- Total views: 13693
- [From(publication date):
specialissue-2015 - Nov 23, 2024] - Breakdown by view type
- HTML page views : 9276
- PDF downloads : 4417

