Research Article Open Access
A Highly Sensitive Method for the Quantitation of Polysorbate 20 and 80 to Study the Compatibility between Polysorbates and m-Cresol in the Peptide Formulation
Shuai Shi, Zhi Chen*, Joseph M Rizzo, Andrew Semple, Sarita Mittal, Jason K Cheung, Daisy Richardson, Valentyn Antochshuk and Mohammed Shameem
Sterile Product and Analytical Development, BioProcess Development, Merck Research Laboratories, Merck & Co, Kenilworth, NJ 07033, USA
- *Corresponding Author:
- Zhi Chen
Sterile Product and Analytical Development, BioProcess Development
Merck Research Laboratories, Merck & Co
Kenilworth, NJ 07033, USA
Tel: +1 908-740-6798
E-mail: zhi.chen@merck.com
Received date: March 16, 2014; Accepted date: May 05, 2015; Published date: May 12, 2015
Citation: Shi S, Chen Z, Rizzo JM, Semple A, Mittal S, et al. (2015) A Highly Sensitive Method for the Quantitation of Polysorbate 20 and 80 to Study the Compatibility between Polysorbates and m-Cresol in the Peptide Formulation. J Anal Bioanal Tech 6: 245. doi: 10.4172/2155-9872.1000245
Copyright: © 2015 Shi S, et al. This is an open-access article distributed under the terms of the Creative Commons Attribution License, which permits unrestricted use, distribution, and reproduction in any medium, provided the original author and source are credited.
Visit for more related articles at Journal of Analytical & Bioanalytical Techniques
Abstract
A highly sensitive method has been developed for the quantitation of polysorbate 20 (PS20) and 80 (PS80) in therapeutic peptide formulations. A mixed-mode HPLC column was used to separate polysorbates from the peptide and other excipients, and a charged aerosol detector (CAD) was used for the detection. The method was capable of reporting polysorbates as low as 5 ppm, and the sensitivity could be further improved on a needed basis. The method has been used to study the compatibility between polysorbates and m-cresol in the peptide formulation. It was found that both PS20 and PS80 are compatible with m-cresol (at 2.8 mg/ml) when their levels were not greater than 20 ppm. Significant losses of polysorbates were observed when PS20 and PS80 concentrations were above 50 ppm. Furthermore, the agitation study demonstrated that even trace levels of PS20 and PS80 (e.g., 20 ppm) could stabilize the peptide against fibrillation and aggregation.
Keywords
HPLC-CAD; Polysorbate 20; Polysorbate 80; m-Cresol; Compatibility; Peptide formulation
Introduction
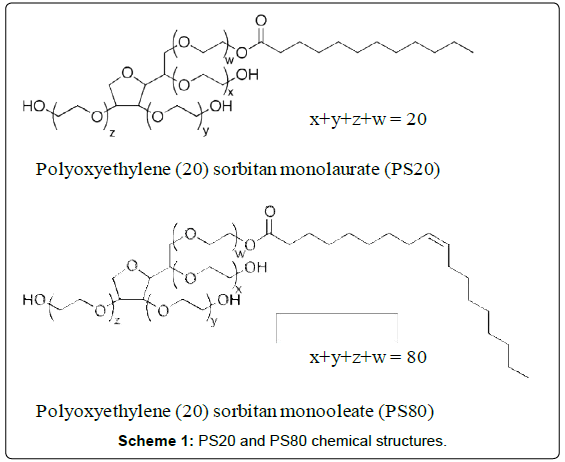
Polysorbate 20 (PS20) and polysorbate 80 (PS80), also known as Tween® 20 and Tween® 80, respectively, are fatty acid esters of polyoxyethylene sorbitan. As shown in Scheme 1, PS20 and PS80 consist of a heterogeneous chemical structure distribution. The fatty acid hydrocarbon chain and the polyoxyethylene sorbitan group provide respectively the hydrophobic and hydrophilic characters to the polysorbate molecule. PS20 and PS80 are commonly used as non-ionic surfactants in the formulation of biotherapeutic products to prevent surface adsorption and stabilize protein against aggregation induced by stresses such as agitation and shear. For quality control purposes, it is critical to determine the concentration of PS20 and PS80 in the final drug substance (DS) and drug product (DP).
Multi-dose protein formulations contribute to approximately one third of protein-based pharmaceuticals available on the global market [1]. These formulations are beneficial in terms of both economics and patient compliance, and require the inclusion of at least one antimicrobial preservative in order to inhibit the growth of microbes and bacteria during administration [1,2]. Meta-cresol (m-Cresol), also known as 3-methylphenol, is widely used as an antimicrobial preservative in intramuscular, intradermal, and subcutaneous injectable pharmaceutical formulations [3]. Besides antimicrobial effect, phenolic compounds have also been used in various market insulin formulations to provide additional benefit such as conformational stabilization of the insulin molecule [4,5].
Although phenolic preservatives including m-Cresol tend to be active over a wider pH range than alcohols or acids, it may not be compatible with certain excipients used in a multi-dose formulation. One such excipient is the non-ionic surfactant such as PS20 and PS80 [3]. The interactions between them may not involve conventional chemical transformation, but concern more subtle phenomena such as complex formation. Such incompatibility may not only increase sub subvisible particulate counts in the formulation but also compromise the preservative efficacy. Despite potential incompatibility, formulation with the coexistence of both phenolic compound and polysorbate does exist on the market. For instance, Lantus (insulin glargine) marketed by Sanofi in the 10 ml vial presentation has a formulation containing 2.7 mg/ml m-Cresol and 20 ppm PS20. This suggests that the generally perceived incompatibility issue of co-formulating phenolics and polysorbates may be concentration dependent and therefore is the main focus of the present study.
In order to study the compatibility between polysorbates and m-Cresol, a highly sensitive method for the quantitation of PS20 and PS80 is desired. Numerous methods exist for the quantitation of polysorbates. For instance, spectrophotometric determination after derivatization [6], fluorescence polarization (FP) assay [7], RP-HPLCUV analysis of lauric/oleic acid after alkalimetric hydrolysis [8,9], and RP-HPLC-CAD [10] methods were reported in the literature. However, most of these methods are problematic in terms of sensitivity, specificity, accuracy, and throughput. In this work, a highly sensitive method has been developed for the quantitation of PS20 and PS80 at the ppm level. A mixed-mode HPLC column was used to separate polysorbates from the peptide and other excipients, and a charged aerosol detector (CAD) was used for the detection. The method has been employed to study the compatibility between m-Cresol and polysorbates at various pharmaceutical relevant concentrations in the peptide formulation. Our data have shown that both PS20 and PS80 are compatible with m-Cresol (at 2.8 mg/ml) when their levels were not greater than 20 ppm. Furthermore, the agitation study demonstrated that even trace levels of PS20 and PS80 (e.g., 20 ppm) could stabilize the peptide against fibrillation and aggregation.
Materials and Methods
Chemicals and materials
Isopropyl alcohol (IPA) was HPLC grade and purchased from Fisher Scientific (Pittsburgh, PA). Water (18.2 MΩ cm) was purified using a Milli-Q filtration system (Millipore, Billerica, MA). Formic acid (99%) was purchased from Acros Organics (part of Fisher Scientific). Polysorbate 20 and polysorbate 80 (USP-NF) were J. T. Baker brand and obtained from Avantor (Center Valley, PA). m-Cresol (99%) was purchased from Sigma-Aldrich (St. Louis, MO). The peptide used in this study was created using proprietary Merck technology (Kenilworth, NJ) with the molecular weight of approximately 6 kDa. It was formulated in phosphate buffer at pH 7.0 and known to be sensitive to fibrillation upon agitation.
HPLC instrumentation
Chromatographic analysis was performed on a Waters 2695 Alliance HPLC system (Milford, MA). The HPLC system was equipped with a quaternary low-pressure mixing pump, an auto-sampler, and a column compartment with temperature control. A Corona® (Thermo Scientific, San Jose, CA) charged aerosol detector (CAD) was used to determine the polysorbate signal. Nitrogen gas was provided by inhouse source at 100 psi. Data acquisition, analysis, and reporting were performed using Empower 2 chromatography software (Milford, MA).
Chromatographic conditions of the final method
The separation was performed using a Waters Oasis MAX column (2.1 × 20 mm, 30 μm particle size, Product Number 186002052). The mobile phase A was water with 2% formic acid (v/v), and mobile phase B was isopropyl alcohol (IPA) with 2% formic acid (v/v). The gradient program is listed in Table 1. The column temperature was maintained at 30°C, and a flow rate of 1.0 ml/min was used. The CAD was set at 500 pA gain and a low noise filter. The sample injection volume was 100 μl.
| Time (min) | Mobile phase A (%) | Mobile phase B (%) | Comment |
|---|---|---|---|
| 0.0 | 80.0 | 20.0 | Isocratic hold to elute positively charged peptide and hydrophilic formulation excipients |
| 4.0 | 80.0 | 20.0 | |
| 4.1 | 0.0 | 100.0 | Gradient step to elute heterogeneous and lipophilic polysorbates in one single peak |
| 9.0 | 0.0 | 100.0 | |
| 9.1 | 80.0 | 20.0 | Column re-equilibration |
| 12.0 | 80.0 | 20.0 |
Table 1: Gradient program of the method.
Preparation of PS20 and PS80 standard solutions
PS20 and PS80 stock solutions were prepared respectively by dissolving 1 g of each in 1000 ml of water in a volumetric flask. The stock solutions were then diluted to 100, 75, 50, 30, 25, 20, 15, 10, and 5 ppm in water.
PS20/PS80 spiking study
To determine the accuracy of the method, peptide solutions were spiked with PS20 and PS80 stock solutions respectively and the final polysorbate concentrations in the spiked solutions were 30, 20, and 10 ppm.
m-Cresol and polysorbate compatibility in water
Twenty ml each of PS20 and PS80 standard solution at the concentration of 10, 20, 50 and 100 ppm were transferred to 20R vials, respectively. A magnetic stir bar was added in each vial and stirred at 1000 rpm. In each of the polysorbate solution, 54.4 μl (56 mg) of neat m-Cresol was added. The polysorbate concentrations in these solutions were determined for a time course of 14 days under room temperature and prevented from light.
m-Cresol and polysorbate compatibility in peptide formulations
The dilution Scheme in Table 2 was followed for this study. Additionally, the order to add polysorbates and m-Cresol was also evaluated. For one set of samples, polysorbate was added first in the peptide solution followed by the addition of m-Cresol. For another set of samples, m-Cresol was added first in the peptide solution followed by the addition of polysorbate stock solutions. Stirring at 1000 rpm was performed when preparing these solutions. The polysorbate concentrations in these solutions were determined for a time course of 14 days under room temperature and prevented from light.
| Volume of peptide DS solution (unformulated) | Volume of PS20/PS80 stock solution (1 mg/ml) | Volume of neat m-cresol (density=1.03 mg/µl) | Volume of water | PS20/PS80 concentration in peptide formulations | m-Cresol concentration in peptide formulations |
|---|---|---|---|---|---|
| 10 ml | 0.2 ml | 54.4 µl | 9.8 ml | 10 ppm | 2.8 mg/ml |
| 10 ml | 0.3 ml | 54.4 µl | 9.7 ml | 15 ppm | 2.8 mg/ml |
| 10 ml | 0.4 ml | 54.4 µl | 9.6 ml | 20 ppm | 2.8 mg/ml |
| 10 ml | 1.0 ml | 54.4 µl | 9.0 ml | 50 ppm | 2.8 mg/ml |
Table 2: Dilution scheme for the evaluation of m-cresol and polysorbate compatibility in peptide formulations.
Evaluation of peptide stability with agitation study
Peptide formulation solutions spiked with different levels of polysorbate were filled into 2R vials at the volume of 1 ml. Agitation study was performed using a C76 Water Bath Shaker (New Brunswick Scientific, Edison, NJ). The drug product vials were placed in the upright position and subject to reciprocal shaking at 300 rpm for three days at 30°C. To assess the stability of peptide against aggregation and fibrillation, a panel of assays including turbidity, size-exclusion chromatography (SEC), micro-flow imaging (MFI) and fibril assays were performed. Turbidity measurements were performed using a SpectraMax M5 plate reader (Molecular Devices, Sunnyvale, CA) monitored at 350 nm. Samples subject to SEC analysis were run undiluted on a Waters Alliance 2695 system with a Waters 2486 dual-wavelength detector. A mobile phase of 1 mg/ml L-arginine/ acetonitrile/glacial acetic acid (65/20/15, v/v/v) was used at the flow rate of 0.5 ml/min. One hundred μl of sample was injected and run through a Waters Insulin HMWP column (7.8 × 300 mm, particle-size 3.5 μm). UV detection was performed at 280 nm. Sub-visible particles were characterized by micro-flow imaging using the Brightwell MFI 5200 instrument (ProteinSimple, San Jose, CA). Briefly, flow cell was flushed and the illumination was optimized with 0.22-micron filtered water before each run. Then 800 μl of undiluted sample was run through a 100-micron flow cell, with an initial 300 μl purge volume prior to sample analysis of the remaining volume (~430 μl). Particle count was recorded for particles greater than 2, 5, 10, 25 and 50 microns, respectively. Fibril content was determined by the Thioflavin T assay using a Cary Eclipse fluorometer (Agilent Technologies, Santa Clara, CA). Briefly, Thioflavin T is a dye which exhibits fluorescence upon binding to fibril structures. A standard curve was first generated with insulin fibrils. Samples were spiked with Thioflavin T, and their fluorescence was compared to the fibril standard curve to calculate fibril content. The excitation wavelength was 450 nm and the emission wavelength was 482 nm for the detection.
Results
Method development
The purpose of this method is to determine ppm levels of polysorbate in samples containing peptide and m-Cresol. It has been reported that a mixed-mode column Waters Oasis MAX could separate PS20 from proteins and hydrophilic excipients [11] and therefore was chose for this study. Evaporative light scattering detector (ELSD) and CAD are both widely used detectors to monitor nonvolatile and semi-volatile analytes lacking UV chromophore. Generally, CAD is more sensitive than ELSD and is easier to operate [12]. Therefore, a Corona CAD was used in this work.
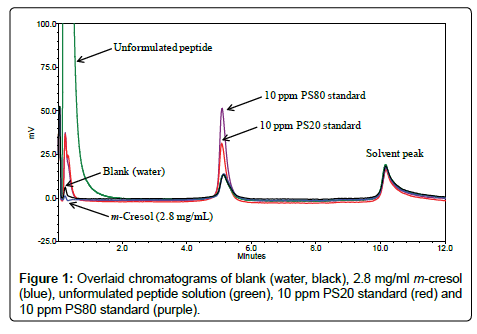
Mobile phase selection: An acidic mobile phase is required to ensure the peptide is positively charged therefore eluted in the void volume by the anion-exchange mode of the column. Water with 2% formic acid (v/v) was chosen for this purpose as used in a previous study [11]. The chemical structures of polysorbates are very heterogeneous [13]. As shown in Table 3, pharmaceutical grade PS20 and PS80 are mixtures of partial esters of fatty acids, and hence they have diverse distributions of lipophilicity. Over a dozen of peaks are usually found on typical reversed-phase chromatograms [14] and the method would be difficult for the quantitation purpose, especially at the ppm level. Therefore, it is desired to elute all polysorbate components in one single peak and this was achieved using a steep gradient step with 100% mobile phase B (2% formic acid (v/v) in IPA). m-Cresol is a slightly hydrophobic compound with a theoretical log P value of 2.0 (ChemBioOffice 2010). However, m-Cresol is also volatile hence has no signal on the CAD. Figure 1 shows the overlaid chromatograms of blank (water), m-Cresol, unformulated peptide, PS20, and PS80. PS20 and PS80 elute with the gradient step at five minute with a one-minute dwell time delay, while their hydrophilic degradants (mainly sorbitan polyoxyethylene) [14] elute at the void time. The blank injection has an interfering peak at the same retention time of PS20 and PS80 which is caused by the mobile phase gradient change. This is normal for the CAD [15] because of its superior sensitivity. Peptide elutes at the void time and m-Cresol has no signal, but both of them have a similar interfering peak at five minute as in the blank injection. Since the interfering peak is relatively constant, it is cancelled out when a multi-point calibration is performed for the quantitation purpose. The peak at 10 minute in all injections is also caused by the gradient change (mobile phase B from 100% to 20%).
| EU Specifications | |||
|---|---|---|---|
| Acid | PS20 (%)a | PS80 (%)b | Structure |
| Caproic | ≤ 1 | CH3(CH2)4COOH | |
| Caprylic | ≤ 10 | CH3(CH2)6COOH | |
| Capric | ≤ 10 | CH3(CH2)8COOH | |
| Lauric | 40–60 | CH3(CH2)10COOH | |
| Myristic | 14–25 | ≤ 5 | CH3(CH2)12COOH |
| Palmitic | 7–15 | ≤ 16 | CH3(CH2)14COOH |
| Palmitoleic | ≤ 8 | CH3(CH2)5CH=CH(CH2)7COOH | |
| Stearic | ≤ 7 | ≤ 6 | CH3(CH2)16COOH |
| Oleic | ≤ 11 | ≥ 58 | CH3(CH2)7CH=CH(CH2)7COOH |
| Linoleic | ≤ 3 | ≤ 18 | CH3(CH2)4CH=CHCH2CH=CH(CH2)7COOH |
| Linolenic | ≤ 4 | CH3(CH2)4CH=CHCH2CH=CH CH2CH=CH (CH2)4COOH | |
| aEuropean Pharmacopoeia 8.0, 07/2015:0426; bEuropean Pharmacopoeia 8.0, 01/2011:0428 | |||
Table 3: PS20 and PS80 composition of fatty acids.
A stop-flow experiment was performed to elucidate if the polysorbate degradants were introduced in the chromatographic run or they already existed in the reagent. Briefly, the mobile phase flow was stopped after the sample was injected onto the column; after a certain period of wait time, the flow was restarted and the analyte was eluted with the gradient step. No decrease of the polysorbate peak area was observed with up to 60 minutes of stop-flow time, indicating that no on-column degradation of the polysorbate had occurred. Additionally, the degradation peak did not increase for PS20 and PS80 prepared in mobile phase A and incubated at 30°C for up to one week. These two experiments demonstrated that PS20 and PS80 are stable under the optimized chromatographic condition.
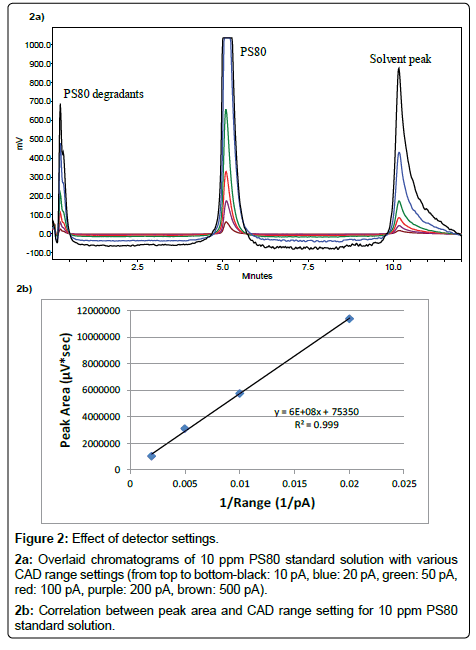
Detection settings: Output range and filter time are two parameters of Corona CAD that can be adjusted by the operator and affects the sensitivity of detection. To optimize the assay performance, signal output ranges were set at 10, 20, 50, 100, 200, and 500 pA, respectively, and the impact on chromatogram was evaluated. As shown in Figure 2a, when the setting was 10 and 20 pA, the signal of the 10 ppm PS80 standard was already out of the detector range, and the noise level of the baseline was very high. The PS80 signal was brought back to range when the setting was increased to 50 pA and above. A linear correlation was found when plotting the peak area of PS80 against the reciprocal of range, as indicated in Figure 2b. This observation implies that the CAD range setting increases the chromatogram signal only by a digital multiplier but does not improve the sensitivity fundamentally. Therefore, a 500 pA setting is recommended to ensure the widest dynamic range of the assay. The filter time constant is used to electronically reduce the noise in the chromatogram. As the signalto- noise (S/N) ratio was already high for the PS80 peak, no major impact was found when the setting varied at “no”, “low”, “medium”, and “high”.
Figure 2: Effect of detector settings.
2a: Overlaid chromatograms of 10 ppm PS80 standard solution with various CAD range settings (from top to bottom-black: 10 pA, blue: 20 pA, green: 50 pA, red: 100 pA, purple: 200 pA, brown: 500 pA).
2b: Correlation between peak area and CAD range setting for 10 ppm PS80 standard solution.
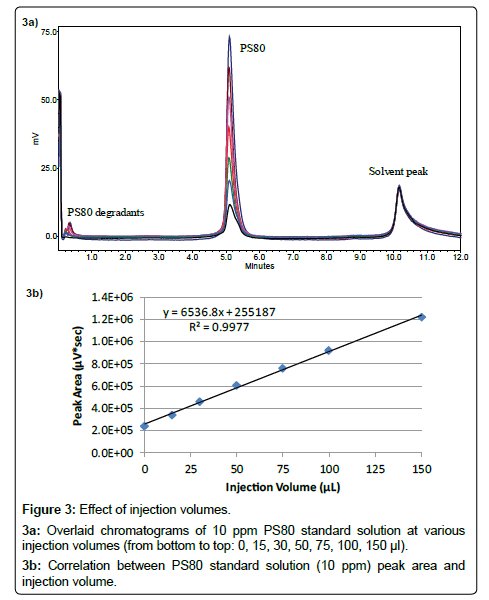
Injection volume: Larger injection volume usually favors the assay sensitivity for low concentration samples if peak shape and resolution on the chromatogram are not impacted. Figure 3a shows the overlaid chromatograms of a 10 ppm PS80 standard solution with different injection volumes. No peak broadening was found when the injection volume increased from 10 μl to 150 μl and linear correlation between peak area and injection volume has been observed, as indicated in Figure 3b. This is typical for lipophilic samples prepared in a weak solvent, in this case, water, and injected on a reversed-phase column. An injection volume of 100 μl is chosen in this work, but larger volume can be used to improve the sensitivity further for samples with lower polysorbate concentrations. Additionally, the interfering peak in the blank remained constant while the injection volume was increased. This observation confirms that the interference is caused by the mobile phase gradient step.
Assay performance
Specificity: Figure 1 shows the overlaid chromatograms of unformulated peptide, m-Cresol, PS20, and PS80. As discussed earlier, the peptide is positively charged in the acidic mobile phase and hence elutes at the void time by the anion-exchange mode. m-Cresol is a volatile compound introducing no signal on CAD. PS20 and PS80 are neutral and lipophilic and hence retain on the column. They are eluted in one single peak with a steep gradient step at 4.1 minute. Their retention times were slightly later on the chromatogram due to a dwell volume delay.
A small peak co-eluting with the polysorbate peak was observed on the blank chromatogram. This blank peak remains relatively constant and independent of injection volume. It is cancelled out when a multipoint calibration was performed for the quantitation purpose.
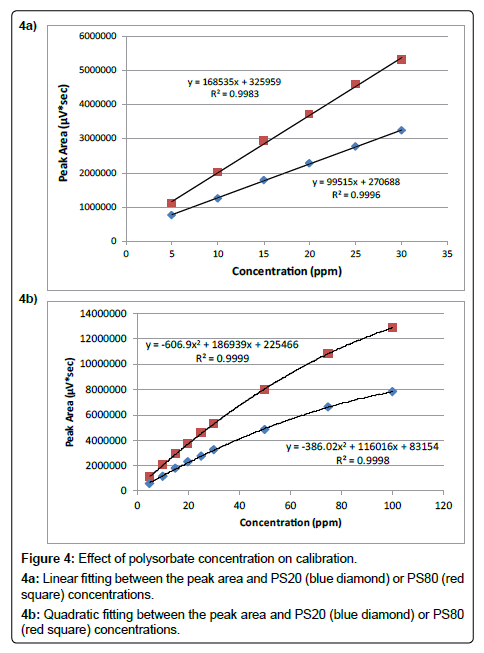
Linearity: Linearity has been evaluated for both PS20 and PS80 from 5 ppm to 30 ppm using standard solutions prepared at six concentration levels: 5, 10, 15, 20, 25, and 30 ppm. Figure 4a shows the correlation between the peak area and polysorbate concentration by least-squares linear regression. The results for correlation of determination are greater than 0.99 for both PS20 and PS80. The slope for PS80 is larger than that for PS20 which is probably due to the fact that PS80 has longer fatty acid chains compared with PS20 and hence higher response on CAD. The y-intercept values are positive which is caused by the interference from the mobile phase gradient step. However, as discussed earlier, this interference is cancelled out during the multi-point calibration.
The correlation of peak area versus concentration becomes nonlinear when polysorbate concentration is extended to 100 ppm. As shown in Figure 4b, additional three levels: 50, 75, and 100 ppm, are evaluated, and quadratic fittings are needed for the calibration. This is typical when using CAD for the quantitation.
Accuracy/recovery: Accuracy was evaluated by a recovery study. PS20 and PS80 stock solutions were spiked in peptide solutions and the measured polysorbate concentrations were compared with their theoretical values. Three levels were performed: 10 ppm, 20 ppm, and 30 ppm. As shown in Table 4, all recovery values ranged from 90% to 110% which are acceptable for the intended purpose of the method.
| Spiking Levels | HPLC-CAD system A | HPLC-CAD system B | Intermediate Precision | ||||
|---|---|---|---|---|---|---|---|
| Measured Conc (ppm) | % Recovery | % RSD | Measured Conc (ppm) | % Recovery | % RSD | % RSD | |
| 10 ppm PS80 | 10.12 | 101.2 | 3.3 | 9.87 | 98.7 | 4.0 | 3.7 |
| 20 ppm PS80 | 20.76 | 103.8 | 1.8 | 19.71 | 98.6 | 1.7 | 3.2 |
| 30 ppm PS80 | 30.18 | 100.6 | 2.3 | 29.43 | 98.1 | 3.6 | 3.1 |
| 10 ppm PS20 | 9.10 | 91.0 | 4.8 | 10.02 | 100.2 | 4.9 | 6.8 |
| 20 ppm PS20 | 19.76 | 98.8 | 2.3 | 20.08 | 100.4 | 2.8 | 2.6 |
| 30 ppm PS20 | 29.43 | 98.1 | 2.2 | 29.77 | 99.2 | 2.7 | 2.4 |
Table 4: Accuracy/recovery, precision, and intermediate precision results for PS20 and PS80 in the spiking study.
Precision and intermediate precision: Precision was evaluated by making six replicate injections of the spiked samples prepared in the recovery study. The experiment was repeated on a different HPLC-CAD system on a different day and the pooled data was used to evaluate intermediate precision. As shown in Table 4, precision results are within 5% RSD and intermediate precision results are within 7% RSD, which are acceptable for the intended purpose of the method.
Similarly, acceptable accuracy/recovery, precision, and intermediate precision results are obtained at 50 ppm and 100 ppm levels for both PS20 and PS80 against the quadratic fitting calibration curves (data not shown).
Solution stability: Solution stability was evaluated using PS20 and PS80 standard solutions at the concentration of 20 ppm. These two solutions were stored at room temperature (protected from light) for 28 days and assayed against freshly prepared standards periodically. As shown in Table 5, the relative differences of the assayed results were not more than ± 5% compared with the initial value, indicating that both PS20 and PS80 are stable for 28 days at room temperature.
| Day | PS20 | PS80 | ||
|---|---|---|---|---|
| Conc (ppm) | % Diff from Day 0 | Conc (ppm) | % Diff from Day 0 | |
| 0 | 20.0 | 0.0 | 20.0 | 0.0 |
| 1 | 20.3 | 1.5 | 20.5 | 2.5 |
| 3 | 20.7 | 3.5 | 20.4 | 2.0 |
| 7 | 19.7 | -1.5 | 19.4 | -3.0 |
| 14 | 20.1 | 0.5 | 19.3 | -3.5 |
| 28 | 19.9 | -0.5 | 19.7 | -1.5 |
Table 5: Solution stability for PS20 and PS80 standards.
Evaluation of polysorbate and m-Cresol compatibility
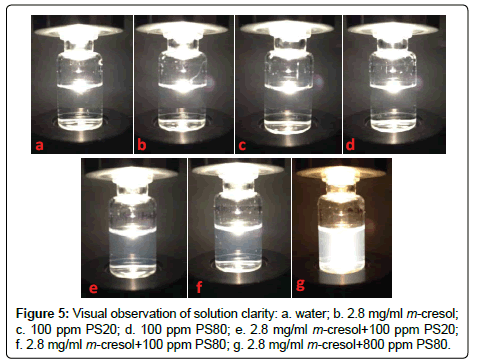
It is well accepted by pharmaceutical scientists that m-Cresol is not compatible with non-ionic surfactants [3], such as PS20 and PS80. As shown in Figure 5, water, m-Cresol, PS20, and PS80 solutions are clear by visual observation. However, the m-Cresol solution turns slightly turbid when 100 ppm of PS20 or PS80 was added, and becomes much more turbid when mixed with 800 ppm of PS80. This phenomenon confirms the incompatibility issue between m-Cresol and polysorbate, but also indicates that the incompatibility may be dependent on the polysorbate concentration. Although the interaction between m-Cresol and polysorbate is yet not well understood, the focus of this paper is to study if m-Cresol is compatible with trace levels of polysorbate, and if trace levels of polysorbate can improve the stability of peptide formulation.
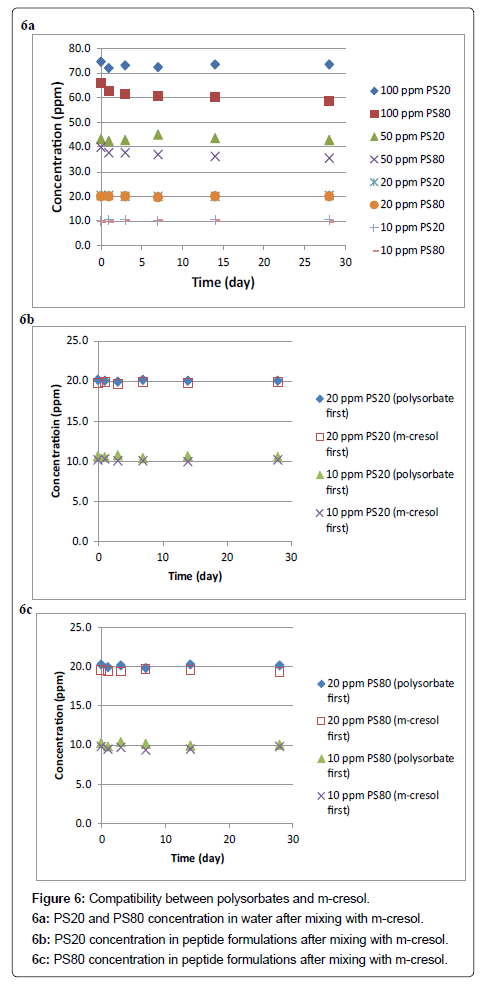
The compatibility between polysorbate and m-Cresol was first evaluated in water at various polysorbate concentrations. In this experiment, 54.4 μl (56 mg) of m-Cresol was added into 20 ml of PS20 and PS80 standard solutions, respectively, at the concentrations of 10, 20, 50 and 100 ppm. No obvious precipitation was observed after the mixing. The polysorbate concentration in each solution was then determined for 28 days, and the results are shown in Figure 6a. At the 50 and 100 ppm levels, it is obvious that both the PS20 and PS80 concentrations dropped immediately after mixing with m-Cresol. PS20 showed a 26 ppm loss at the 100 ppm level, a relative loss of 26%, and a 7 ppm loss at the 50 ppm level, a relative loss of 14%. PS80 showed a 34 ppm loss at the 100 ppm level, a relative loss of 34%, and a 10 ppm loss at the 50 ppm level, a relative loss of 20%. More relative losses were found for both PS20 and PS80 at the 100 ppm level compared with at the 50 ppm level, indicating that incompatibility between polysorbate and m-Cresol is dependent on the polysorbate concentration. At both levels, PS80 had more losses than PS20. Additionally, PS80 concentration continued to drop slightly over the 28-day testing period, while PS20 concentration kept relatively constant after the initial loss. These results indicate that PS80 is less compatible with m-Cresol compared with PS20. On the other hand, at the 10 and 20 ppm levels, no obvious loss of polysorbate was observed for both PS20 and PS80. It confirms that the incompatibility between polysorbate and m-Cresol is dependent on the polysorbate concentration.
The compatibility between polysorbate and m-Cresol was then evaluated in peptide solutions with the polysorbate concentration at 10 ppm and 20 ppm only. Two sets of samples were collected in this experiment based on the order to add polysorbate and m-Cresol to make the final peptide formulations. As shown in Figures 6b and 6c, no obvious loss of polysorbate was found for both PS20 and PS80 for a time period of 28 days, and the order to add polysorbate and m-Cresol had no observable impact. This experiment confirms that both PS20 and PS80 are compatible with m-Cresol when the polysorbate concentration is not greater than 20 ppm.
Evaluation of peptide stability with agitation study
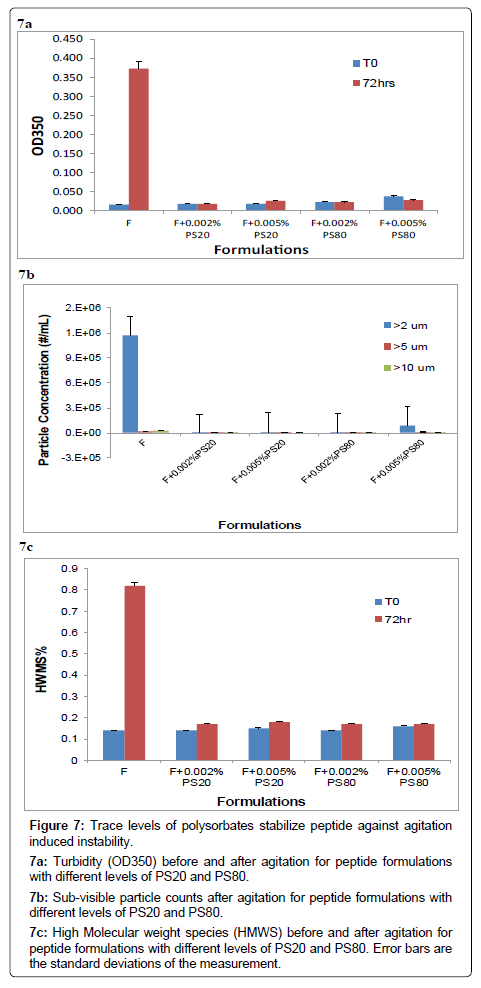
Previous experiments have demonstrated that polysorbate and m-Cresol are compatible in the peptide solution when the polysorbate concentration was only at a trace level, e.g., 20 ppm. This experiment studies if adding trace levels of polysorbate in the peptide solution can stabilize the peptide against agitation induced aggregation and fibrillation. Peptide formulations were prepared with 2.8 mg/ml m-Cresol then spiked with PS20 and PS80, respectively, at 20 ppm (0.002%) and 50 ppm (0.005%) respectively. These peptide solutions were then subject to reciprocal shaking at 300 rpm for three days at 30°C. Various testings were performed to assess the aggregation and fibrillation of the solutions before and after the agitation. As shown in Figure 7a, turbidity was determined using UV spectroscopy at 350 nm. At T0, the turbidity was slightly higher for the formulation with 50 ppm PS80. This is consistent with the previous observation that PS80 was slightly incompatible with m-Cresol at 50 ppm and above. After agitation for three days, all solutions spiked with polysorbate did not show an increase of turbidity, while the turbidity in the formulation without polysorbate increased dramatically. Figure 7b shows the sub-visible particle concentration in different peptide formulations after agitation. Again, particle concentration was the highest for the formulation without polysorbate. At 50 ppm PS80 was slightly incompatible with m-Cresol hence exhibit some increase of particles in the range of 2 to 5 μm. This observation also suggests that sub-visible particles may have formed when mixing 50 ppm PS80 with 2.8 mg/ ml m-Cresol and the particle size is in the range of 2 to 5 μm. Figure 7c reports the percentages of high molecular weight species (HMWS%) from the SEC analysis. After agitation, the only solution that had an obvious increase of HMWS% is the formulation without polysorbate. Table 6 shows the fibrils count before and after agitation in peptide formulations with different levels of PS20 and PS80. Again, only the formulation without polysorbate showed a dramatic increase of fibrils. All the results in the study indicate that trace levels of PS20 or PS80 can prevent peptide from agitation induced aggregation and fibrillation, and the impact is about the same at the 20 ppm level and 50 ppm level. However, the 20 ppm level is preferred for the formulation as a consequence of incompatibility observed at the 50 ppm level with respect to both polysorbate loss and higher sub-visible particulates counts. Although the current finding that trace levels of polysorbate can prevent protein from aggregation and fibrillation is specific to the peptide studied in this paper, it is highly likely that our discovery can apply to other peptides such as insulin molecules. This is because protein/peptide aggregation and fibrillation in most cases starts with partial unfolding followed by self-association while the presence of polysorbate can block the association of partially unfolded species by surface coating. Further studies of a broader range of peptides and proteins, however, are warranted to expand the application of our finding.
Figure 7: Trace levels of polysorbates stabilize peptide against agitation induced instability.
7a: Turbidity (OD350) before and after agitation for peptide formulations with different levels of PS20 and PS80.
7b: Sub-visible particle counts after agitation for peptide formulations with different levels of PS20 and PS80.
7c: High Molecular weight species (HMWS) before and after agitation for peptide formulations with different levels of PS20 and PS80. Error bars are the standard deviations of the measurement.
References
- Meyer BK, Ni A, Hu B, Shi L (2007) Antimicrobial preservative use in parenteral products: past and present. J Pharm Sci 96: 3155-3167.
- Akers MJ (2002) Excipient-drug interactions in parenteral formulations. J Pharm Sci 91: 2283-2300.
- Rowe RC, Sheskey PJ, Owen SC (2006) Handbook of Pharmaceutical Excipients (5thedn.) Pharmaceutical Press, pp. 208-210.
- Bloom CR, Heymann R, Kaarsholm NC, Dunn MF (1997) Binding of 2,6- and 2,7-dihydroxynaphthalene to wild-type and E-B13Q insulins: dynamic, equilibrium, and molecular modeling investigations. Biochemistry 36: 12746-12758.
- Bloom CR, Kaarsholm NC, Ha J, Dunn MF (1997) Half-site reactivity, negative cooperativity, and positive cooperativity: quantitative considerations of a plausible model. Biochemistry 36: 12759-12765.
- Anderson NH, Girling J (1982) Determination of Polyoxyethylene Non-Ionic Surfactants at Trace Levels. Analyst 107: 836-838.
- Wenger MD, Bowman AM, Thorsteinsson MV, Little KK, Wang L, et al. (2005) An automated homogeneous method for quantifying polysorbate using fluorescence polarization. Analytical Biochemistry 33: 48-54.
- Hu M, Niculescu M, Zhang XM, Hui A, et al. (2003) High-performance liquid chromatographic determination of polysorbate 80 in pharmaceutical suspensions. Journal of Chromatography A 984: 233-236.
- Oszi Z, Petho G (1998) Quantitative determination of polysorbate 20 in nasal pharmaceutical preparations by high-performance liquid chromatography. Journal of Pharmaceutical and Biomedical Analysis 18: 715-720.
- Fekete S, Ganzler K, Fekete J (2010) Fast and sensitive determination of Polysorbate 80 in solutions containing proteins. J Pharm Biomed Anal 52: 672-679.
- Hewitt D, Zhang T, Kao YH (2008) Quantitation of polysorbate 20 in protein solutions using mixed-mode chromatography and evaporative light scattering detection. J Chromatogr A 1215: 156-160.
- Allgeier MC, Nussbaum MA, Risley DS (2003) Comparison of an evaporative light-scattering detector and chemiluminescent nitrogen detector for analyzing compounds lacking a sufficient UV chromophore. Lc Gc North America 21: 376.
- Kerwin BA (2008) Polysorbates 20 and 80 used in the formulation of protein biotherapeutics: structure and degradation pathways. J Pharm Sci 97: 2924-2935.
- Hewitt D, Alvarez M, Robinson K, Ji J, Wang YJ, et al. (2011) Mixed-mode and reversed-phase liquid chromatography–tandem mass spectrometry methodologies to study composition and base hydrolysis of polysorbate 20 and 80. Journal of Chromatography A 1218: 2138-2145.
- He Y, Friese OV, Schlittler MR, Wang Q, Yang X, et al. (2012) On-line coupling of size exclusion chromatography with mixed-mode liquid chromatography for comprehensive profiling of biopharmaceutical drug product. J Chromatogr A 1262: 122-129.
Relevant Topics
Recommended Journals
Article Tools
Article Usage
- Total views: 25853
- [From(publication date):
June-2015 - Nov 21, 2024] - Breakdown by view type
- HTML page views : 19942
- PDF downloads : 5911

