Research Article Open Access
A Comparison Between Two Assays for the Redox Status in Plasma
Eugene Jansen1*, Piet Beekhof1, Nicole Schupp2, Moritz Kreutzmann2 and Bettina Kraus3
1Centre for Health Protection, National Institute for Public Health and the Environment, Bilthoven, The Netherlands
2Institute of Toxicology, University of Düsseldorf, Germany
3Department of Internal Medicine I, University Hospital Würzburg, Germany
- *Corresponding Author:
- Eugene Jansen
Centre for Health Protection
National Institute for Public Health and the Environment
Bilthoven, The Netherlands
Tel: +31-30-2742940
E-mail: eugene.jansen@rivm.nl
Received date: December 20, 2016; Accepted date: January 04, 2017; Published date: January 09, 2017
Citation: Jansen E, Beekhof P, Schupp N, Kreutzmann M, Kraus B (2017) A Comparison Between Two Assays for the Redox Status in Plasma. J Anal Bioanal Tech 8:342. doi: 10.4172/2155-9872.1000342
Copyright: © 2017 Jansen E, et al. This is an open-access article distributed under the terms of the Creative Commons Attribution License, which permits unrestricted use, distribution, and reproduction in any medium, provided the original author and source are credited.
Visit for more related articles at Journal of Analytical & Bioanalytical Techniques
Abstract
In the present study, two commercial assays for the redox status are compared and evaluated, the SH groups in proteins (SHp) and the total thiol levels (TTL). Both assays are colorimetric endpoint reactions and have been adapted for use on an automatic clinical analyzer. Both assays performed well by giving comparable results in plasma samples. A good correlation with a correlation coefficient (R2) of 0.889 was found between the two assays. However, for some pathological specimens, especially highly lipemic samples, the SHp assay performed better than the TTL assay. When plasma samples with a high lipemic index were omitted, the correlation between the two assays was even better with an R2 of 0.942.
In conclusion, both assays for the redox status performed well, but the SHp assay can also be used in high lipemic samples.
Keywords
Colorimetry; Redox; Human serum; Lipemic index
Introduction
The redox status is an important tool in determining the physiological state of the body, especially for the elderly [1-4]. A reflection of the redox status in the circulation can be measured by the level of free thiol groups in proteins in serum or plasma samples. There are several assays described in the literature for the evaluation of the redox status in serum or plasma. In these simple assays, a reaction of thiol groups of proteins takes place with a chromogen. The most used assay is based on the reaction of 5,5′-dithiobis-(2-nitrobenzoic acid) (DTNB), with thiol groups which can be easily performed with homemade materials [5,6]. However, for quality control during large-scale studies, commercially available assays are preferred due to the longterm delivery and stability of the assay components and the availability of quality control materials. This test can be performed either by high performance liquid chromatographic methods [7-9] or in micro plate format [10] and was also programmed and applied to clinical analyzers [11-14]. The use of auto-analyzers allows measurement of large sets of samples in epidemiological studies under the required quality during longer periods. Another advantage is the possibility to combine the assay with the measurement of other biomarkers in the same small volume of sample [15].
In the present paper, we have compared the performance of two commonly used assay systems from two commercial companies which are based on the DTNB reaction. The performance was tested in a number of human plasma samples from a clinical study on hypertension.
Materials and Methods
Blood was collected of sixty hypertensive patients which were included in the BEST-IN-TENSION Registry (Benefit for diaSTolic heart failure from Intensified management of refractory hyperTENSION), located at the Comprehensive Heart Failure Center in Würzburg. A number of 54 controls were included from the MyStIC (Myocardial Sodium content In Cardiac disease) study. Informed consent was obtained from all participants.
The blood samples were processed for EDTA-plasma and aliquots were stored at -80°C until analysis. The measurements of the total thiols in proteins were carried out with the SHp and the TTL test. Both methods are rather similar and based on the reaction of protein thiols with DTNB, giving a colored reaction product with a absorbance maximum at 412 nm. The results of the tests have been expressed in μ mol/L. Both tests have been adapted for use in the D × C500 clinical auto-analyzer (Beckman-Coulter, Woerden, the Netherlands). The SHp test (SH groups in proteins) was obtained from Diacron, Grosseto, Italy. The TTL assay (total thiol levels) was obtained from RelAssay, Gaziantep, Turkey. All data have been performed as single measurements. The intra-assay variation (%) of each assay was determined with two control materials. A routinely used human serum sample and a quality control (QC) sample from each of the manufacturers. The coefficient of variation (CV) for the SHp assay was 2.6% (at a level of 777 μ mol/L) and 3.1% (at a level of 466 μ mol/L) as determined with both samples, respectively (n=9). The coefficient of variation (CV) for the TTL assay was 2.5% (at a level of 623 μ mol/L) and 2.8% (at a level of 1027 μ mol/L) as determined with both samples, respectively (n=9).
Results
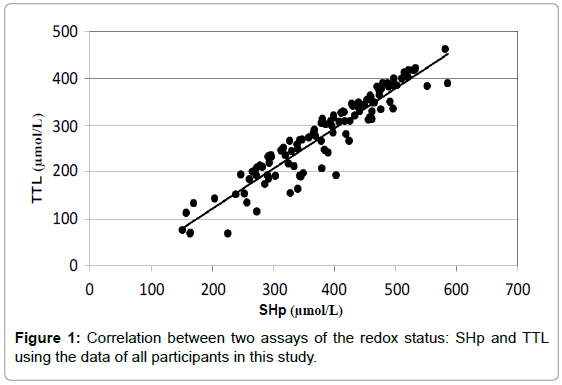
Both of these assays for the redox status gave similar results with respect to the reproducibility. The intra-assay coefficients of variation were almost similar for both assays. The average CV was 2.9% for the SHp assay and 2.7% for the TTL test. When all samples were included, the correlation between the two assays was rather good. In Figure 1, the correlation for all samples is shown. The correlation coefficient (R2) is 0.889 with the equation of the correlation curve of 'y=0.86x-49'. This means that the SHp assay exhibited slightly higher average concentrations (14% higher) than the TTL assay, probably due to the calibration of both commercial assays.
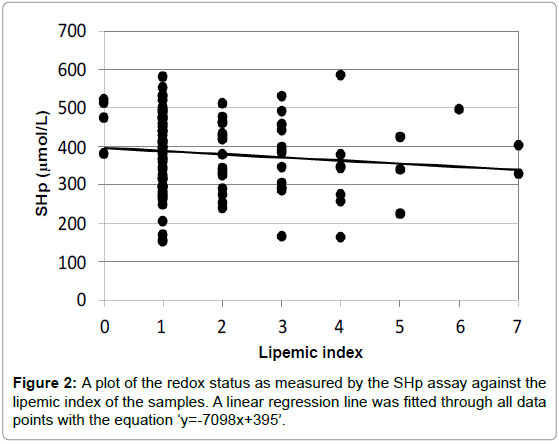
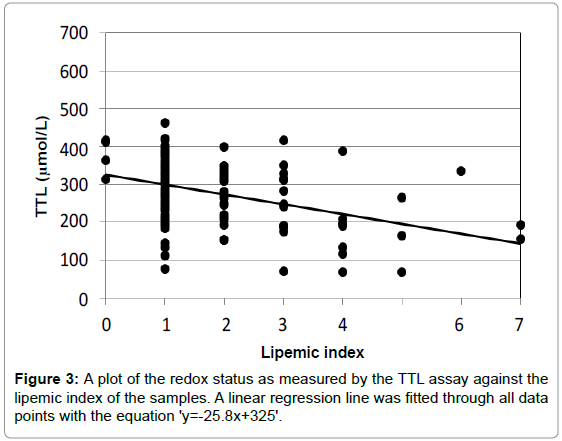
Both of these assays for the redox status were adapted for use in a clinical auto-analyzer to be able to conduct large series of measurements of serum or plasma samples in epidemiological studies [8]. The autoanalyzer also measured three different indices for the assessment of the quality of the plasma samples, the hemolytic, icteric and lipemic index. Each index has an arbitrary range from 0 (low disturbance) to 10 (high disturbance). Each biomarker has for each of the three indices a certain cut-off value, above which the result of the measurement of the biomarker is no longer reliable. It appeared that both redox assays were not very sentitive to the hemolytic and icteric index, but rather sensitive for the lipemic index. The higher the lipemic index, the lower the measurements of the redox status. This is shown in Figures 2 and 3.
In Figure 2, the lipemic indices were plotted against the measurements with the SHp assay of all plasma samples. It turned out that there was a slight reduction of SHp levels with increasing lipemic index values with a slope of -7.98. The p-value of the regression line was 0.244 (non-significant).
For the TTL assay, a much larger deviation was observed at higher values of the lipemic index as shown in Figure 3. Here the slope is -25.8 which means a substantial reduction of the TTL values with increasing lipemic index. Here the p-value of the regression line was 1.7*E-5
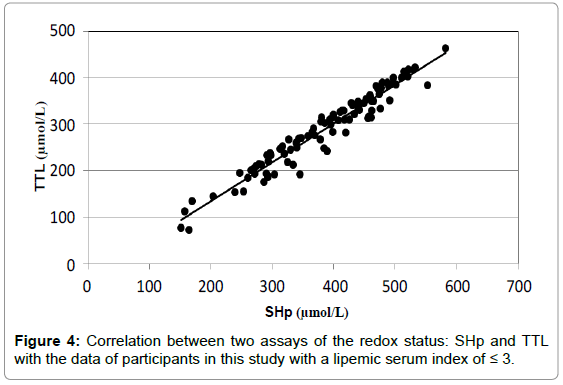
If the plasma samples with lipemic index greater than 3 were left out of the analysis, a much better correlation with a correlation coefficient (R2) of 0.942 is found between the two assays with an equation of the correlation curve of 'y=0.84x-32.8' as is shown in Figure 4.
Discussion
The redox status in elderly is an important biomarker for the assessment of the general state of health [16-18]. With increasing age the redox status decreases, which making the elderly more prone for oxidative stress related processes [19]. The redox status was measured using a simple colorimetric assay based on a reaction of the free SHgroups of the cysteine side chains in proteins with DTNB. The assay performance is suitable for automated clinical analyzers. The assay determines all thiols, but in serum or plasma the protein thiols are the main components [20]. The assay showed a good storage stability of the human serum and plasma samples at -80°C for longer periods [21]. In addition, the short-term stability is also very good which makes it easier in day-to-day handling of samples [22].
In the present report, two commercial assays have been compared with respect to linearity and sensitivity to pathological samples. Both assays are not very sensitive to hemolytic and icteric samples. But with regard to lipemic samples, often as result of a high concentration of triglycerides, both assays behave differently. It was found that the SHp assay is less sensitive to the influence of lipemic samples compared to the TTL assay. A linear regression line plotted through data points against the lipemic index, revealed a much larger decline in the TTL assay than in the SHp assay. The regression line of the TTL assay vs. the lipemic index for values from 1 to 7, showed a decay in the measurements of the TTL assay of 53% (statistically significant), whereas in the SHp assay this decrease is only 12% (statistically not significant), as shown in Figures 2 and 3.
It is concluded that both assays for the redox status are performing very well and that they can be applied in large-scale studies. The only difference is the better performance of the SHp assay with high lipemic plasma samples.
References
- Hack V, Breitkreutz R, Kinscherf K, Röhrer H, Bärtsch P, et al. (1998) The redox state as a correlate of senescence and wasting and as a target for therapeutic intervention. Blood 92: 59-67.
- Era S, Kuwata K, Imai H, Nakamura K, Hayashi T, et al. (1995) Age-related change in redox state of human serum albumin. Biochim Biophys Acta 1247: 12-16.
- Schöttker B, Saum KU, Jansen EHJM, Boffetta P, Trichopoulou A, et al. (2015) Oxidative Stress Markers and All-Cause Mortality at Older Age: A Population-Based Cohort Study. J Gerontol A Biol Sci Med Sci 70: 518-524.
- Saum KU, Dieffenbach AK, Jansen EHJM, Schöttker B, Holleczek B, et al. (2015) Association between oxidative stress and frailty in an elderly German population: results from the ESTHER cohort study. Gerontol 61: 407-415.
- Ellman CL (1959) Tissue sulfhydryl groups. Arch Biochem Biophys 82: 70-77.
- Hu ML (1994) Measurement of protein thiol groups and glutathione in plasma. Meth Enzymol 233: 380-385.
- Jacobsen DW, Gatautis VJ, Green R, Robinson K, Savon SR, et al. (1994) Rapid HPLC determination of total homocysteine and other thiols in serum and plasma: sex differences and correlation with cobalamin and folate concentrations in healthy subjects. Clin Chem 40: 873-881.
- Pfeiffer CM, Huff DL, Gunter EW (1999) Rapid and accurate HPLC assay for plasma total homocysteine and cysteine in a clinical laboratory setting. Clin Chem 45: 290-292.
- Bald E, Chwatko G, GŬ?owacki R, KuŬ?mierek K (2004) Analysis of plasma thiols by high-performance liquid chromatography with ultraviolet detection. J Chromatogr A 1032: 109-115.
- Yang Y, Xiangming G (2015) Rapid and thiol-specific high-throughput assay for simultaneous relative quantification of total thiols, protein thiols, and nonprotein thiols in cells. Anal Chem 87: 649-655.
- Da Costa CM, Rita Dos CC, Santos CCD, Lima ES (2006) A simple automated procedure for thiol measurement in human serum samples. J Bras Patol Med Lab 42: 345-350.
- Schöttker B, Brenner H, Jansen EHJM, Gardiner J, Peasey A, et al. (2013) Evidence for the Free Radical/Oxidative Stress Theory of Ageing from the CHANCES consortium: A meta-analysis of individual participant data. BMC Medicine 13: 300.
- Jansen E, Ruskovska T (2015) Serum biomarkers of (anti)oxidant status for epidemiologische studies. Int J Mol Sci 16: 27378-27390.
- Schöttker B, Saum KU, Jansen EHJM, Holleczek B, Brenner H (2016) Associations of metabolic, inflammatory and oxidative stress markers with total morbidity and multi-morbidity in a large cohort of older German adults. Age Ageing 45: 127-135.
- Jansen E, Beekhof P, Tamosiunas A, Luksiene D, Baceviciene M (2015) Biomarkers of oxidative stress and redox status in a short-term low-dosed multivitamin and mineral supplementation study in two human age groups. Biogerontology 16: 645-653.
- Banne AF, Amiri A, Pero RW (2003) Reduced level of serum thiols in patients with a diagnosis of active disease. J Anti Aging Med 6: 327-334.
- Andriollo-Sanchez M, Hininger-Favier I, Meunier N, Venneria E, O’Connor JM, et al. (2005) Age-related oxidative stress and antioxidant parameters in middle-aged and older European subjects: the ZENITH study. Eur J Clin Nutr 59: S58-S62.
- Giustarini D, Dalle-Donne I, Lorenzini S, Milzani A, Rossi R (2006) Age-related inשּׁ?uence on thiol, disulשּׁĀde, and protein-mixed disulשּׁĀde levels in human plasma. J Gerontol Biological Sciences 61A: 1030-1038.
- Jansen EHJM, Ruskovska T (2013) Comparative analysis of plasma (anti) oxidative status parаmeters in healthy persons. Int J Mol Sci 14: 6106-6115.
- Iciek M, Chwatko G, Lorenc-Koci E, Bald E, Wlodek L (2004) Plasma levels of total, free and protein bound thiols as well as sulfane sulfur in different age groups of rats. Acta Biochim Polonica 51: 815-824.
- Jansen EHJM, Beekhof PK, Viezeliene D, Muzakova V, Skalicky J (2015) Long term stability of cancer biomarkers of oxidative stress, redox status, homocysteine, CRP and liver enzymes in human serum. Biomarkers in Medicine 9: 425-432.
- Jansen EHJM, Beekhof PK, Cremers JWJM, Viezeliene D, Muzakova V, et al. (2013) Short-term stability of biomarkers of oxidative stress and antioxidant status in human serum. ISRN Biomarkers Article ID 316528.
Relevant Topics
Recommended Journals
Article Tools
Article Usage
- Total views: 3633
- [From(publication date):
February-2017 - Jul 09, 2025] - Breakdown by view type
- HTML page views : 2727
- PDF downloads : 906


