Research Article Open Access
3-T Magnetic Resonance Diffusion-Weighted Imaging (DWI) for Characterization of Hepatic Masses
Abdulghaffara W1, Nasr M1* and Shahin W21Medical Imaging Department, Mansoura University, Egypt
2Gastroenterology Department, Banha University, Egypt
- *Corresponding Author:
- Nasr M
Medical Imaging Department, Mansoura University, Egypt
Tel: +00966590030730
E-mail: mh_4805@yahoo.com
Received date: December 23, 2016; Accepted date: January 24, 2017; Published date: January 30, 2017
Citation: Abdulghaffara W, Nasr M, Shahin W (2017) 3-T Magnetic Resonance Diffusion-Weighted Imaging (DWI) for Characterization of Hepatic Masses. OMICS J Radiol 6:249. doi: 10.4172/2167-7964.1000249
Copyright: © 2017 Abdulghaffara W, et al. This is an open-access article distributed under the terms of the Creative Commons Attribution License, which permits unrestricted use, distribution, and reproduction in any medium, provided the original author and source are credited.
Visit for more related articles at Journal of Radiology
Abstract
Objective: To evaluate the role of DWI and ADC in differentiating benign from malignant hepaticmasses
Materials and methods: Forty-one patients with fifty-two focal hepatic masses were included in our study. MRI was done using coronal T2-weighted single-shot turbo spin-echo, breath hold axial 3-D gradient-echo, breath hold 2- D gradient-echo in and out-of-phase, respiratory-triggered axial turbo spin-echo T2 sequence with fat saturation, followed by free breathing Diffusion-weighted MR imaging using a single-shot spin-echo echo planar imaging sequence and finally triphasic -MRI.
Results: Forty-one patients (Fifty-two lesions) were included in our study. Twenty-three lesions were benign; eight of them were cysts (mean ADC values of 3.15 ± 0.34 × 10⁻³ mm2/s) and fifteen lesions were hemangiomas (mean ADC values of 2.10 ± 0.25 × 10⁻³ mm2/s). Twenty-nine lesions were malignant; twelve HCC lesions (mean ADC values of 1.10 ± 0.32 × 10⁻³ mm2/s) and seventeen masses were metastasis (mean ADC values of 0.96 ± 0.23 × 10⁻³ mm2/s). Sensitivity and specificity of DWI in differentiating malignant from benign hepatic masses were 96.6% and 95.7% respectively.
Conclusion: DWI is an easy technique to obtain and to be evaluated. ADC values can differentiate benign from malignant liver masses with high sensitivity and specificity.
Keywords
Magnetic resonance imaging; Diffusion weighted imaging; Apparent diffusion co-efficient; Liver neoplasms
Introduction
The incidence of discovering hepatic focal lesions during routine radiological examination parallels growth in imaging utilization. Most of the hepatic focal lesions arising in non-cirrhotic livers are benign. Hemangiomas, focal nodular hyperplasia, and adenomas are the most common solid benign lesions [1,2]. The most common malignant lesions in non-cirrhotic livers are metastases. The incidence of hepatocellular carcinoma and intra-hepatic cholangiocarcinoma is more noted on top of chronic liver diseases. Regarding benign lesions; maximizing specificity and accuracy of cross-sectional imaging of these lesions is paramount in avoiding unnecessary biopsies, which may lead to a post-procedural morbidity of 2.0% to 4.8% and mortality of 0.05% [3,4].
Ultrasound, Computed Tomography (CT), and magnetic resonance imaging (MRI) are the main liver imaging modalities. Comparing contrast-enhanced ultrasound, CT, and MRI in evaluating incidental focal liver lesions, most of the published series reported similar diagnostic performance with specificities ranging from 82-89% and no significant difference in the summary characteristic between modalities [4,5].
Over the last few years, several studies have investigated the role of DWI in the detection of focal liver lesions. DWI is superior to T2-weighted sequences [6-9] and to super paramagnetic iron oxide enhanced MR imaging in the detection and characterization of hepatic focal lesions [10]. The detection of small focal lesions seems to be significantly improved by DWI [6,8,10]. High SNRs and high lesion-to- liver signal intensity ratios are seen at low b values alleviating the depiction of focal liver lesions. In addition, the ‘black blood effect’ of diffusion-weighted images makes it easier to distinguish small focal hepatic lesions from intra-hepatic vessels. Furthermore, DWI seems to improve the perceptibility of focal hepatic lesions, especially of hepatocellular carcinomas (HCCs) in patients with liver cirrhosis as the heterogenecity and increased signal intensity of the cirrhotic liver parenchyma as a result of nodular regeneration, fibrosis, and scarring appears became less pronounced on DWI compared to T2-weighted images [11].
The differential diagnosis of malignant and benign focal hepatic lesions remains a diagnostic challenge; however, to improve the diagnosis of these lesions, new methods for existing modalities, such as MRI, CT, angiography, and ultrasonography are being developed. Recently, some studies have reported that the Apparent Diffusion Coefficient (ADC), which is one of calculated parameters of DWI, might be useful in differentiating benign and malignant lesions in the liver [12].
The diffusion coefficient is related to the molecular mobility of water molecules so reflects tissue properties, such as the size of the extracellular space (i.e., the rate of relatively unhindered moving water protons), viscosity and cellularity [13]. Therefore, determination of diffusion coefficients has been shown to be helpful for the characterization of focal and diffuse diseases of the liver [14,15].
Objective
The aim of our study was to assess the role of DWI and the ADC in differentiating between benign and malignant hepatic masses.
Materials and Methods
Patient populations
Between February 2011 and June 2013, Forty-one patients (25 males and 16 females with age range, 21–67 years; mean age, 49 years) with focal hepatic masses were included in our study. We apply our study on all patients referred to our department for MRI of the liver at the period of the study. Patients were imaged using conventional MRI, DWI and triphasic-MRI before biopsy of liver masses. Written informed consent was obtained from all patients before MRI.
MRI techniques
Magnetic resonance imaging was performed using a 3-T unit (Magnetom Skyra; Siemens Medical Solutions, Germany), equipped with high-performance gradients and a six-element phased-array body coil. Before diffusion-weighted imaging the following sequences are done:
1. Coronal T2-weighted half-Fourier single-shot turbo spin-echo (HASTE) using repetition time (TR)=1200 ms, echo time (TE)=95 ms, flip angle (FA)=150, matrix=256 × 154, slice thickness=5 mm, interslice gap=30%, field of view (FOV)=40 cm, and averages=1;
2. Breath hold axial 3-D gradient-echo T1-weighted (volumetric interpolated breath-hold examination=VIBE) using TR=4.96 ms, TE=2.38 ms, FA=10, matrix=256 × 166, slice thickness=3.0 mm, interslice gap=20%, FOV=40 cm, and averages=1;
3. 2-D gradient-echo T1 in-phase and out-of-phase using TR=124 ms, in-phase TE=4.77 ms, out-of-phase TE=2.38 ms, FA=70, matrix=256 × 168, slice thickness=5 mm, interslice gap=30%, FOV=40 cm, and averages=1;
4. Axial respiratory-triggered, turbo spin-echo T2-weighted sequence with fat saturation using TR=3800 ms, TE=85 ms, FA=150, matrix=320 × 320, slice thickness=5 mm, interslice gap=30%, FOV=40 cm, and averages=1.
Diffusion-weighted MR imaging was performed before dynamic imaging, using a single-shot spin-echo Echo Planar Imaging (EPI) sequence with the b factors of 50, 400, and 800 s/mm2 along the three orthogonal directions.
To improve the signal-to-noise ratio and for patient convenience, DWI under free-breathing was performed. The sequence was obtained free breathing using the following technical parameters TR=6200 ms, TE=95 ms, matrix=125 × 192, slices thickness=5 mm with inter-slice gap=20%, FOV=40 cm, and the average=4.
Acquisition time for the entire liver using the three different b factors was about 3.0 min. The parallel imaging algorithms (GRAPPA), with an acceleration factor of 2, were added to reduce the acquisition time. Spectral fat saturation was employed systematically to suppress the chemical-shift artifacts. ADC maps regarding isotropic images were automatically acquired and all mean ADCs of the lesions were measured on those maps.
After determination of the optimal timing for the arterial phase imaging, using the timing bolus technique, dynamic contrast-enhanced imaging was obtained after the administration of a bolus injection of the gadopentetatedimeglumine (0.1 mmol/kg of Magnevist), at a rate of 2 mL/s.
We used a 3D gradient echo sequence (VIBE) with ultrafast image reconstruction, using the parallel imaging algorithms (Generalized Auto-calibrating Partially Parallel Acquisitions [GRAPPA] factor=2) in the axial plane using the following parameters; Repetition Time [TR]=4.96 ms, Echo Time [TE]=2.38 ms, flip angle=10°, matrix=256 × 146, field of view [FOV]=40 cm, slice thickness=3 mm, during a 17 s breath-holding period.
A dynamic series consisted of one pre-contrast series, followed by three successive post-contrast series, including an early arterial, late arterial, and portal phase imaging, at 31 s intervals (17 s for image acquisition with breath-holding and 14 s for re-breathing), at the start of each phase imaging followed by a 5-min delayed phase imaging. Triphasic MRI was done in 38 patients and was contraindicated in 3 patients with renal failure on haemodialysis and GFR less than 30 ml/ min.
Benign appearing focal lesions were subjected to follow up for 2 years to assess the stability of the size and appearance of the lesions (after 6 months then after 1 years for cysts and more setting after 2 years follow up for haemangioma).
Biopsy was done for malignant appearing lesions and correlated with the MRI findings.
Results
Fifty-two lesions were detected in the 41 patients included in our study. Twenty-nine lesions were malignant, 12 lesions were HCC and 17 lesions were metastasis according to the final histopathological study and Twenty-three lesions were benign: 8 hepatic cysts and 15 hemangioms according to US, CT, MRI findings and follow-up.
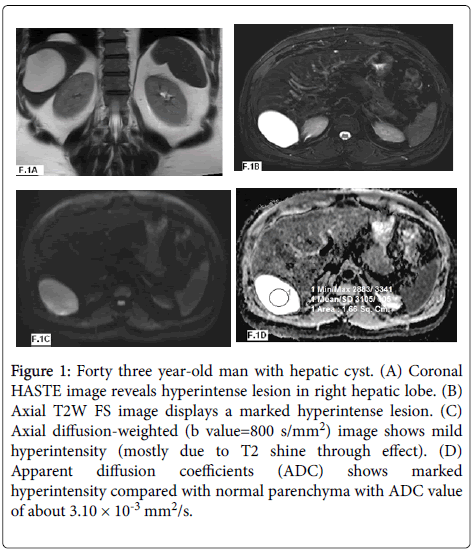
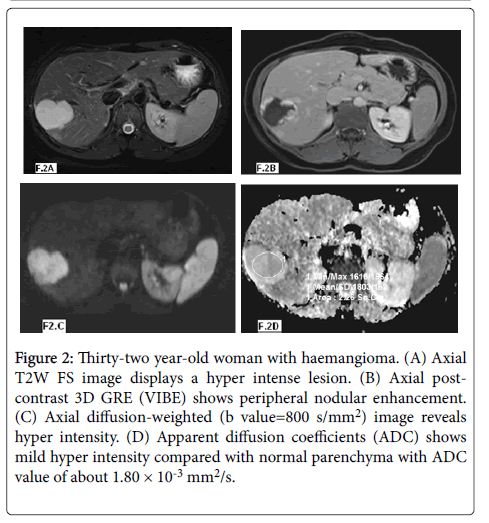
According to the ADC values (Table 1) twenty three lesions were benign with 8 lesions were hepatic cysts (Figure 1) with mean ADC values of 3.15 ± 0.34 × 10⁻³ mm2/s and ADC range of 2.61-3.40 × 10⁻³ mm2/s and fifteen lesions were hemangioms (Figure 2) with mean ADC values of 2.10 ± 0.25 × 10⁻³ mm2/s and ADC range of 1.60-2.50 × 10⁻³ mm2/s.
Figure 1: Forty three year-old man with hepatic cyst. (A) Coronal HASTE image reveals hyperintense lesion in right hepatic lobe. (B) Axial T2W FS image displays a marked hyperintense lesion. (C) Axial diffusion-weighted (b value=800 s/mm2) image shows mild hyperintensity (mostly due to T2 shine through effect). (D) Apparent diffusion coefficients (ADC) shows marked hyperintensity compared with normal parenchyma with ADC value of about 3.10 × 10⁻³ mm2/s.
Figure 2: Thirty-two year-old woman with haemangioma. (A) Axial T2W FS image displays a hyper intense lesion. (B) Axial post-contrast 3D GRE (VIBE) shows peripheral nodular enhancement. (C) Axial diffusion-weighted (b value=800 s/mm2) image reveals hyper intensity. (D) Apparent diffusion coefficients (ADC) shows mild hyper intensity compared with normal parenchyma with ADC value of about 1.80 × 10⁻³ mm2/s.
| Hepatic masses | No. of lesions N= 52 | ADC Values (× 10-3mm2/s) | |
|---|---|---|---|
| Range of ADC | Mean ADC ±SD | ||
| Hepatic cysts | 8 | 2.61- 3.40 | 3.15 ± 0.34 |
| Hemangiomas | 15 | 1.60- 2.50 | 2.10 ± 0.25 |
| Hepatocellualar carcinoma | 12 | 0.91- 176 | 1.10 ± 0.32 |
| Metastasis | 17 | 0.75- 1.25 | 0.96 ± 0.23 |
Table 1: Different ADC values for benign and malignant hepatic masses.
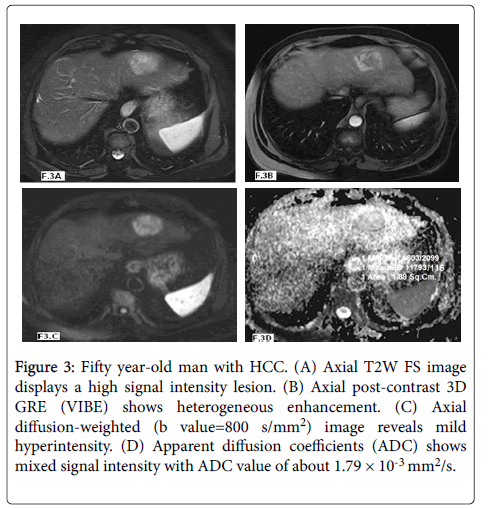
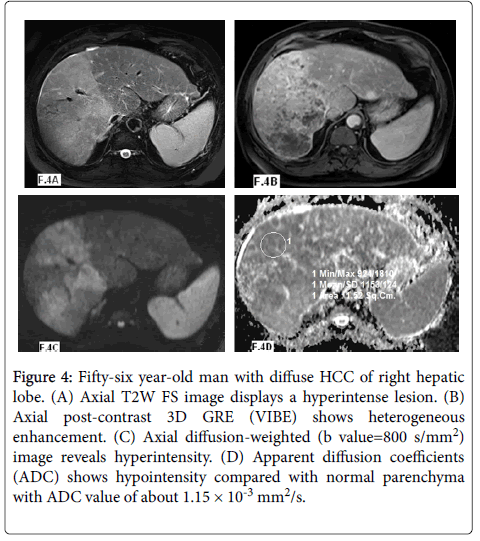
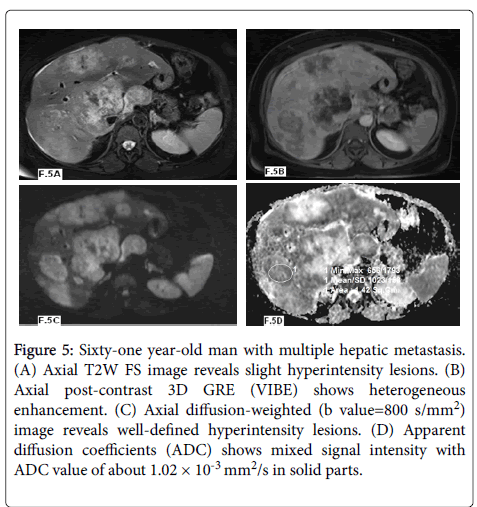
In our study twenty nine lesions were malignant: twelve lesions were HCCs (Figures 3 and 4) and showed mean ADC values of 1.10 ± 0.32 × 10⁻³ mm2/s and ADC range of 0.91-1.76 × 10⁻³ mm2/s and seventeen lesions were metastasis (Figure 5) with mean ADC values of 0.96 ± 0.23 × 10⁻³ mm2/s and ADC range of 0.75-1.25 × 10⁻³ mm2/s.
Figure 3: Fifty year-old man with HCC. (A) Axial T2W FS image displays a high signal intensity lesion. (B) Axial post-contrast 3D GRE (VIBE) shows heterogeneous enhancement. (C) Axial diffusion-weighted (b value=800 s/mm2) image reveals mild hyperintensity. (D) Apparent diffusion coefficients (ADC) shows mixed signal intensity with ADC value of about 1.79 × 10⁻³ mm2/s.
Figure 4: Fifty-six year-old man with diffuse HCC of right hepatic lobe. (A) Axial T2W FS image displays a hyperintense lesion. (B) Axial post-contrast 3D GRE (VIBE) shows heterogeneous enhancement. (C) Axial diffusion-weighted (b value=800 s/mm2) image reveals hyperintensity. (D) Apparent diffusion coefficients (ADC) shows hypointensity compared with normal parenchyma with ADC value of about 1.15 × 10⁻³ mm2/s.
Figure 5: Sixty-one year-old man with multiple hepatic metastasis. (A) Axial T2W FS image reveals slight hyperintensity lesions. (B) Axial post-contrast 3D GRE (VIBE) shows heterogeneous enhancement. (C) Axial diffusion-weighted (b value=800 s/mm2) image reveals well-defined hyperintensity lesions. (D) Apparent diffusion coefficients (ADC) shows mixed signal intensity with ADC value of about 1.02 × 10⁻³ mm2/s in solid parts.
Discussion
Diffusion describes the random (Brownian) motion of water molecules. With a very strong bipolar gradient pulse inserted into either a spin-echo pulse sequence (i.e., Stejskal-Tanner technique) or a gradient echo pulse sequence, MR imaging can be sensitive to the diffusion of water molecules in the tissue [16]. Diffusion restriction increases in highly cellular tissues and decreases in low cellular tissues with large extracellular space or with broken-down cellular membranes [17].
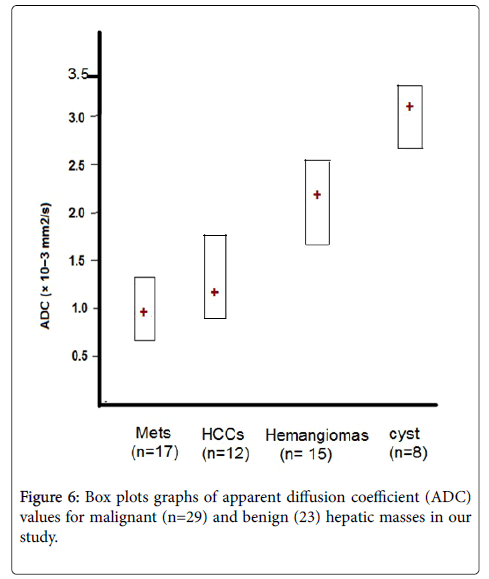
In our study, there is a significant difference in the ADC values between malignant (HCC and metastasis) hepatic masses and benign (cysts and hemangiomas) hepatic masses with low ADC in malignant masses and high ADC value in benign masses (Figure 6). The result of our study is in agreement with other studies had been published concerning the diffusion properties of focal hepatic lesions. Most of the studies revealed that ADC values of benign lesions (cysts and hemangiomas) were significantly higher than those of malignant lesions attributed to high cellularity of malignant masses [14,18,19].
Differences in cellularity between benign and malignant liver lesions resulting in different diffusion properties of water protons within these lesions are reflected by different ADC values measured by DWI. Typically, benign liver lesions like cysts or hemangiomas that are hypocellular compared to liver parenchyma allow relatively unhindered diffusion of water protons resulting in high ADC values (~2 × 10⁻³ mm2/s in hemangiomas, and ~3 × 10⁻³ mm2/s in cysts) compared to low ADC values in hypercellular malignant liver lesions such as metastases or HCCs (1.1–1.3 × 10⁻³ mm2/s in HCCs and 1.1– 1.4 × 10⁻³ mm2/s in metastases) where diffusion of water protons is more restricted [9]. A published study noticed significant difference between ADCs of benign and malignant lesions (2.45 ± 0.96 × 10⁻³ and 1.08 ± 0.50 × 10⁻³ mm2/s respectively). The mean ± SD ADCs (×10-3 mm2/s) of the different groups of lesions were: metastases 0.94 ± 0.60, hepatocellular carcinomas 1.33 ± 0.13, hemangiomas 2.95 ± 0.67 and cysts 3.63 ± 0.56 [14].
In our study, the benign hepatic focal lesions had a mean ADC values of about 2.46 ± 0.28 × 10⁻³ mm2/s and ADC range of about 1.60-3.40 × 10⁻³ mm2/s and the malignant hepatic focal lesions showed a mean ADC values of about 1.02 ± 0.26 × 10⁻³ mm2/s and ADC range of about 0.75–1.76 × 10⁻³ mm2/s. Several studies have identified significantly lower ADC values in malignant compared to benign focal liver lesions which coincide with our results [9,14,20].
ADCs tend to be larger when using small b-values, because the signal attenuation due to diffusion plays only a minor role in that case, and ADC values are contaminated by micro-perfusion. When higher b-values are used, ADCs tend to decrease, in relation with less perfusion contamination. Also, the ADC measurements of benign and malignant hepatic masses were significantly different, which supports similar previous findings with cysts and hemangiomas had the highest ADC values while malignant masses had the lowest ADC values [21-24]. In the liver, b values of 0 and 500–600 s/mm2 are typically used. Although at least two b values are required for diffusion-weighted imaging analysis, the application of a greater number of b values will improve the accuracy of the calculated ADC. The disadvantage of using multiple high b values is an associated increase in scanning time [25,26].
In our study we used three b-values of 50, 400 and 800 sec/mm2 to increase the accuracy of calculated ADC values. The hepatic masses in our study showed the following ADC values; hepatic cysts showed mean ADC values of 3.15 ± 0.34 × 10⁻³ mm2/s and ADC range of 2.61-3.40 × 10⁻³ mm2/s, hemangioms showed mean ADC values of 2.10 ± 0.25 × 10⁻³ mm2/s and ADC range of 1.60-2.50 × 10⁻³ mm2/s, HCC lesions showed mean ADC values of 1.10 ± 0.32 × 10⁻³ mm2/s and ADC range of 0.91-1.76 × 10⁻³ mm2/s and metastasis showed mean ADC values of 0.96 ± 0.23 × 10⁻³ mm2/s and ADC range of 0.75-1.25 × 10⁻³ mm2/s. Our results are in agreement with those obtained by several other studies [9,14,21-24].
Quantitative measurement of ADC has been shown to be an indicator of malignancy in focal liver lesions, with a reduction in mean ADC (low signal intensity on an ADC map) of malignant lesions compared with benign lesions [9]. Bruegel et al. [9] reported that an ADC threshold of 1.63 × 10⁻³ mm2/sec could be used to correctly characterize 88% of lesions as either benign or malignant. Other study using a threshold ADC value of 1.5 × 10⁻³ mm2/s was able to differentiate benign from malignant lesions with 84% sensitivity and 89% specificity. Potential limitations will include necrotic and cystic metastases, where ADC might be elevated, and the diagnosis will then rely on post-contrast images [14].
In our study, we avoid to measure ADC in necrotic parts of the mixed tumor and depending only in measurement of solid component of mixed hepatic masses. A cut-off point of ADC value of 1.65 × 10⁻³ mm2/s was able to differentiate between malignant and benign hepatic masses with 96.6 % sensitivity, 95.7% specificity, and total accuracy of about 96.2 %.
Conclusion
In conclusion, DWI is easy to obtain and easy to evaluate, and ADC values can differentiate between benign and malignant liver masses with high sensitivity and specificity 96.6% and 95.7%, respectively. DWI is problem solving sequence in patients with contraindications to contrast media. We recommend addition of DWI sequence to the standard MRI examination of the liver before contrast study and according to the result of our study it is a promising sequence. However, more studies with more variants of hepatic focal lesions are needed for more evaluation of DWI in characterization of hepatic masses.
Conflict of Interest
The authors declare that they have no conflict of interest.
References
- Padia SA, Baker ME, Schaeffer CJ, Remer EM, Obuchowski NA, et al. (2009) Safety and efficacy of sonographic-guided random realtime core needle biopsy of the liver. J Clin Ultrasound 37:138-143.
- Appelbaum L, Kane RA, Kruskal JB, Romero J, Sosna J (2009) Focal hepatic lesions: US-guided biopsy-lessons from review of cytologic and pathologic examination results. Radiology 250:453-458.
- Whitmire LF, Galambos JT, Phillips VM, Sewell CW, Erwin BC, et al. (1985) Imaging-guided percutaneous hepatic biopsy: diagnostic accuracy and safety. J Clin Gastroenterol 7:511-515.
- Xie L, Guang Y, Ding H, Cai A, Huang Y (2011) Diagnostic value of contrast-enhanced ultrasound, computed tomography and magnetic resonance imaging for focal liver lesions: a meta-analysis. Ultrasound Med Biol 37:854-861.
- Wile GE, Leyendecker JR (2010) Magnetic resonance imaging of the liver: sequence optimization and artifacts. Magn Reson Imaging Clin N Am18:525-547.
- Parikh T, Drew SJ, Lee VS, Wong S, Hecht EM, et al. (2008) Focal liver lesion detection and characterization with diffusion-weighted MR imaging: comparison with standard breath-hold T2-weighted imaging. Radiology 246:812–822.
- Zech CJ, Herrmann KA, Dietrich O, HorgerW,Reiser MF, et al. (2008) Black-blood diffusion-weighted EPI acquisition of the liver with parallel imaging: comparison with a standard T2-weighted sequence for detection of focal liver lesions.Invest Radiol 43: 261-266.
- Coenegrachts K, Delanote J, TerBeek L, Haspeslagh M, Bipat S, et al. (2014) Improved focal liver lesion detection: comparison of single-shot diffusion-weighted echoplanar and single-shot T2 weighted turbo spin echo techniques. Br J Radiol 80: 524-531.
- Bruegel M, Holzapfel K, Gaa J, Woertler K, Waldt S, et al. (2008) Characterization of focal liver lesions by ADC measurements using a respiratory triggered diffusion-weighted single-shot echo-planar MR imaging technique. Eur Radiol 18: 477-485.
- Nasu K, Kuroki Y, Nawano S, Kuroki S, Tsukamoto T, et al. (2006) Hepatic metastases: diffusion-weighted sensitivityencoding versus SPIO-enhanced MR imaging. Radiology 239: 122-130.
- Koh DM, Brown G, Riddell AM, Scurr E, Collins DJ, et al. (2008) Detection of colorectal hepatic metastases using MnDPDP MR imaging and diffusion-weighted imaging (DWI) alone and in combination. Eur Radiol 18: 903-910.
- Gourtsoyianni S, Papanikolaou N, Yarmenitis S, Maris T, Karantanas A, et al. (2008) Respiratory gated diffusion-weighted imaging of the liver: value of apparent diffusion coefficient measurements in the differentiation between most commonly encountered benign and malignant focal liver lesions. Eur Radiol 18: 486-492.
- Sun XJ, Quan XY, Huang FH, Xu YK (2005) Quantitative evaluation of diffusion-weighted magnetic resonance imaging of focal hepatic lesions. World J Gastroenterol 11: 6535.
- Taouli B, Vilgrain V, Dumont E, Daire JL, Fan B, et al. (2003) Evaluation of liver diffusion isotropy and characterization of focal hepatic lesions with two single-shot echo-planar MR imaging sequences: prospective study in 66 patients. Radiology 226: 71-78.
- Deng J, Miller FH, Rhee TK, Sato KT, Mulcahy MF, et al. (2006) Diffusion-weighted MR imaging for determination of hepatocellular carcinoma response to yttrium-90 radioembolization. J Vasc Interv Radiol 17: 1195-1200.
- Stejskal EO, Tanner JE (1965) Spin diffusion measurements: spin echoes in the presence of time-dependent field gradient. J Chem Phys 42: 288-292.
- Koh DM, Collins DJ (2007) Diffusion-weighted MRI in the body:applications and challenges in oncology. AJR 188: 1622-1635.
- Goshima S, Kanematsu M, Kondo H, Yokoyama R, Kajita K, et al. (2008) Diffusion-weighted imaging of the liver: optimizing b value for the detection and characterization of benign and malignant hepatic lesions. J Magn Reson Imaging 28: 691-697.
- Coenegrachts K, Matos C, terBeek L, Metens T, Haspeslagh M, et al. (2009) Focal liver lesion detection and characterization: comparison of non-contrast enhanced and SPIO-enhanced diffusion-weighted single-shot spin echoecho planar and turbo spin echo T2-weighted imaging. Eur J Radiol 72: 432-439.
- Qayyum A (2009) Diffusion-weighted imaging in the abdomen and pelvis: concepts and applications. RadioGraphics 29:1797–1810.
- Moteki T, Horikoshi H, Oya N, Aoki J, Endo K (2002) Evaluation of hepatic lesions and hepatic parenchyma using diffusion weighted reordered turbo FLASH magnetic resonance images. J Magn Reson Imaging 15: 564-572.
- Quan XY, Sun XJ, Yu ZJ, Tang M (2005) Evaluation of diffusion weighted imaging of magnetic resonance imaging in small focal hepatic lesions: a quantitative study in 56 cases. Hepatobiliary Pancreat Dis Int 4: 406-409.
- Kandpal H, Sharma R, Madhusudhan KS, Kapoor KS (2009) Respiratory-triggered versus breath-hold diffusion-weighted mri of liver lesions: comparison of image quality and apparent diffusion coefficient values. AJR 192: 915-922.
- Coenegrachts K, Delanote J, TerBeek L, Haspeslagh M, Bipat S, et al. (2009) Evaluation of true diffusion, perfusion factor, and apparent diffusion coefficient in non-necrotic liver metastases and uncomplicated liver hemangiomas using black-blood echo planar imaging. Eur J Radiol 69: 131-138.
- Taouli B, Tolia AJ, Losada M, Babb JS, Chan ES, et al. (2007) Diffusion weighted MRI for quantification of liver fibrosis: preliminary experience. AJR 189: 799-806.
- Taouli B, Chouli M, Martin AJ, Qayyum A, Coakley FV, et al. (2008) Chronic hepatitis: role of diffusion weighted imaging and diffusion tensor imaging for the diagnosis of liver fibrosis and inflammation. J Magn Reson Imaging 28: 89-95.
Relevant Topics
- Abdominal Radiology
- AI in Radiology
- Breast Imaging
- Cardiovascular Radiology
- Chest Radiology
- Clinical Radiology
- CT Imaging
- Diagnostic Radiology
- Emergency Radiology
- Fluoroscopy Radiology
- General Radiology
- Genitourinary Radiology
- Interventional Radiology Techniques
- Mammography
- Minimal Invasive surgery
- Musculoskeletal Radiology
- Neuroradiology
- Neuroradiology Advances
- Oral and Maxillofacial Radiology
- Radiography
- Radiology Imaging
- Surgical Radiology
- Tele Radiology
- Therapeutic Radiology
Recommended Journals
Article Tools
Article Usage
- Total views: 4825
- [From(publication date):
February-2017 - Jul 09, 2025] - Breakdown by view type
- HTML page views : 3839
- PDF downloads : 986
