2-D Spectral Analysis of Aeromagnetic Anomalies over Parts of Mongunoand Environs, Northeastern Nigeria
Received: 28-Aug-2015 / Accepted Date: 16-Sep-2015 / Published Date: 26-Sep-2015 DOI: 10.4172/2157-7617.1000303
Abstract
2-D Spectral Analysis of aeromagnetic anomalies over parts of Monguno and environs, northeastern Nigeria was carried out to determine the depth to basement, establish the basement topography and determine the temperature at depths in the area. Data enhancement was carried out to delineate residual features and the more intense anomalies relative to the strong regional gradients. Typical techniques applied were computations of reduction to pole, trend surface analysis, and a number of filtering processes. Results of the 2-D spectral analysis of the aeromagnetic data revealed a two depth source model. The depth to the deeper magnetic source bodies ranges from 1.22 to 3.14 km, with an average depth of 2.341 km. This layer may be attributed to magnetic rocks of the basement, lateral variations in basement susceptibilities and intra- basement features like faults and fractures. The shallower magnetic sources range in depth from 0.12 to 0.93 km, with an average depth of 0.572 km and could be attributed to near surface magnetic sources, which are magnetic rocks that intruded into the sedimentary formations. Based on the computed average sediment thickness obtained in this study together with the temperature at depths in the area, some parts of the study area have been demarcated for detail hydrocarbon exploration in-line with the renewed interest in hydrocarbon exploration in the basin.
Keywords: Aeromagnetic anomalies; basement depth; Chad Basin; Monguno; spectral analysis
11982Introduction
Monguno constitutes one of the major towns in the Borno Basin occupying the northeastern part of the country. The basin is part of the Chad Basin, a regional large depositional structure extending over several countries [1]. The study area is bounded by latitudes 12° 00?N and 13° 00?N; and longitudes 13° 00?E to 14° 00?E, and has an area of about 12,100 km2. Aeromagnetic geophysical method is a cost effective method when taking into consideration the area explored and its rapid rate of coverage as compared against other geophysical methods. Its main purpose is to detect earth materials possessing unusual magnetic properties that reveal themselves by causing disturbances or anomalies in the earth’s magnetic field intensity. Availability of aeromagnetic data compared to other geophysical methods allows for this method to be widely used [2]. The present study is intended to evaluate aeromagnetic anomalies so as to determine and understand the basin structure, sedimentary thickness and other basin characteristics as a tool for hydrocarbon and mineral wildcat preliminary investigations.
Geological Setting
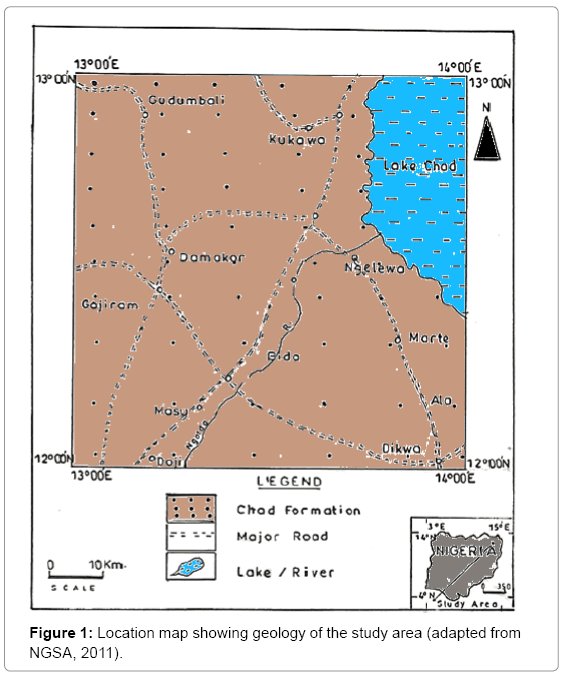
The Chad Basin lies within a vast area of Central and West Africa, containing marine and continental sediments of the Bima Sandstone, Gongila Formation, Fika Shale, Kerri Kerri and Chad Formations [3]. Its origin has been generally attributed to the rift system that developed in the early Cretaceous [4] when the African and South American lithospheric plates separated and the Atlantic opened. Pre-Santonian Cretaceous sediments were deposited within the rift system [1]. The study area is covered by sand and lack well exposed outcrops (Figure 1). Bima Sandstone is the oldest stratigraphic unit in the area. It was deposited under continental environments and lies unconformably on the Basement Complex [5]. The Gongila Formation is a transitional sequence between the underlying continental Bima Sandstone and the overlying fully marine unit of the Fika Shale, and consists of a sequence of sandstone, clay, shale and limestone layers. The Gombe Sandstone formation has not been penetrated by wells used variously in the past for the study of the Chad Basin and its occurrence in any significant proportion in the basin is doubtful [6]. Kerri-Kerri Formation consists of loosely cemented, coarse to fine-grained often cross bedded sandstone, massive claystone and siltstone; bands of ironstone and conglomerate occur locally. Chad Formation is the youngest stratigraphic unit in the area. This consists of yellow, grey clay, fine to coarse-grained sand with intercalations of sandy clay and diatomites [7]. The formation varies considerably in thickness and on the western shore of Lake Chad [8].
Data And Methodology
Digitized airborne magnetometer survey maps of total magnetic field intensity were used in this study. The data was acquired for the Nigerian Geological Survey Agency by Fugro Airborne Surveys. It included a total of 1,930,000 line-km of magnetic surveys flown at 500 m line spacing and 80 m terrain clearance using Fugro’s GENESIS EM system. Data enhancement in the form of filtering in the Fourier domain was carried out so as to enhance deep or shallow features as well as to allow for more constrained interpretation. In this study, the non-linear filter was the most appropriate as they are very good and ideal for removing high frequency and short wavelength noise from data. Regional - residual separation was carried out by fitting a plane surface to the data using multi- regression least squares analysis. This is an analytical method in which matching of the regional by a polynomial surface of low order exposes the residual features as random errors.
The surface linear equation used on the data is:
P (x, y)=a + bx + cy (1)
Where: a, b and c are constants; x and y are distances in x and y – directions (axes) (independent variables); P (x, y) is the magnetic value at x and y co-ordinates (dependent variable).
If the regional surface is expressed as the function
Z=a + bx + cy (2)
Then the residual anomaly function R, for the observed magnetic intensity M is given as:
R=M – Z (3)
Spectral analysis allows an estimate of the depth of magnetized blocks having variable thickness, width and magnetization. Most of the approaches used involve Fourier transformation of the digitized aeromagnetic data to compute the energy spectrum. This is plotted on a logarithmic scale against frequency. The segments slopes yield estimates of average depths to magnetic sources of anomalies.
Result Presentation And Interpretation
Total magnetic intensity
Digitized airborne magnetometer survey maps of total magnetic field intensity for sheets 45, 67, 46 and 68 representing Gudumbali, Masu, Monguno and Marte respectively were acquired, assembled and interpreted.
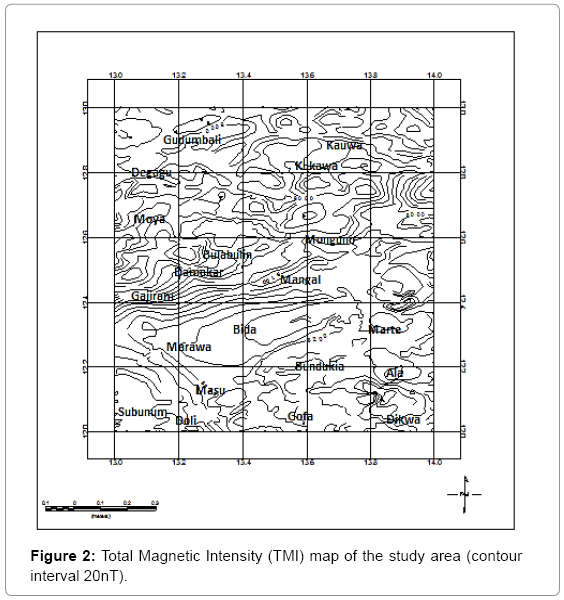
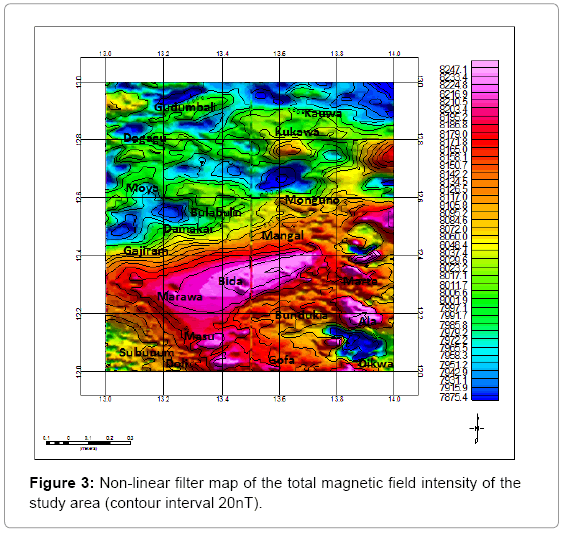
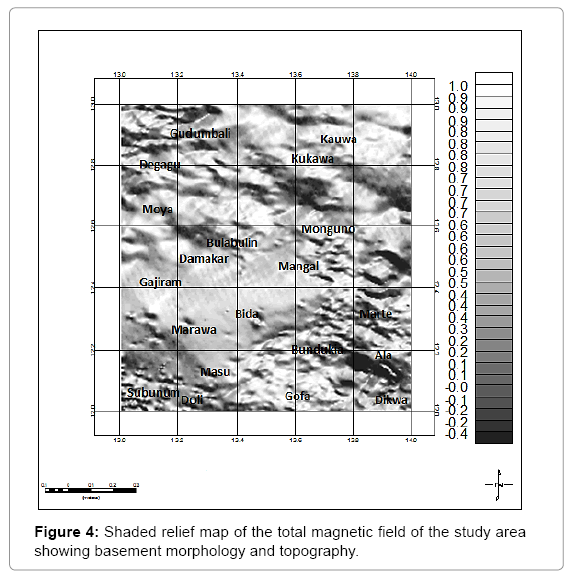
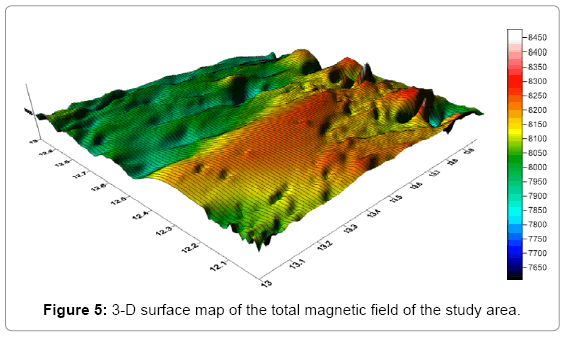
The total magnetic field intensity map derived from the data digitization and enhancement is presented as total field intensity map, non-linear filter map, shaded relief map and 3-D surface map respectively (Figures 2-5). The resultant total magnetic field map obtained from the digitized aeromagnetic data shows a very complex pattern of magnetic anomalies of both short and long wavelengths. These wavelengths are represented as magnetic low and high anomalous bodies. The anomalies have a regional gradient with increasing field intensity from north to south, with positive magnetic intensity values generally ranging between 7650 to 8500 nT. In the northern part, the study area is characterized by relatively low magnetic intensity contours with the major anomalies striking northeast-southwest from Degagu, Moya, Gudumbali and Damakar in the NW through to Kauwa in the NE, suggesting that the depth to basement is relatively higher in these areas (Figure 2). Sedimentary rocks and poorly consolidated sediments have much lower magnetizations [9,10]. Variation in magnetic intensity across the study area showing increase in magnetic intensity from the northern to the southern part indicate that the higher frequency anomalies are concentrated mainly within the southern part of the study area around Bida, Marawa, Ala and Marte, with a conspicuous elongated NE – SW trending anomaly at Bida. Areas of high magnetic intensity values could therefore be as a result of igneous intrusion. The shaded relief map as well as the 3-D representation of the total magnetic field intensity (Figures 4 and 5) of the study area describe the magnetic intensity of the area as indicated by low and high relief patterns. Low relief areas are observed in the northern part of the study area around Degagu, Moya, Gudumbali and Damakar in the northwest through to Kauwa in the northeast and down to Dikwa in the southeastern part. The high relief areas dominated the southwestern flank and southern parts of the study area. The high relief area is therefore interpreted to be more tectonically active than the low relief area owing to the presence of many intrusive bodies present in the area.
Regional – residual separation
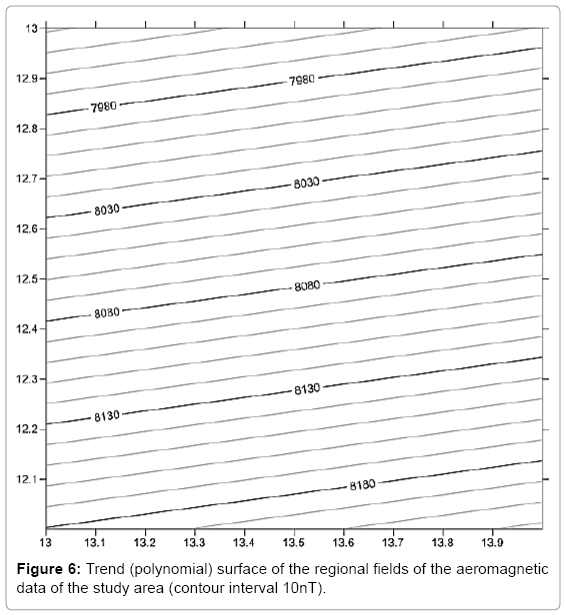
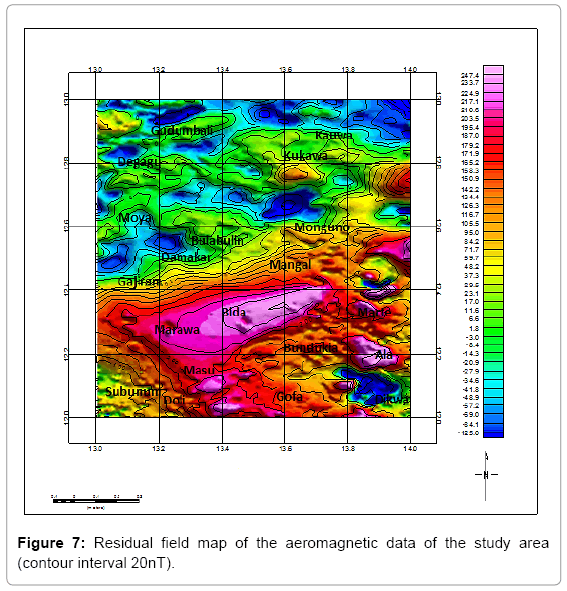
The total magnetic field intensity is made up of two parts: the regional field and the residual field. Values of the regional fields are always very high when compared to that of the residual fields and most often shields or masks the residual fields thereby making their effects generally unnoticed. In interpreting aeromagnetic data therefore, attempt is made at separating the higher frequency regional fields from the low frequency residual fields. In doing this the method used is often by fitting a plane surface to the total field data. Therefore, generally speaking, regional – residual separation is carried out by polynomial fitting using multiple regression analysis. Subtraction of the calculated (regional) values from that of the original magnetic field intensity values gives the residual values. The regional fields establish the major tectonic elements of deeper and regional extent which affect and control the structural framework of the study area. The structural trend revealed from the polynomial surface shows a dominant regional NE – SW trend with an increasing regional magnetic field intensity of 100 nT towards the southwest (Figure 6). Figure 7 shows that the residual magnetic intensity of the study is of the range between -125 and 247 nT. This shows the study area as predominantly area of positive residual anomalies and lesser area of negative residual anomalies. This implies that shallow to near surface magnetized bodies exist in the area. The negative residual areas reflect zone of low magnetization while the positive residual anomalies reflect areas of high magnetization. The existence of the elongated positive anomaly in Bida and Marawa areas could be as a result of magmatic activity which resulted to most of the near surface rocks containing large amount of magnetic minerals.
Spectral analysis
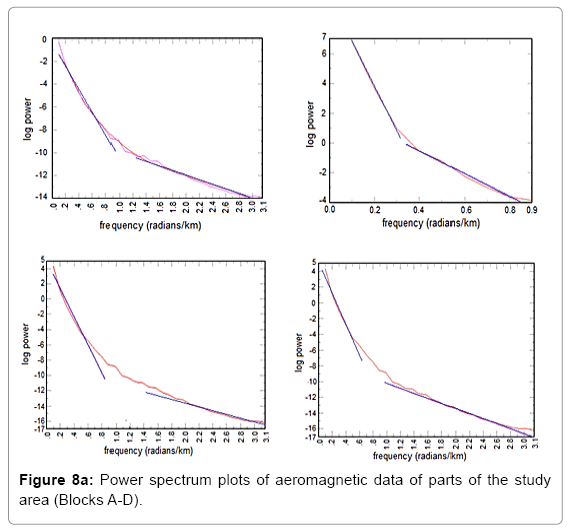
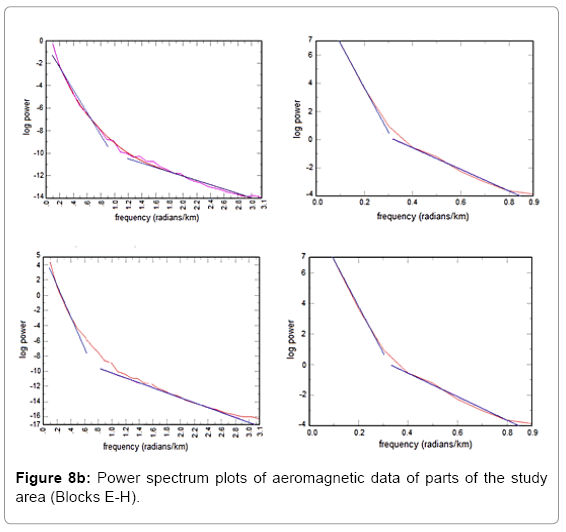
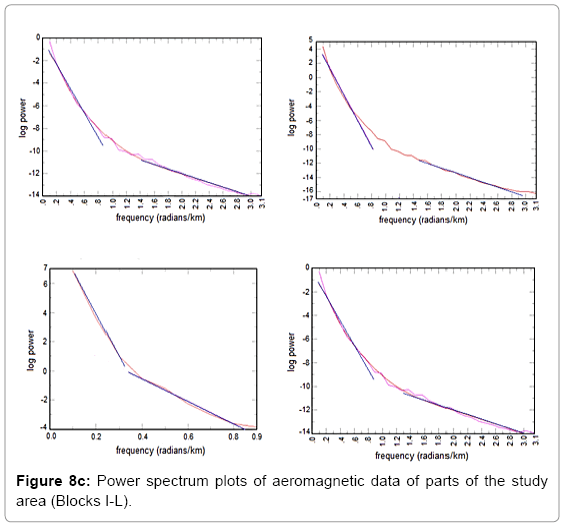
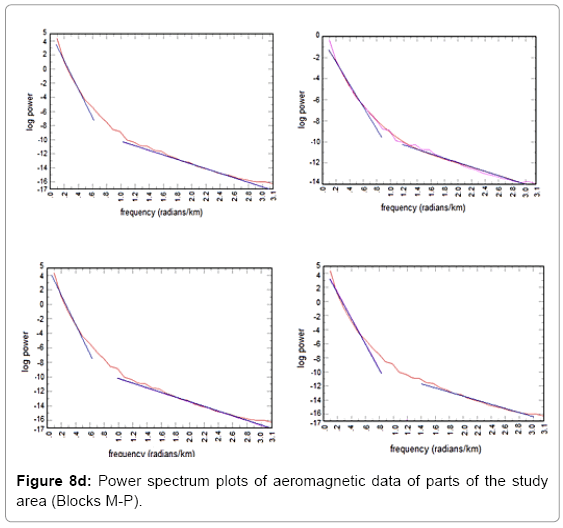
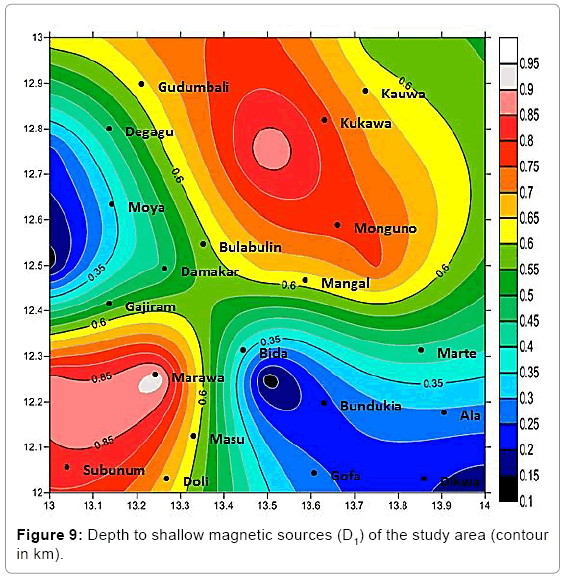
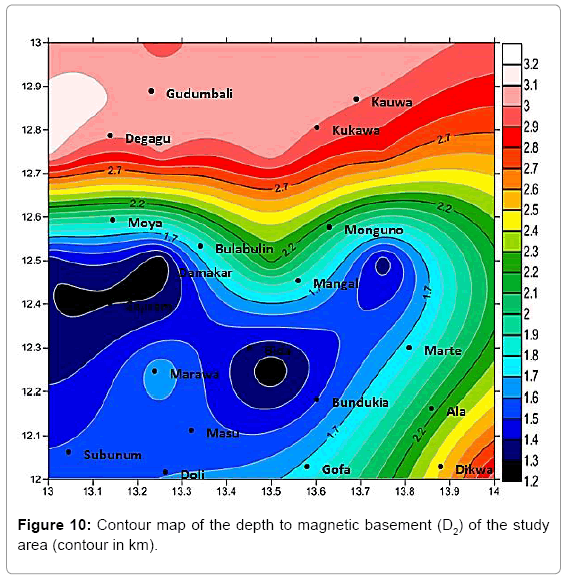
Spectral analysis of the aeromagnetic data was done using a program that runs on MATLAB 7.5. In using spectral analysis to determine depths to layers of magnetization, the study area was divided into sixteen (16) square blocks (blocks A-P) with area of about 13.85 km × 13.85 km. In doing this, adequate care was taken so that essential parts of each anomaly were not cut by the blocks. The blocks were made to overlap each other. Spectral depths were obtained by plotting graphs of logarithms of spectral energies against frequency. The spectral plots (Figures 8a-d) present two clear linear segments due to deeper and shallower sources. From the gradients of the segments the average depths to the causative bodies were determined as D1 and D2 as presented in Table 1. The first layer depth (D1) is the depth to the shallower magnetic anomaly source represented by the second segment of the spectrum. It ranges from 0.12 to 0.93 km, with an average depth of 0.572 km (Figure 9). This layer may be attributed to the depth to intrusive in the area. The second layer depth (D2) is the depth to the basement and is represented by the first segment of the spectrum. It ranges from 1.22 to 3.14 km, with an average depth of 2.341 km (Figure 10). This layer may be attributed to magnetic minerals/rocks in the basement, lateral variations in basement susceptibilities, and intrabasement features like faults and fractures. The D2 values obtained from the spectral plots therefore represent the average sedimentary thickness in the area. Depth to magnetic basement map reveals the sedimentary thickness as thinning from the east towards the southwest direction, and generally increasing from the central part towards the northern part of the study area.
| Spectral Blocks | Longitude | Latitude | Depth (km) | |||
|---|---|---|---|---|---|---|
| X1 | X2 | Y1 | Y2 | D1 | D2 | |
| A | 13 | 13.25 | 12.75 | 13 | 0.63 | 3.05 |
| B | 13.25 | 13.5 | 12.75 | 13 | 0.72 | 2.96 |
| C | 13 | 13.25 | 12.5 | 12.75 | 0.23 | 3.14 |
| D | 13.25 | 13.5 | 12.5 | 12.75 | 0.58 | 3.01 |
| E | 13.5 | 13.75 | 12.75 | 13 | 0.76 | 3.02 |
| F | 13.75 | 14 | 12.75 | 13 | 0.56 | 3.08 |
| G | 13.5 | 13.75 | 12.5 | 12.75 | 0.89 | 3.06 |
| H | 13.75 | 14 | 12.5 | 12.75 | 0.69 | 2.80 |
| I | 13 | 13.25 | 12.25 | 12.5 | 0.13 | 1.34 |
| J | 13.25 | 13.5 | 12.25 | 12.5 | 0.45 | 1.22 |
| K | 13 | 13.25 | 12 | 12.25 | 0.87 | 1.37 |
| L | 13.25 | 13.5 | 12 | 12.25 | 0.93 | 1.67 |
| M | 13.5 | 13.75 | 12.25 | 12.5 | 0.67 | 2.23 |
| N | 13.75 | 14 | 12.25 | 12.5 | 0.76 | 1.34 |
| O | 13.5 | 13.75 | 12 | 12.25 | 0.12 | 1.22 |
| P | 14 | 14 | 12 | 12.25 | 0.16 | 2.95 |
Table 1: Spectral analysis-estimated depths to near surface and deep magnetic anomaly sources in the study area.
Estimation of temperature at depth
The temperature range in which oil forms (i.e. source rock maturation) is known as oil window. For any area to be viable for hydrocarbon formation, the oil window is often found in the 60-120°C intervals, and the thickness of the sediment must be at least 2.0 km [7]. Below the minimum temperature the organic matters remain trapped in the form of kerogen and above the maximum temperature the oil is converted to thermal gas. In order to estimate the temperature at depth within the study area, it was assumed that the temperature variation within the earth is linear and of the form given by Onwuemesi [11] as:
Th=mh+T0 (4)
Where, Th=temperature in °C at depth (h), m=geothermal gradient, h=depth of interest, T0=surface temperature
With a surface temperature of 30°C and the average geothermal gradient in the study area given as 3.4 °C/100 m [1]; and from the values of the sedimentary thicknesses determined from spectral analysis, which vary from 1.22 to 3.14 km, the temperatures at depth for each anomaly block (A – P) were estimated using equation (4) and solving for the unknown Th. The values obtained range from 71.48 to 136.76°C with an average temperature of 109.6°C.
Result And Discussion
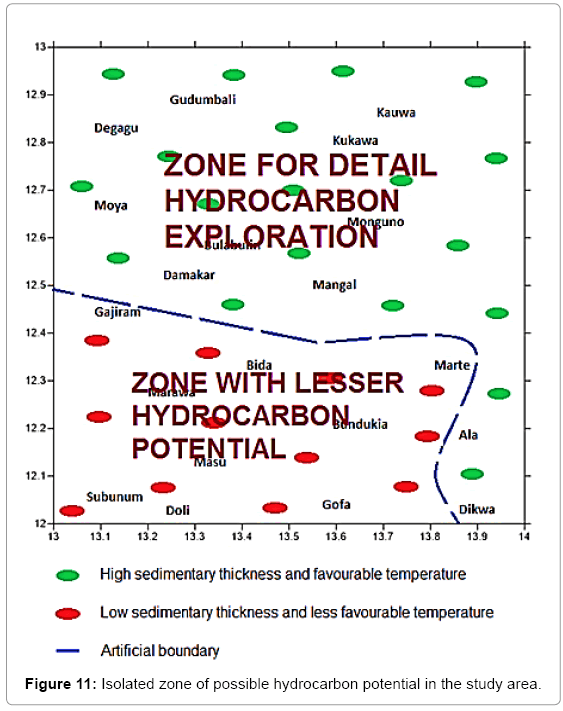
Basement mapping with spectral analysis has been in use for several decades in the determination of depths to the basement surface. The total field of the aeromagnetic data presented as a 3-D surface map shows a basement surface that is undulated. The dominant trend of the magnetic anomaly in the basin interpreted from this study reveals a NE – SW direction, and it conforms with the orientation of basin. This is in agreement with the previous works on the basin as cited by Anakwuba [12] and Okonkwo [13]. According to Kogbe [14], this NE – SW fracture system represents significant features of the tectonic framework of the Nigerian basement complex. Nwankwo [1] suggested that the Nigerian Chad Basin is a petroliferous basin expected to have shallow level of hydrocarbon occurrences due to its high geothermal gradient which causes the depth/thickness range of the oil window to be quite narrow. The depth to basement (sedimentary thickness) ranges from 1.22 to 3.14 km, with an average depth of 2.341 km. The thickest sedimentary cover of about 3.2 km was found in regions to the west of Gudumbali and Degagu. Therefore, on the basis of the computed sedimentary thickness (1.22-3.14 km) and temperature at depths (71.48-136.76°C) in this study, the northern part from Gudumbali in the northwest through to Mangal in the central part of the study area and down to Ala and Dikwa in the southeast have more potential for hydrocarbon generation and accumulation (Figure 11), where hydrocarbon play elements are present. The potential for hydrocarbon accumulation and extraction may only be hindered by the presence of intrusives in the areas.
Careful consideration and detailed exploration should be done in areas to the south and southwestern part of the study area particularly regions around Subunum as there may be potential for hydrocarbon accumulation if the Gombe Sandstone (potential reservoir) is present as suggested by Nwankwo [1] and Chaanda [15] Potential source rock and seal are the marine Fika Shale and the claystone and siltstone units of the Kerri-Kerri Formation. Sedimentary thickness in the region ranges from 1.2 to 1.7 km. However, areas around Gajiram and Bida environs have relatively shallow depths and lesser potential for hydrocarbon accumulation and may therefore be avoided.
Conclusion
Spectral analysis has been applied to a set of aeromagnetic data over part of Monguno and environs in the Borno Basin, northeastern Nigeria. The result showed depth sources to two magnetic sources in the study area. The depth to the deeper magnetic source bodies ranging from 1.22 to 3.14 km, with an average depth of 2.341 km, while the shallower magnetic sources range in depth from 0.12 to 0.93 km, with an average depth of 0.572 km.
The depths to basement (and sedimentary thickness) are higher in the northern part and lower in the south and southwestern parts of the study area. The average sediment thickness of 2.341 km obtained in this study together with the temperature ranges at depths in the area is significant for the maturation of potential source rock. Despite the lower sedimentary cover in the southern and southwestern part of the study area, hydrocarbon prospects in the area remain possible if the Gombe Sandstone is present.
Acknowledgment
We would like to acknowledge the contributions of Dr. A.I. Opara of the Department of Geology, Federal University of Technology Owerri (FUTO), who provided insights and assisted in successfully completing this work.
References
- Nwankwo CN, Ekine AS, Nwosu LI (2009) Estimation of the heat flow variation in the Chad Basin Nigeria. J Applied Sci Environ Manage 13: 73-80.
- Paterson NR, Reeves CV (1985) Applications of gravity and magnetic surveys: the state-of-the-art in 1985. Journal of Geophysics 50: 2558-2594.
- Okosun EA (2000) A preliminary assessment of the petroleum potentials from Southwest Chad Basin, Nigeria. Journal of Geology 2: 40-50.
- Burke K (1976) The Chad Basin: an active intra-continental basin. Tectonophysics 36: 197-206.
- Okosun EA (1995) Review of the geology of Borno Basin. Journal of Mining and Geology 31: 113-122.
- Obaje NG, Abaa SI, Najime T, Suh CE (1999) Economic geology of Nigerian coals resources-a brief review. African Geosci Rev 6: 71-82.
- Wright JB, Hastings D, Jones WB, William HR (1985) Geology and mineral resources of West Africa. Geological J 22: 211-212.
- Moumouni A, Obaje NG, Chaanda MS, Goki NG (2007) Geochemical evaluation of the hydrocarbon prospects in the Nigerian sector of the Chad Basin. Petroleum Science Research Progress, Nova Science Publishers, New York, 1-12.
- Reynolds RL, Rosenbaum JG, Hudson MR, Fishman NS (1990) Rock magnetism, the distribution of magnetic minerals in the Earth’s crust, and aeromagnetic anomalies. United States Geological Survey Bulletin 1924: 24-45.
- Hudson MR, Mikolas M, Geissman JW, Allen B (1999) Paleomagnetic and rock magnetic properties of Santa Fe group sediments in the 98th street core hole and correlative surface exposures. Albuquerque Basin, New Mexico: New Mexico Geological Society, 50th Field Conference, Guidebook, 355-362.
- Onwuemesi AG (1997) One-dimensional spectral analysis of aeromagnetic anomalies and curie depth isotherm in the Anambra Basin of Nigeria. Journal of Geodynamics 23: 95-107.
- Anakwuba EK, Onwuemesi AG, Chinwuko AI, Onuba LN(2011)The interpretation of aeromagnetic anomalies over Maiduguri – Dikwa depression, Chad Basin Nigeria: a structural view. Arch  Applied Sci Res 3: 499-508.
- Okonkwo CC, Onwuemesi AG, Anakwuba EK, Chinwuko AI, Ikumbur BE (2012) Aeromagnetic interpretation over Maiduguri and environs of Southern Chad Basin, Nigeria. J Earth Sci Geotechnical Eng 2: 77-93.
- Kogbe CA (1989) Geology of Nigeria. 2nd Edition. Rockview Nigeria Limited, Jos pp: 538
- Chaanda MS, Obaje NG, Lar UA,Moumouni A(2007) Petroleum geochemistry of Kuchalli -1 in the Nigerian sector of the Chad Basin. Department of Geology and Mining, Nasarawa State University, Nigeria, Continental J Earth Sci 1: 18-24.
Citation: Oghuma AA, Obiadi II, Obiadi CM (2015) 2-D Spectral Analysis of Aeromagnetic Anomalies over Parts of Monguno and Environs, Northeastern Nigeria. J Earth Sci Clim Change. 6: 303. DOI: 10.4172/2157-7617.1000303
Copyright: © 2015 Oghuma AA, et al. This is an open-access article distributed under the terms of the Creative Commons Attribution License, which permits unrestricted use, distribution, and reproduction in any medium, provided the original author and source are credited.
Select your language of interest to view the total content in your interested language
Share This Article
Recommended Journals
Open Access Journals
Article Tools
Article Usage
- Total views: 12577
- [From(publication date): 10-2015 - Jul 13, 2025]
- Breakdown by view type
- HTML page views: 11537
- PDF downloads: 1040

