Nuclear Area Factor as a Novel Estimate for Apoptosis in Oral Squamous Cell Carcinoma -Treated Cell Line: A Comparative in-vitro Study with DNA Fragmentation Assay
Received: 25-Jan-2012 / Accepted Date: 21-Feb-2012 / Published Date: 23-Feb-2012 DOI: 10.4172/2161-0681.1000107
Abstract
Aims and objectives:The aims of the present study were to introduce a novel modality for estimation of the anti-neoplastic efficacy of chemotherapeutic agents and to compare this technique with one of the most widely used techniques, the DNA fragmentation assay.
Methods:Squamous cell carcinoma cell line HEp-2 was utilized in the present study. The cytotoxic drug used in this study was gossypol-acetic acid. Microscopic slides of each drug concentration at definite post-treatment durations were photomicrographed and analyzed using image anazlysis software for the estimation of nuclear area factor. Data were then statistically analyzed. Internucleosomal DNA fragmentation was investigated to assess whether the morphological changes induced by the drug depended on activation of the apoptotic pathway.
Results:The data recorded revealed a decrease in the mean values of NAF of HEp-2 cells treated with different concentrations of gossypol over different durations when compared to control cells. DNA fragmentation was not observed in the control groups over different durations of incubation. The study of internucleosomal DNA fragmentation in HEp-2 cells treated with different concentrations of gossypol over different durations revealed absence of DNA laddering that indicated DNA fragmentation with either 50μM or 100μM gossypol concentrations after until 24 hours of incubation with 50μM gossypol concentration.
Conclusions:These results suggest that estimation of nuclear area factor (NAF) is a sensitive predictor of the early apoptotic effect of anti-cancer therapy. DNA fragmentation assay is a useful tool for detection of the late apoptotic changes that discriminate apoptotic effects of anti-cancer drugs from necrotic ones.
Keywords: Oral cancer; Apoptosis; Image analysis
308764Introduction
Head and neck squamous cell carcinoma (HNSCC) is the tenth most common malignancy in humans all over the world [1] representing more than 90% of head and neck cancers [2]. Currently, advances in both surgical and non-surgical therapeutic modalities have led to increased local HNSCC control. However, overall mortality rates have not improved significantly in the last forty years due to tumor recurrences in regional and distant sites of the aerodigestive tract [3,4].
Chemotherapy is also getting more popular in the management of HNSCC [5]. Many treatment options and variations of combined treatment are available such as cisplatin, paclitaxel, docetaxel, epidermal growth factor receptor inhibitors, tumor necrosis factor-α, mitomycin or lactacystin [6-12].
The development of tumor cell resistance to chemotherapy is a major problem in cancer treatment. One way to counter this is to find compounds with cytotoxic mechanisms other than those of drugs in clinical use today. The biological and chemical diversity encountered in nature provide opportunities to discover completely new chemical classes of compounds. Some of these may represent previously unknown anticancer agents and, in some cases, novel, potentially relevant cytotoxic mechanisms [13]. Of these, gossypol, a natural polyphenolic compound that appears as a yellow pigment in the seeds of cotton plant (Gossypium), have successful anti-tumor cell effects against several tumor cell lines grown in tissue culture as well as in clinical studies [14].
To judge the cytotoxic efficacy of anti-neoplastic drugs, various methods were utilized including cytotoxicity assay (viability test) [15], DNA gel electrophoresis to detect apoptotic changes [16], cytological microscopic examination of necrotic changes [17] and immunohistochemical staining with apoptotic markers [18]. Each technique is not quite efficient by itself to estimate the effectiveness of the chemotherapeutic agent due to lack of precise estimation of optimum drug concentration that ensures maximum effect of the drug with minimal side effects.
The aims of the present study were to introduce a novel modality for estimation of the anti-neoplastic efficacy of chemotherapeutic agents and to compare such a technique with one of the most widely used techniques, the DNA fragmentation assay.
Materials and Methods
Material
Cell line: Squamous cell carcinoma cell line HEp-2, supplied from Cell Culture Department- VACSERA- EGYPT was utilized in the present study. HEp-2 cells imported from the ‘’American Type Culture Collection (ATCC)’’ with the reference number ‘’ CCL-23’’.
Reagents: The cytotoxic drug used in this study was gossypol-acetic acid (Sigma Aldrich- USA). Growth medium was supplemented with 10 % foetal bovine serum (FBS), 2mM glutamine and sodium bicarbonate (Invitrogen, USA). FBS was purchased from GIBO COBRAL® limited.
Methods
After a monolayer of cultured cells was formed, plates were treated with different concentrations (50μM and100μM) of 5mg gossypol dissolved in 1ml methanol. Non-treated control wells were methanol treated. Each experimental condition was repeated in 10 wells and the results were averaged. Plates were incubated at 37°C for 6, 24 and 48 hours post treatment.
Determination of Apoptotic Effect of Drug on HEp-2 Cell Line
Assessment of hematoxylin and eosin stained HEp-2 cells
50μl of HEp-2 treated cells was dispensed on glass slides, dried and fixed using methanol as a preparatory step for cytological examination by hematoxylin and eosin stain.
Photomicrography and cytological evaluation: Microscopic slides of each drug concentration at definite post-treatment durations were photomicrographed at the power of 1000X (oil immersion) using a digital video camera (Olympus, C5060, Japan) mounted on a light microscope (Olympus, BX60, Japan). Images were then transferred to the computer system for analysis. Field selection was based on the presence of the highest number of apoptotic cells.
Nuclear area factor: The captured microscopic fields were analyzed using the image analysis software (Image J, 1.37v, NIH, USA). Images were automatically corrected for brightness and contrast and then converted into 8-bit gray scale types. Phase color coding of the desired areas was automatically done. Thresholding was adjusted to select the nuclei of HEp-2 cells.
The surface area and circularity of the nuclei were then automatically measured. Nuclear area factor was calculated using the formula:
(Nuclear area factor = Circularity x Object area) [19]
Data was then tabulated in Microsoft Excel sheet (Microsoft Office 2007®).
Statistical analysis: The mean values of nuclear area factor (NAF) of different concentrations compared to the control results at different intervals (6 hours, 24 hours and 48 hours) were assessed statistically using the Statistical Package for Social Science (SPSS 16.0) software for Windows. The statistical tests performed included the Analysis of Variance (ANOVA) for comparison of means of different concentrations at any definite interval and comparison of means of different intervals at any definite concentration. The results were considered significant when P value ≤ 0.05. Post Hoc multiple comparisons test (Tukey HSD) was performed to establish the comparison among different concentrations and different intervals. Graphs representing error bars of means ± standard error were performed utilizing SPSS software.
DNA fragmentation assay
1ml of properly mixed phenol-chloroform-isomyl (25:24:1) was added to eppendorf tubes and then centrifuged for 10-15 minutes at 1500 RPM at room temperature. The upper aqueous DNA-containing layers of the eppendorfs were then transferred to new ones. 30μl of 3M sodium acetate and 1ml of absolute ethanol were added and then mixed gently until a DNA thread was observed. The eppendorf tubes were kept at -20°C for 90 minutes, centrifuged at 14,000 RPM for 10 minutes and then stored at -80°C until gel electrophoresis was performed.
Assessment of gel electrophoresis: After electrophoresis, the gel was placed on a light box and illuminated with an ultraviolet lamp to view the DNA bands while using protective gear to limit exposure to ultraviolet radiation. The gel was then photographed with a digital camera.
Results
Morphometric results
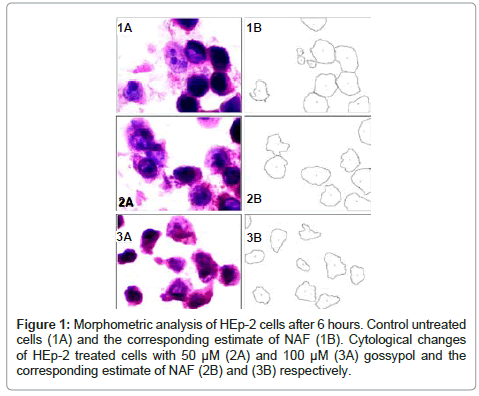
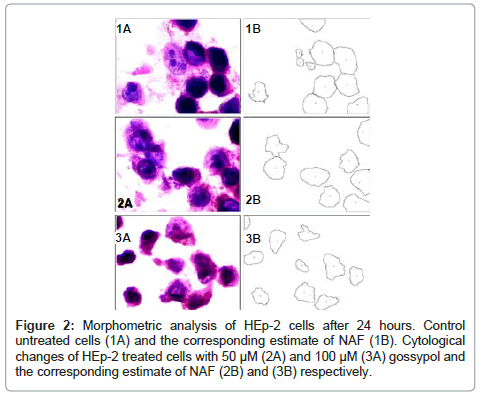
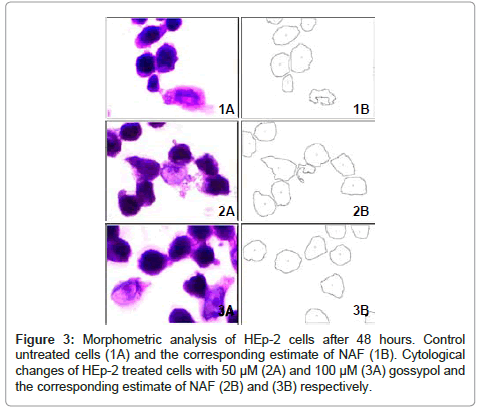
The mean values of NAF of HEp-2 cells treated with different concentrations of gossypol at different durations are shown in table 1. The data recorded revealed a decrease in the mean values of NAF of HEp-2 cells treated with different concentrations of gossypol over different durations when compared to control cells (Figures 1,2 and 3).
| Duration | control | 50µM | 100µM |
|---|---|---|---|
| NAF (6hrs) | 44960.55 | 27561.54 | 34753.02 |
| NAF (24hrs) | 39382.53 | 23758.32 | 25022.99 |
| NAF (48hrs) | 43211.57 | 22734.9 | 30142.4 |
Table 1: The mean values of NAF of HEp-2 cells treated with different concentrations of gossypol at different durations.
Statistical results
6 Hours post treatment: ANOVA test revealed a statistically significant difference among mean values of NAF of HEp-2 cells treated with different gossypol concentrations and the control cells (P value = 0.017) (table 2).
| Sum of Squares | df | Mean Square | F | Sig. | |
|---|---|---|---|---|---|
| Between Groups | 3.721 | 5 | 7.442 | 2.969 | .017* |
| Within Groups | 1.955 | 78 | 2.507 | ||
| Total | 2.327 | 83 |
*The mean difference is significant at the 0.05 level.
Table 2: ANOVA test for the mean values of NAF of different gossypol concentrations and control cells at 6 hours post treatment.
Post Hoc multiple comparisons test (Tukey HSD method) revealed a statistically significant decrease in NAF when comparing the mean value of NAF of HEp-2 cells treated with 50μM gossypol to that of control cells.
Table 3 reveals the Post Hoc multiple comparisons test for comparison of mean values of NAF 6 hours post treatment.
| (I) Concentration | (J) Concentration | Mean Difference (I-J) | Std. Error | Sig. | 95% Confidence Interval | |
|---|---|---|---|---|---|---|
| Lower Bound | Upper Bound | |||||
| Control | 50µM | 17398.929 | 5.984 | .047* | -85.70 | 34883.55 |
| 100µM | 10207.500 | 5.984 | .532 | -7277.12 | 27692.12 | |
| 50µM | 100µM | -7191.429 | 5.984 | .835 | -24676.05 | 10293.20 |
| * The mean difference is significant at the 0.05 level. | ||||||
Table 3: Post Hoc multiple comparisons test (Tukey HSD method) for comparison of the mean differences of NAF ± standard error for different gossypol concentrations and control cells 6 hours post treatment.
24 Hours post treatment: ANOVA test revealed a statistically significant difference among mean values of NAF of HEp-2 cells treated with different gossypol concentrations and the control cells (P value = 0.022) (table 4).
| Sum of Squares | df | Mean Square | F | Sig. | |
|---|---|---|---|---|---|
| Between Groups | 2.818 | 5 | 5.635 | 2.814 | .022* |
| Within Groups | 1.562 | 78 | 2.003 | ||
| Total | 1.844 | 83 |
* The mean difference is significant at the 0.05 level.
Table 4: ANOVA test for the mean values of NAF of different gossypol concentrations and control cells 24 hours post treatment.
Post Hoc multiple comparisons test (Tukey HSD method) revealed a statistically significant decrease in mean value of NAF of HEp-2 cells treated with 50μM when compared to that of control.
Table 5 reveals the Post Hoc multiple comparisons test for comparison of mean values of NAF 24 hours post treatment.
| (I) Concentration | (J) Concentration | Mean Difference (I-J) | Std. Error | Sig. | 95% Confidence Interval | |
|---|---|---|---|---|---|---|
| Lower Bound | Upper Bound | |||||
| Control | 50µM | 15624.214 | 5.349 | .050* | -3.43 | 31251.85 |
| 100µM | 14359.643 | 5.349 | .090 | -1268.00 | 29987.28 | |
| 50µM | 100µM | -1264.571 | 5.349 | 1.000 | -16892.21 | 14363.07 |
* The mean difference is significant at the 0.05 level.
Table 5: Post Hoc multiple comparisons test (Tukey HSD method) for comparison of the mean differences of NAF ± standard error for different gossypol concentrations and control cells 24 hours post treatment.
48 Hours post treatment: ANOVA test revealed a statistically insignificant difference between mean values of NAF of HEp-2 cells treated with different gossypol concentrations compared to that of control cells 48 hours post treatment (P value = 0.40) (table 6).
| Sum of Squares | df | Mean Square | F | Sig. | |
|---|---|---|---|---|---|
| Between Groups | 7.676 | 5 | 1.535 | 2.465 | .40* |
| Within Groups | 4.858 | 78 | 6.228 | ||
| Total | 5.626 | 83 |
* The mean difference is significant at the 0.05 level.
Table 6: ANOVA test for the mean values of NAF of different gossypol concentrations and control cells 48 hours post treatment.
DNA fragmentation results
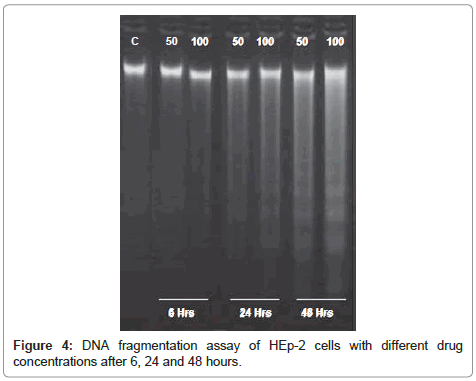
DNA fragmentation was not observed in the control groups over different durations of incubation as indicated by the absence of any detectable DNA laddering in these groups.
The study of internucleosomal DNA fragmentation in HEp-2 cells treated with different concentrations of gossypol over different durations revealed that at 6 hours post treatment, the DNA laddering that indicated DNA fragmentation was not obvious with either 50μM or 100μM gossypol concentrations (figure 4).
At 24 hours, the DNA laddering showed an obvious DNA fragmentation with 50μM gossypol concentrations, although DNA laddering was indistinct with 100μM gossypol concentration (figure 4).
After 48 hours, a more obvious DNA laddering with 50μM and 100μM gossypol concentrations was noted (figure 4).
Discussion
The diversity in techniques used for estimation of either necrotic and/or apoptotic changes of cancer-treated cells is quite important because the effectiveness of anticancer drugs is directly related to the maximum apoptotic effect on tumor cells, which is genetically controlled, and at the same time, the minimal necrotic effect of the drug on both neoplastic and normal surrounding cells. In other words, like a double-edged sword, every defect or abnormality along the apoptotic pathways may also be an interesting target of cancer treatment. Drugs or treatment strategies that can restore the apoptotic signalling pathways towards normality have the potential to eliminate cancer cells, which depend on these defects to stay alive [20].
Since the cytotoxicity assay only indicates whether the cultured cells are viable (with intact cell membranes) or not (with permeable cell membranes) [21] and since the loss of cell viability and membrane integrity in treated cultured cells could have resulted from either necrosis or late stages of apoptosis and because the effectiveness of an anticancer drug is measured by its ability to induce target specific apoptosis rather than non specific necrosis of viable cells, for all these reasons, other assay(s) are needed to clarify whether the recorded loss of viability is the result of which type of cell death.
Analysis of DNA fragmentation by gel electrophoresis is perhaps the most common biochemical assay to detect apoptosis and to differentiate it from necrosis which never offers the DNA laddering seen with apoptosis. The importance of this technique stems from the fact that this assay utilizes inexpensive reagents and equipments, thereby representing an adding point for investigators at the bench where resources for more sophisticated cellular biological tool(s) might not be available. Another advantage of this procedure is that cells can be pelleted and stored indefinitely at -20°C prior to analysis [16].
However, it must be noted that early apoptotic changes do not produce detectable DNA laddering and hence cannot be estimated by gel electrophoresis.
The occurrence of internucleosomal DNA fragmentation, which characterizes late stages of apoptosis, was confirmed in the present study by DNA gel electrophoresis which revealed the ability of gossypol to induce such fragmentations. The DNA laddering, which appeared in HEp-2 cells treated with different concentrations of gossypol after 24 hours of treatment, confirmed the occurrence of DNA fragmentation which, in turn, indicated the occurrence of apoptosis. Extension of the treatment period of HEp-2 cells with different concentrations of gossypol to 48 hours resulted in a more obvious DNA laddering with 50μM and 100μM concentrations Thus, the DNA fragmentation assay used in this study was a successful aid that confirmed the occurrence of apoptosis at different rates with various drug concentrations over different treatment intervals [16]. However, an accurate quantitative estimation of apoptosis that could offer precise estimation of optimum effective gossypol concentration at optimum durations, in addition to confirmation of occurrence of suspected necrosis, was still an important need.
A novel nuclear morphometric analysis used in this study helped to augment the previous findings in a quantitative manner to achieve the goal of identifying the optimum drug concentration and duration as effective anticancer therapy against HEp-2 cell line. The parameters used for nuclear morphometry in this study (nuclear circularity and surface area) were used to measure the apoptotic changes and to calculate the nuclear area factor (NAF) which seemed to be a sensitive indicator for apoptotic changes since it is based on two important morphologic parameters of apoptosis [19,22].
The data recorded from nuclear morphometric analysis revealed a decrease in the mean values of NAF of treated HEp-2 cells when compared to control cells over different durations and drug concentrations reflecting the progressive increase in the amount of apoptotic cells confirmed by detection of a more obvious DNA laddering detected by gel electrophoresis.
The results of the statistical analysis of NAF showed a significant decrease in the mean NAF of HEp-2 cells treated with 50μM when compared to control group after 6 hours of drug application. This finding denotes that estimation of NAF as a direct indicator of apoptosis is a more sensitive tool for detection of earlier apoptotic signals when compared to DNA gel electrophoresis since DNA fragmentation (laddering) was not obvious until after 24 hours of drug application.
Absence of DNA laddering noted with this concentration after 6 hours might be due to early apoptotic changes that failed to produce DNA fragmentation. After 24 hours, the DNA fragmentation of apoptotic cells was detected and further increased after 48 hours as detected by the DNA laddering noted by gel electrophoresis.
These results suggest that calculation of the NAF for cells in culture appears to be a useful morphological indicator of the early apoptotic process. Since apoptosis is a complex and multi-step process, calculation of NAF should be combined with other assays, such as DNA fragmentation, to determine the extent and time course of the apoptotic process.
Conclusions
Based upon the results of the present study, it could be concluded that:
o Estimation of nuclear area factor (NAF) is a sensitive predictor of the early apoptotic effect of anti-cancer therapy.
o DNA fragmentation assay is a useful tool for detection of late apoptotic changes that discriminates apoptotic effects of anticancer drugs from necrotic ones.
References
- Fan CY (2004) Epigenetic alterations in head and neck cancer: prevalence, clinical significance, and implications. Curr Oncol Rep 6: 152-161.
- Ologe FE, Adeniji KA, Segun-Busari S (2005) Clinicopathological study of head and neck cancers in Ilorin, Nigeria. Trop Doct 35: 2-4.
- Chin D, Boyle GM, Theile DR, Parsons PG, Coman WB (2004) Molecular introduction to head and neck cancer (HNSCC) carcinogenesis. Br J Plast Surg 57: 595-602.
- Marcus B, Arenberg D, Lee J, Kleer C, Chepeha DB, et al. (2004) Prognostic factors in oral cavity and oropharyngeal squamous cell carcinoma. Cancer 101: 2779-2787.
- Yokoyama J, Ito S, Ohba S, Fujimaki M, Ikeda K (2011) A novel approach to translymphatic chemotherapy targeting sentinel lymph nodes of patients with oral cancer using intra-arterial chemotherapy - preliminary study. Head Neck Oncol 3: 42.
- Sun BC, Zhao XL, Zhang SW, Liu YX, Wang L, et al. (2005) Sulindac induces apoptosis and protects against colon carcinoma in mice. World J Gastroenterol 11: 2822-2826.
- Pergolizzi S, Santacaterina A, Adamo B, Franchina T, Denaro N , et al. (2011) Induction chemotherapy with paclitaxel and cisplatin to concurrent radiotherapy and weekly paclitaxel in the treatment of loco-regionally advanced, stage IV (M0), head and neck squamous cell carcinoma. Mature results of a prospective study. Radiat Oncol 6: 162
- Torrance CJ, Jackson PE, Montgomery E, Kinzler KW, Vogelstein B, et al. (2000) Combinatorial chemoprevention of intestinal neoplasia. Nat Med 6: 1024-1028.
- Yasui H, Adachi M, Imai K (2003) Combination of tumor necrosis factor-alpha with sulindac in human carcinoma cells in vivo. Ann N Y Acad Sci 1010: 273-277.
- Yasui H, Adachi M, Imai K (2003) Combination of tumor necrosis factor-alpha with sulindac augments its apoptotic potential and suppresses tumor growth of human carcinoma cells in nude mice. Cancer 97: 1412-1420.
- Ma L, Xie YL, Yu Y, Zhang QN (2005) Apoptosis of human gastric cancer SGC-7901 cells induced by mitomycin combined with sulindac. World J Gastroenterol 11: 1829-1832.
- Choi HJ, Kim HH, Lee HS, Huh GY, Seo SY, et al. (2003) Lactacystin augments the sulindac-induced apoptosis in HT-29 cells. Apoptosis 8: 301-305.
- Lindholm P (2005) Cytotoxic compounds of plant origin. Acta Universitatis Upsaliensis Appsala 574: 7-71.
- Wang X, Wang J, Wong SC, Chow LS, Nicholls JM, et al. (2000) Cytotoxic effect of gossypol on colon carcinoma cells. Life Sci 67: 2663-2671.
- Margherita F, Alan D, Glyn N (2001) Cell culture methods for in vitro toxicology. Kluwer Academic publications, USA; p9, 2000a; p 14, 2000b; p12, 2000c.
- Martin F, Mohamed A (2004) Apoptosis. Kluwer Academic publications, Dordrecht, Netherlands 4: p289, 2004a; p212, 2004b.
- Myrtle A (2002) Apoptosis, methods in pharmacology and toxicology: approaches to measurement and quantification. Humana press publications, USA; p. 1,2004a; p. 3, 2004b; p. 72, 2004c.
- Trask DK, Wolf GT, Bradford CR, Fisher SG, Devaney K, et al. (2002) Expression of Bcl-2 family proteins in advanced laryngeal squamous cell carcinoma: correlation with response to chemotherapy and organ preservation. Laryngoscope 112: 638-644.
- Mark A (2007) The Nuclear Area Factor (NAF): a measure for cell apoptosis using microscopy and image analysis. Modern Research and Educational Topics in Microscopy 3: 378-384.
- Wong RS (2011) Apoptosis in cancer: from pathogenesis to treatment. J Exp Clin Cancer Res 30: 87.
- Wei-Shou H, Sadettin S (2006) Cell culture technology for pharmaceutical and cell-based therapies. Taylor and Francis group, USA; p. 1.
- Daniel B, DeCoster MA (2004) Quantification of sPLA2-induced early and late apoptosis changes in neuronal cell cultures using combined TUNEL and DAPI staining. Brain Res Brain Res Protoc 13: 144-150.
Citation: Afifi NS, Abdel-Hamid ES, Baghdadi HM, Mohamed AF (2012) Nuclear Area Factor as a Novel Estimate for Apoptosis in Oral Squamous Cell Carcinoma -Treated Cell Line: A Comparative in-vitro Study with DNA Fragmentation Assay. J Clinic Experiment Pathol 2:107. DOI: 10.4172/2161-0681.1000107
Copyright: © 2012 Afifi NS, et al. This is an open-access article distributed under the terms of the Creative Commons Attribution License, which permits unrestricted use, distribution, and reproduction in any medium, provided the original author and source are credited.
Share This Article
Recommended Journals
Open Access Journals
Article Tools
Article Usage
- Total views: 15488
- [From(publication date): 3-2012 - Dec 20, 2024]
- Breakdown by view type
- HTML page views: 10924
- PDF downloads: 4564
