Make the best use of Scientific Research and information from our 700+ peer reviewed, Open Access Journals that operates with the help of 50,000+ Editorial Board Members and esteemed reviewers and 1000+ Scientific associations in Medical, Clinical, Pharmaceutical, Engineering, Technology and Management Fields.
Meet Inspiring Speakers and Experts at our 3000+ Global Conferenceseries Events with over 600+ Conferences, 1200+ Symposiums and 1200+ Workshops on Medical, Pharma, Engineering, Science, Technology and Business
Research Article Open Access
Modeling Biodegradation of Polyethylene with Memoryless Behavior in Metabolic Consumption
| M. Watanbe1* and F. Kawai2 | |
| 1Graduate School of Environmental Science, Okayama University, Okayama, Japan | |
| 2Center for Nanomaterials and Devices, Kyoto Institute of Technology, Japan | |
| Corresponding Author : | M. Watanbe Graduate School of Environmental Science Okayama University, Okayama, Japan E-mail: watanabe@ems.okayama-u.ac.jp |
| Received March 07, 2012; Accepted April 17, 2012; Published April 19, 2012 | |
| Citation: Watanbe M, Kawai F (2012) Modeling Biodegradation of Polyethylene with Memoryless Behavior in Metabolic Consumption. J Bioremed Biodegrad 3:146. doi: 10.4172/2155-6199.1000146 | |
| Copyright: © 2012 Watanbe M, et al. This is an open-a ccess article distributed under the terms of the Creative Commons Attribution License, which permits unrestricted use, distribution, and reproduction in any medium, provided the original author and source are credited. | |
Related article at Pubmed Pubmed  Scholar Google Scholar Google |
|
Visit for more related articles at Journal of Bioremediation & Biodegradation
| Introduction |
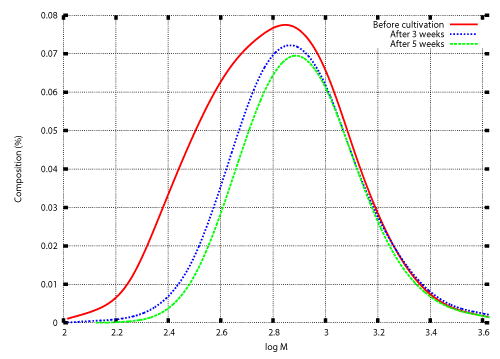
| Microbial depolymerization processes are classified into exogenous type processes and endogenous type processes. In an exogenous type depolymerization process, molecules reduce in size by liberating monomer units from their terminals. Polymers subject to exogenous depolymerization processes include Polyethylene (PE) and Polyethylene glycol (PEG). PE is a long-chain n-alkane. Oxidation of an n-alkane is started by hydroxylation to produce the corresponding primary (or secondary) alcohol, which is oxidized further to an aldehyde (or ketone) and then to an acid. Carboxylated n-alkanes are structurally analogous to fatty acids and subject to â-oxidation processes to produce depolymerized fatty acids consisting of two carbon units (acetic acid). Gel permeation chromatography (GPC) analysis of polyethylene wax (PEwax) before and after cultivation of a bacterial consortium KH- 12 showed that small molecules are consumed faster than large ones [1]. Figure 1 shows GPC profiles before and after cultivation of fungus Aspergillus sp. AK-3 for three and five weeks. |
| PE biodegradation involves two essential factors, the gradual size reduction of large molecules due to â-oxidation, and the direct consumption or absorption of small molecules by cells. A PE molecule liberate a monomer unit from its terminal in one cycle of â-oxidation, and it reduces in size undergoing successive â-oxidation processes. A mathematical model based on those two factors was proposed to study PE biodegradation processes [2-4]. |
| PEG is one of the polyethers whose chemical structures are represented by the general structural formula HO(R – O)nH (PEG: R=CH2CH2), and is metabolized by liberating C2 compounds [5,6]. Techniques developed for PE biodegradation were extended to exogenous depolymerization processes of PEG [7]. Inverse problems were solved numerically for degradation rates based on the weight distribution with respect to molecular weight before and after cultivation of a microbial consortium E-1. Once a degradation rate was found, the transition of the weight distribution was simulated by solving an initial value problem numerically. Dependence of degradation rates on time was also considered in modeling and simulation of microbial depolymerization processes of PEG [8-11]. A model originally proposed for endogenous type depolymerization processes was applied to an exogenous depolymerization process of PEG [12]. |
| Unlike exogenous type depolymerization processes, molecules are cleaved at arbitrary positions in endogenous type depolymerization processes. Example of polymers subject to endogenous type depolymerization processes include Polyvinyl alcohol (PVA). PVA is depolymerized in a succession of two processes: oxidation of a couple of pendant hydroxyl groups, either by oxidase or dehydrogenase, followed by hydrolysis. Cleavage of a carbon-carbon chain results from those processes at a carbonyl group and an adjacent methylene group [13]. Matsumura et al. [14] proposed a different metabolism of PVA based on oxidation of a hydroxyl group and aldolase reaction of a monoketone structure, which leads to cleavage of a carbon-carbon chain between a methylene group adjacent to a carbonyl group and an adjacent hydroxymethylene group. In either case, PVA is depolymerized by oxidation and the resultant cleavage of a carboncarbon chain. A mathematical model for endogenous depolymerization process was proposed, and an enzymatic depolymerization process of PVA was studied [15,16]. Mathematical model originally proposed for the enzymatic degradation of PVA was applied to enzymatic hydrolysis of polylactic acid (PLA), and the degradability of PVA and PLA was compared [17]. Dependence of degradation rate on time was considered for depolymerization processes of PLA [18]. |
| In this study, PE biodegradation is revisited with a novel mathematical theory. A model originally developed for endogenous depolymerization processes is applied to the exogenous depolymerization processes of PE. Memoryless behavior of degraded molecules leads to exponential distribution with respect to the molecular weight. Derivation of the model is described. Experimental results are introduced into analysis and an inverse problem is solved numerically for a degradation rate. An initial value problem is solved numerically to simulate the transition of the weight distribution. Numerical techniques are illustrated and numerical results are presented. |
| Modeling Exogenous Depolymerization Processes of Xenobiotic Polymers |
| In depolymerization processes, the weight is shifted from classes of large molecules to classes of small molecules. In order to formulate microbial depolymerization processes, let w(t,M) be the weight distribution with respect to the molecular weight M at time t. Suppose that a molecule with molecular weight M is depolymerized in an exogenous type depolymerization process to become a molecule with molecular weight K. The amount M-K is metabolized in the depolymerization process. In general, let P0(t,K,M) be the time rate of increase in W(t,K) due to the depolymerization of molecules with molecular weight M, and P1(t,K,M) be the total amount metabolized in production of molecules with molecular weight K from those with molecular weight M. Let p(t,K,M) = p0(t,K,M) + p1(t,K,M). Then p(t,K,M) is the time rate of decrease in w(t,M) to yield the increase P0(t,K,M) in w(t,K). Let C(A,B) be the class of all molecules with molecular weight between A and B. The weight decrease in C(A,B) per unit time is |
 (1) (1) |
| while the weight increase per unit time is |
 (2) (2) |
| The total weight in C(A,B) present at time t is |
| |
| and its rate of change |
 |
| equals the difference between the quantities (1) and (2), |
 (3) (3) |
| Substituting the expression |
 |
| which holds for a function with continuous partial derivatives, equation (3) becomes |
| |
| Since this equation holds for an arbitrary interval [A,B], |
| |
| and w = w(t,M) is a solution of |
 (4) (4) |
| [15,16,19] |
| In the transition of the weight from W(t,M) to w(t,K), each of molecules with molecular weight M loses the amount M-K to become molecules with molecular weight K, while the number of degraded molecules is preserved. The number of degraded molecules is proportional to |
 |
| and the increase in w(t,K) is |
 |
| This amount equals p0(t,K,M), |
 |
| Now the equation (4) becomes |
| |
| Suppose that γ(t,M) is the loss of amount from w(t,M) per unit time and per unit weight. The amount of loss from w(t,M) per unit time is γ(t,M)w(t,M), and it is expressed in terms of the integral of p(t,K,M), |
| |
| For Kε[0,M], let q(K,M) denote the decrease in w(t,M) per unit weight in the transition from w(t,M) to w(t,K). Then |
| |
| The equations (5), (6), and (7) lead to |
| |
| Given an initial weight distribution f(M), equation (8) and the initial condition |
| w(0,M) = f(M) (9) |
| form an initial value problem, provided the degradation rate γ(t,M) is given. Given an additional weight distribution g(M) at, t = T(T>0) equation (8), the condition (9), and the condition |
| w(0,M) = g(M) (10) |
| form an inverse problem to determine the degradation rate γ(t,M), for which the solution of the initial value problem (8) and (9) also satisfies the condition (10). Inputs of the inverse problem are an initial weight distribution f(M) and a final weight distribution g(M), and an outcome is the degradation rate γ(t,M). |
| Removal of Time Factor from the Degradation Rate |
| In microbial depolymerization processes, time factors of degradability include temperature, dissolved oxygen, and microbial population. Those factors act on polymer molecules evenly regardless of size, and the degradation rate γ(t,M) is a product of a function of t, σ(t), and a function of M, λ(M). Equation (8) becomes |
| |
| Let |
| |
| Then |
 |
| and the equation (11) becomes |
 (12) (12) |
| When λ(M) is given, equation (12) and the initial condition |
| W (0,M ) = f (M ) (13) |
| form an initial value problem. Equation (12), the initial condition (13) and the condition |
| W (T,M ) = g (M ), (14) |
| form an inverse problem to find the degradation rate λ(M) for which the solution of the initial value problem (12) and (13) also satisfies the condition (14). The initial value problem (8) and (9) corresponds to the initial value problem (12) and (13), and the inverse problem (8), (9) and (10) corresponds to the inverse problem (12), (13) and (14), provided |
| |
| Memoryless Behavior in Microbial Consumption and Exponential Distribution in Liberation of Monomers |
| The truncation of monomers in an exogenous depolymerization process is memoryless, which means that the amount truncated from a molecule does not depend on the previous truncation. Let J be the amount truncated from a molecule in an exogenous depolymerization process. The memoryless behavior leads to the exponential distribution [17]. |
| |
| It is the probablility of the event in which the metabolized amount equals J. In an exogenous depolymerization process, amount M-K is truncated from a molecule with molecular weight M to yield a molecule with molecular weight K. Substitution of J = M-K leads to the expression of q(K,M) given by |
| |
| When q(K,M) is given by the expression (16), equation (12) becomes |
| |
| where |
 (18) (18) |
| Differentiation of the both sides of the equation (17) results in |
 (19) (19) |
| and substitution of the expression for the integral obtained from equation (17) leads to |
 (20) (20) |
| In section 5 the inverse problem is solved numerically to determine the degradation rate λ(M) for which the solution of the initial value problem (20) and (13) also satisfies the condition (14) for c(M) and d(K) given by the expressions (18) and (21). |
| The parameter ñ is often referred to as the intensity of the exponential distribution. In order to determine the value of the parameter, liberation of monomer units in the exogenous depolymerization process is considered. In an exogenous type depolymerization process, molecules reduce in size through successive liberation of monomer units. Let L be the molecular weight of a monomer unit truncated from a terminal of a molecule in one cycle of depolymerization process. In case of the â-oxidation, L = 28 (CH2CH2). Let TJ be the time it takes for a molecule to reduce in size by the molecular weight J. The liberation of monomer units occurs successively, and T2L = 2TL. In unit of time, the probability for loss of two monomer units is one half of the probability for loss of one monomer unit, and |
| q(M − L,M ) = 2q(M − 2L,M ) |
| or |
| ρe−ρ L = 2ρe−2ρ L , |
| which leads to |
 (21) (21) |
| Computational Results for an Exogenous Depolymerization Process of Polyethylene |
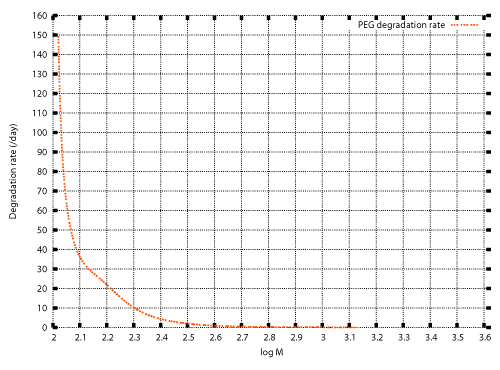
| In previous studies, numerical techniques were developed for the inverse problem to determine the degradation rate λ(M) for which the solution of the initial value problem (20), (13) also satisfies the condition (14) [12]. Those techniques are described in the appendix. The weight distributions before and after cultivation of Aspergillus sp. AK-3 for three weeks (Figure 1) were set as the initial and final conditions, and the inverse problem was solved numerically. Figure 2 shows the numerical result. |
| \ |
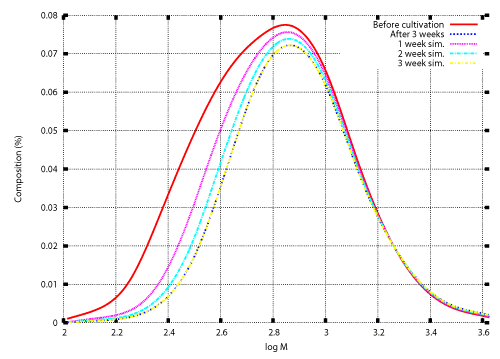
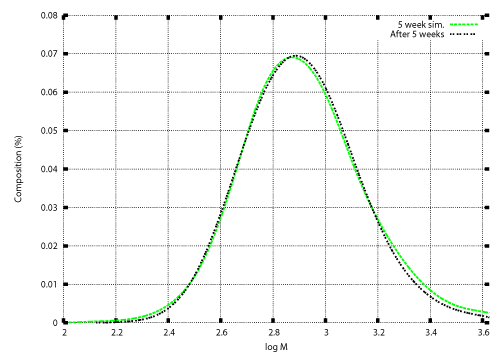
| Once the degradation rate is found, transition of the weight distribution is simulated by solving the initial value problem (12), (13). Numerical techniques to solve the initial value problem was developed in previous studies [12,15-17]. Those techniques are also illustrated in the appendix. Figure 3 and Figure 4 show numerical results based on the degradation rate. Figure 3 shows the experimental results and numerical results for the transition of weight distribution for three weeks. Figure 4 shows the experimental result and a numerical result for the weight distribution of PEwax after cultivation for five weeks. |
| Discussion |
| No information on the weight distribution after five weeks was used to obtain the degradation rate shown in Figure 2. Nevertheless an acceptable agreement between the experimental result and the numerical result is demonstrated in Figure 4. The numerical result was obtained using the model with time independent degradation rate. The numerical result shown in Figure 4 indicate that the time factor of the degradation rate was almost constant over the degradation period. The only time factor in this case was the microbial population. The numerical result indicate that the microbial population reached the constant value at an early stage of cultivation, and maintained the constant value for the five weeks of cultivation. |
| The mathematical model originally developed for endogenous depolymerization processes is adapted to exogenous depolymerization processes of PE. Some other authors proposed similar models including governing equations for particle-size distribution in simultaneous binary fragmentation and aggregation reactions or population balance equation [20-22], equations for mass balance for polymers subject to random chain scission, repolymerization reactions, and chain-end scission and related topics [23,24], and an integro-partial differential equation of a first-order bond-breaking process for random scission and a first-order recombination process [25]. |
| In this study, the model based on the exponential distribution of degraded molecules is derived. Numerical results show that the model is widely applicable not only to endogenous depolymerization processes, but also to exogenous depolymerization processes, and that depolymerization processes of mixed type can also be analyzed. |
| Acknowledgements |
| This work was supported by JSPS KAKENHI 20540118. |
References
|
Figures at a glance
 |
 |
 |
 |
| Figure 1 | Figure 2 | Figure 3 | Figure 4 |
Post your comment
Relevant Topics
- Anaerobic Biodegradation
- Biodegradable Balloons
- Biodegradable Confetti
- Biodegradable Diapers
- Biodegradable Plastics
- Biodegradable Sunscreen
- Biodegradation
- Bioremediation Bacteria
- Bioremediation Oil Spills
- Bioremediation Plants
- Bioremediation Products
- Ex Situ Bioremediation
- Heavy Metal Bioremediation
- In Situ Bioremediation
- Mycoremediation
- Non Biodegradable
- Phytoremediation
- Sewage Water Treatment
- Soil Bioremediation
- Types of Upwelling
- Waste Degredation
- Xenobiotics
Recommended Journals
Article Tools
Article Usage
- Total views: 13254
- [From(publication date):
April-2012 - Jan 31, 2025] - Breakdown by view type
- HTML page views : 8854
- PDF downloads : 4400
